

 PDF
PDF ePub
ePub Citation
 Print
Print


INTRODUCTION
The incidence of dementia is increasing rapidly worldwide as populations age, which is increasing social burdens. Alzheimer's disease (AD) is the most common of the various etiologies of dementia.1 Reportedly 1.0–2.5% of elderly people with normal cognition progress to dementia annually, while 10–15% of mild cognitive impairment (MCI) patients progress to AD within 5 years.2 MCI is thus the prodromal state prior to AD.3 This trend has resulted in recent research and health policy strategies focusing on the early diagnosis and identification of biomarkers of AD. Therefore, a brief cognitive screening test that is easy to use in outpatient clinics is crucial for the early diagnosis of dementia.
The Mini Mental Status Examination (MMSE), which was developed in 1975, is the most widely used screening tool in clinical practice. The MMSE is both easy to apply and rapid.4 However, the sensitivity of the MMSE for detecting MCI or early-stage dementia is insufficient due to a ceiling effect. The ceiling effect is a limitation of measurement which cannot distinguish patients with from normal elderly.5 Furthermore, the MMSE is greatly influenced by education level and is not useful for illiterate patients.6 To overcome this limitation, the Montreal Cognitive Assessment (MoCA) was developed in 2005 as a brief screening tool for MCI.7 It has been demonstrated that the MoCA can sufficiently assess various cognitive domains such as executive function and attention that could not be assessed well using the MMSE. The MoCA is also known to be more sensitive than the MMSE for assessing MCI.
Gait disturbance in the elderly, termed “senile gait,” has received considerable attention during the past decade. It is well known that gait impairment in the elderly is a major factor contributing to hospitalization, institutionalization, and death.8 Gait deficits and falls are more common in patients with dementia than in cognitively normal elderly persons,9 with the severity of gait disturbance being closely related to the severity of cognitive impairment.10 The correlation between cognitive impairment and gait disturbance is well established, as reported in many recently published papers.111213 Executive function is the cognitive domain that is most relevant to gait performance, and it plays a key role in the planning, goal-directed action, and coordination of complex locomotion.14
Based on this evidence, the gait status is well reflected in cognitive screening tests that assess executive function. This makes it possible to assess not only the cognitive function but also the gait status in the elderly, with appropriate interventions then being applied if necessary. However, to our knowledge no previous study has investigated the correlation between gait parameters and scores on cognitive screening tests such as the MMSE and MoCA in patients with cognitive impairment. The purpose of the present study was therefore to determine the correlation between cognitive screening scores and gait parameters in patients with cognitive impairment using objective gait measurements.
Go to : 
METHODS
This study had a prospective, cross-sectional, observational design. The primary endpoint was to investigate the correlation between dementia screening tools and gait parameters, and the main secondary endpoint was to compare the gait status between MCI and dementia patients. An additional secondary endpoint was to evaluate the correlation between cognitive function and gait parameters.
Subjects
This study enrolled 37 subjects. The inclusion criteria were as follows: 1) aged 60–90 years, 2) score on the Korean version of the MMSE for screening dementia (MMSE-DS) below two SDs compared to age- and education-matched healthy persons, 3) able to walk, and 4) willing to participate in the study. The exclusion criteria were as follows: 1) difficulty walking due to additional medical issues such as orthopedic or neurological conditions, 2) presence of cardiopulmonary disease, 3) high risk of falling during the examinations, 4) psychiatric disease such as depression or anxiety, or 5) abnormal brain CT or MRI findings in an initial examination of dementia, including vascular burden or ventricular enlargement. Because psychiatric diseases were excluded, none of the included participants were taking medications (including antipsychotic medications) that are known to cause gait disturbance.15 We could not exclude the presence of hypertension, but none of the participants were taking flunarizine or cinnarizine.
All of the study procedures were approved by the Human Research Ethics Committee of Haeundae Paik Hospital (IRB No: 2018-04-022), and all of the participants provided written informed consent.
Study design and neuropsychological battery
The Korean version of the MMSE developed for screening dementia (MMSE-DS) was applied as a screening test at Dementia Support Center in Korea. Persons with cognitive impairment suspected to be dementia were referred to Hospital for a definitive diagnosis. We defined cognitive impairment as cognitive decline quantified by an MMSE-DS score that was at least two SDs below the mean values for age- and education-matched healthy persons.
After being interviewed by a neurologist, all participants were assessed for a diagnosis of dementia using the Korean version of the Consortium to Establish a Registry for Alzheimer's Disease (CERAD-K) as a neuropsychological battery, the Korean version of the Instrumental Activities of Daily Living (K-IADL), and the Korean version of the MoCA developed for screening dementia (MoCA-K), a brain CT scan, and a laboratory test. The neurologist provided a final diagnosis after all of the tests had been completed.
Gait analysis
Objective gait quantification was performed using three-dimensional (3D) motion-capture system at Haeundae Paik Hospital. We used the VICON (Oxford, UK) motion analysis system at a sampling rate of 100 Hz to assess the spatiotemporal variables of gait performance. This 3D motion-capture system has high test-retest and intertester reliabilities.18 The subjects were instructed to walk along a 6-m track while being monitored by 12 infrared cameras installed on the ceiling for capturing their motion in a quiet and comfortable environment. All participants were instructed to walk at their usual pace without any walking aids, and attempted to perform the test three times. Our 3D motion-analysis system captured a single gait cycle in the middle of the track. All data were calculated as the average of the gait parameters in three trials.
A recent study of gait analysis in the elderly classified the spatiotemporal gait performance into the following five domains19: 1) the “rhythm” domain was characterized by cadence, step time, stride time, swing time, stance time, and single-support time, 2) the “phases” domain was characterized by swing, stance, single-support time, and double-support time, 3) the “pace” domain was characterized by walking speed, step length, and stride length, 4) the “base-of-support domain” was characterized by step width and step-width variability, and 5) the “variability” domain was characterized by variability parameters other than step-width variability. In the present study we measured cadence, step time, stride time, single-support time, double-support time, stance phase, walking speed, step length, stride length, and step width. We also estimated the gait variability by calculating the coefficient of variance (CoV) as (SD/mean)×100%.
Statistical analyses
The SPSS software (version 18, SPSS Inc., Chicago, IL, USA) was used for statistical analyses. Continuous variables are expressed as mean±SD values. Categorical variables in demographic data were analyzed using the chi-square test. The Pearson correlation coefficient was used for investigating correlations. The independent t-test was adopted for comparing the gait status between MCI and AD. We used analysis of covariance (ANCOVA) to adjust for confounding factors in correlation analyses. Because age is a major factor correlated with the dementia score, we attempted to determine the net effect of gait on MMSE-DS and MoCA-K by adjusting age using ANCOVA.
Go to :
RESULTS
Table 1 lists the demographic data of all participants in the MCI and AD groups, including age, sex, height, weight, body mass index, and length of education. The 37 included subjects were aged 76.70±7.52 years (range 61–89 years) and consisted of 15 males and 22 females with a length of education of 7.51±3.96 years (range 0–14 years). The mean ages were 74.72 years and 78.58 years in the MCI and AD groups, respectively (p=0.120), the corresponding mean heights were 156.69 cm and 157.84 cm (p=0.696), and the corresponding mean lengths of education were 7.72 years and 7.32 years (p=0.760).
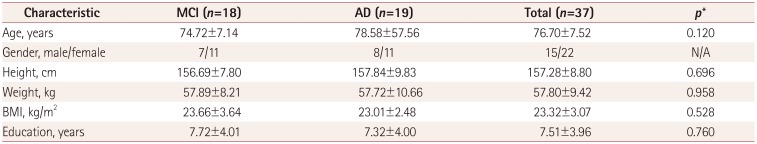
Table 1
General characteristics of the participants
![]()
The results of the cognitive screening tests and the K-IADL are summarized in Table 2. The mean MMSE-DS and MoCA-K total scores were 19.05 and 14.70, respectively. The mean MMSE-DS score did not differ significantly between the MCI and AD groups (20.22 and 17.95, respectively, p=0.068), while the mean MoCA-K score was significantly higher in the MCI group than in the AD group (16.78 and 12.74, respectively, p=0.015). The attention and language subscale scores on the MoCA-K differed significantly between the two groups, whereas there were no significant differences in the subscale scores on the MMSE-DS. The K-IADL is a major tool for discriminating MCI and AD, and the mean K-IADL score differed significantly between the two groups (p<0.001).
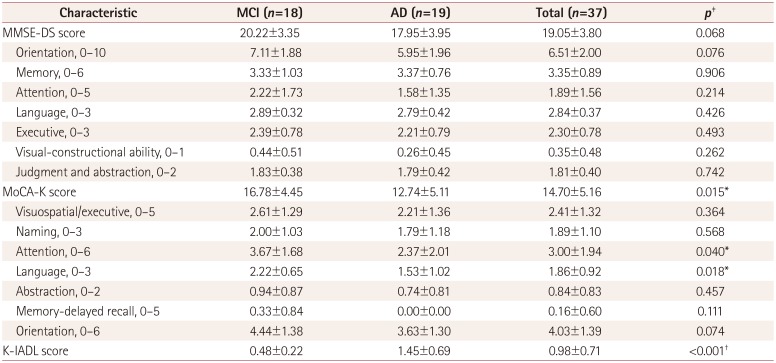
Table 2
Cognitive assessments and scores on the K-IADL
Data are mean±SD or n values.
*p<0.05, †p<0.01, ‡Independent t-test.
AD: Alzheimer's disease, K-IADL: Korean Instrumental Activities of Daily Living, MCI: mild cognitive impairment, MMSE-DS: Mini Mental Status Examination-dementia screening, MoCA-K: Korean version of the Montreal Cognitive Assessment.
![]()
In addition to the MoCA-K and K-IADL scores, the following gait parameters also differed between the MCI and AD groups after adjusting age: cadence, step time, stride time, double-support time, and walking speed (Table 3). There were no differences in CoV between MCI and AD for any of the gait parameters that reflect gait variability. The cadence, walking speed, step length, and stride length were significantly lower in the AD group than in the MCI group, while the step time, stride time, double-support time, and stance phase were significantly higher in the AD group. There was no significant intergroup difference in step width.
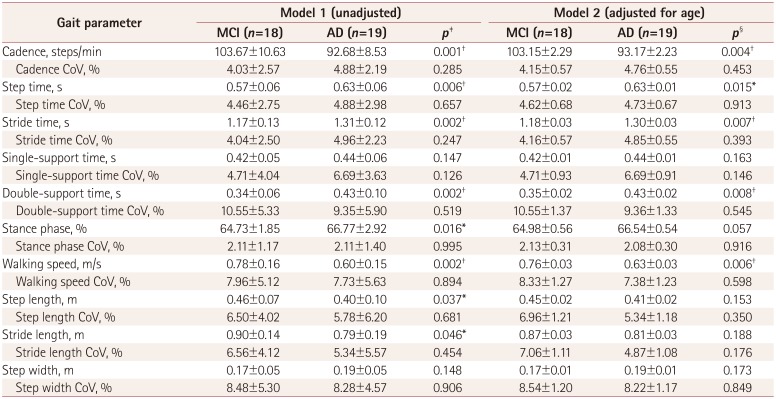
Table 3
Comparison of gait performance between MCI and AD patients
![]()
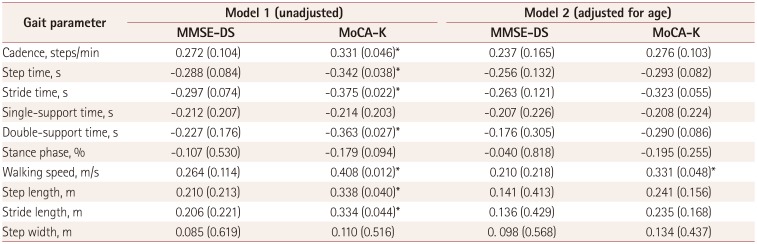
There were no significant correlations between the total MMSE-DS score and any of the gait parameters in either group, whereas the total MoCA-K score was significantly correlated with most of the gait parameters including cadence, step time, stride time, double-support time, stance phase, walking speed, step length, and stride length in both groups (Table 4). Among these gait parameters, walking speed exhibited the strongest correlation with the total MoCA-K score (r=0.408, p<0.05; Fig. 1). After adjusting age, there was a strong correlation between MoCA-K score and walking speed (r=0.331, p=0.048).
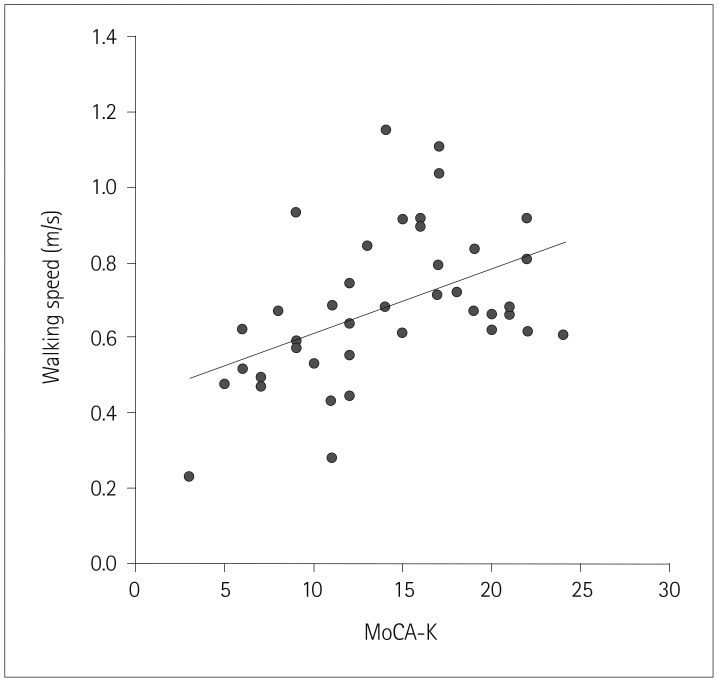 | Fig. 1Correlation between the walking speed and the MoCA score. Walking speed as determined by the three-dimensional motion-capture system was significantly correlated with the score on the MoCA-K in patients with mild cognitive impairment or Alzheimer's disease (r=0.408, p<0.05). MoCA-K: Korean version of the Montreal Cognitive Assessment.
|
Table 4
Correlation between the screening scores and gait parameters
![]()
The correlations between the gait parameters and the subscale items of the CERAD-K, which is a precise neuropsychological test rather than a cognitive screening test, were analyzed (Table 5). The results indicated that walking speed was correlated with verbal fluency (reflecting executive function), word-list memory, and word-list recall (reflecting short-term memory and delay memory, respectively).
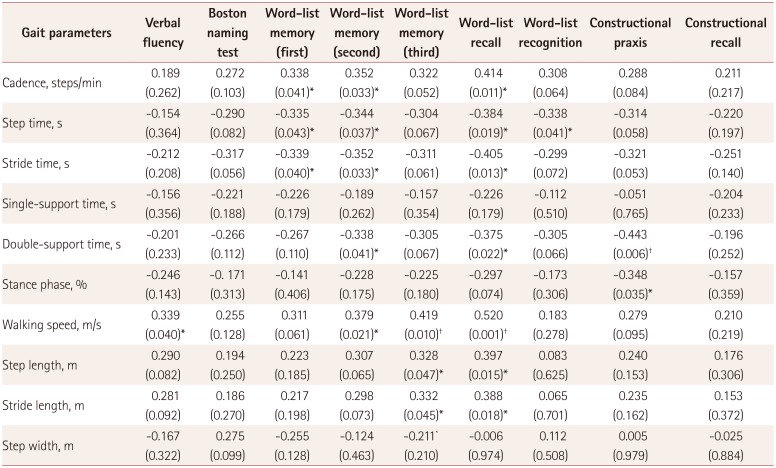
Table 5
Correlation between the items of the Korean version of the Consortium to Establish a Registry for Alzheimer's Disease and gait parameters
![]()
Go to :
DISCUSSION
The results obtained in this study demonstrate that the MoCA-K assesses gait status more accurately than does the MMSE-DS, which is in accordance with previous reports. Some performance criteria in the timed up-and-go with dual-task test were previously found to be significantly correlated with the MoCA score but not associated with the MMSE score in subjects older than 60 years who exercised regularly.20 Another study demonstrated that the MoCA was more closely associated with fragility status than was the MMSE.21 Previous reports have demonstrated that the MoCA has a lower ceiling effect. In a comparative validation study of the MoCA and the MMSE for evaluating MCI and AD, the MoCA exhibited high sensitivities of 90% and 100%, respectively, whereas the MMSE exhibited sensitivities of only 18% and 78%.18 Those findings support the strengths and advantages of the MoCA-K over the MMSE-DS as a dementia screening tool. Our results have demonstrated that the MoCA-K can discriminate MCI from AD and be used to quantify the gait status and frontal lobe function.
We can postulate several possible explanations for our results. First, the MoCA-K may be a better tool for determining gait status because the ceiling effect is smaller than that for the MMSE-DS.202122 Indeed, the MoCA-K scores in the present study differed significantly between the MCI and AD groups, whereas the MMSE-DS scores did not. It is well established that gait is closely related to cognition in patients with dementia. Our results also showed that memory and executive function were significantly correlated with gait parameters in CERAD-K. We postulate that the MoCA-K score reflects the gait performance as well as changes in cognition in MCI.
Second, the MoCA-K contains items for evaluating frontal lobe function. Frontal lobe function, and in particular executive function, is closely related to the initiation and modulation of gait performance in humans.23 Indeed, normal-pressure hydrocephalus and vascular parkinsonism—wherein the projection fibers from the basal ganglia to the frontal cortex are disrupted—cause gait disturbance. We postulate that the MoCA-K can be used to determine the gait status because this tool assesses frontal lobe function, whereas the MMSE-DS does not.
This study is the first to have quantitatively investigated gait status and compare the scores on screening tests for dementia using a 3D motion-capture system. Such systems are considered the most accurate in the field of gait research. We found that all gait parameters including cadence, step time, stride time, double-support time, walking speed, step length, and stride length were significantly associated with the MoCA-K score. Gait parameters interact each other, but walking speed is a representative gait parameter that is commonly used for investigating physical activity and gait performance in the elderly.22
We applied the CERAD-K as a precise neuropsychological assessment containing word fluency, Boston naming, memory recall (verbal and constructional), and apraxia tests. We found that walking speed was significantly correlated with word fluency and memory function. Although memory function is the most-prominent cognitive domain associated with gait performance, scores on the word fluency test were also found to be related to gait status, which is in accordance with previous reports.11 Our results indicated that apraxia is not associated with cadence, walking speed, or stride length (except for the double-support time). These findings suggest that gait disturbance in patients with cognitive impairment is associated with a hypokinetic gait rather than gait apraxia.
We also found that all of gait parameters of the MCI patients differed significantly from those of early-stage dementia patients. The patients with MCI could perform physical activities at a normal level, unlike the patients with dementia. Many reports on gait impairment in MCI have been published over the past few decades, and several studies have demonstrated that gait impairment is the earliest sign of cognitive decline.11 Additionally, gait and physical activity are strongly correlated with the prognosis of patients with dementia.23 Our results suggest that, like the activities of daily living, gait status differs between AD and MCI. Based on our results and previous evidence, measuring the gait status should be considered for the screening and monitoring of dementia.
The MMSE-DS is used in Korea for the nationwide screening of dementia in accordance with the guidelines set by the Ministry of Public Health and Welfare. The current findings suggest that the current screening system should be replaced by new screening tools. Our results propose that combining the MoCA-K with the K-IADL would constitute the most-appropriate screening tool for dementia.
This study was subject to the following limitations: 1) the sample was small, 2) we could not compare the results for the patients with those of age-matched controls, 3) we could not check various walking situations such as fast walking, dual-task walking, and running, 4) we could not estimate the exact gait variability due to small number of trials, and 5) despite the application of several exclusion criteria, we could not perfectly control various confounding factors including personal variability. Future studies should therefore investigate various gait patterns, gait variability, considering additional confounding factors.
In conclusion, this study has shown that the MoCA-K is a more helpful screening tool than the MMSE-DS for reflecting gait status as well as discriminating MCI and AD. There was a significant difference in the gait parameters between the MCI and AD groups as well as MoCA-K and K-IADL scores. Our results suggest that the MoCA-K has several advantages over the MMSE-DS for screening dementia.
Go to :
 XML Download