

 PDF
PDF Citation
 Print
Print


INTRODUCTION
Tacrolimus (TAC) is a calcineurin inhibitor (CNI) widely used to prevent acute rejection after kidney transplantation (KT). While underdosing of TAC may result in acute rejection and immunologic sensitization, TAC overdose can cause CNI toxicity, cytomegalovirus (CMV) infection, and BK virus infection, which are all related to poor renal allograft outcome.12345 Although therapeutic drug monitoring for TAC is universally applied, the optimal TAC trough level for different time points after KT to prevent both the risks of a biopsy-proven acute rejection (BPAR) and drug toxicity has not yet been well established.
Previous studies regarding the relationship between TAC concentration and transplant outcomes have shown conflicting results. A study of 1,304 kidney transplant recipients (KTRs) that included 3 randomized-controlled trials678 revealed that there was no association between TAC trough level measured at five time points within 6 months after KT and the incidence of BPAR during the first year after transplantation.9 However, several studies demonstrated that lower TAC trough levels at each period within 1 year post-transplantation were significantly associated with a higher risk of acute rejection in the first 1, 6, and 12 months post-transplantation,10111213 and during a mean follow up of 2 years.14 Although some previous studies have reached a consensus about the TAC concentration-effect relationship, these studies also indicated disagreement on optimal TAC cutoff levels according to post-transplant periods.1011121314 Furthermore, The Kidney Disease: Improving Global Outcomes guidelines suggest that 5–15 ng/mL of TAC trough levels should be used during the first 2–4 months post-transplantation, and then reduced thereafter in stable KTRs to minimize toxicity, with a low quality of evidence.15
The aim of this study was to determine the association between TAC trough levels measured at different time points after KT and 1) the incidence of BPAR; 2) renal allograft function; 3) the development of de novo donor-specific antibody (dnDSA); and 4) the incidence of CNI toxicity and opportunistic infections, such as BK viremia and CMV infection, during the first year after KT.
METHODS
Patients and immunosuppressive treatment
A total of 278 consecutive KTRs, aged between 19 and 70 years, who underwent KT at Kyungpook National University Hospital were enrolled in this study. Induction treatment with intravenously administered interleukin‐2 receptor blocker or antithymocyte globulin was performed in all the cases. All patients received TAC, mycophenolate mofetil, and steroids as immunosuppressant therapy. TAC was initially given at a dose of 0.05 mg/kg every 12 hours. TAC trough levels were obtained from peripheral blood samples taken 12 hours after the administration of the last TAC dosage. TAC trough levels were measured using the Architect TAC assay (Abbott Diagnostics, Lake Forest, IL, USA). TAC dosage was adjusted by physician's decision based on the results of TAC trough levels to maintain target TAC trough levels ranged from 4–10 ng/mL. TAC trough targets were determined by the immunologic risks of KTRs. Mycophenolate mofetil was administered daily at a fixed dose of 1.0–1.5 g at the time of KT and adjusted according to the immunologic risks, symptoms, and laboratory findings. Corticosteroid treatment included 500 mg intravenous methylprednisolone at the time of surgery and was tapered to 5 mg/day oral prednisolone after 6 months.
Patients grouping according to TAC trough levels and immunologic risk
Post-transplant time points were divided into 0–2, 3–6, and 7–12 months after KT. Low-level (LL) and standard-level (SL) TAC groups were defined based on TAC trough level at each period as 4–7 and 7–12 ng/mL for 0–2 months, 3–6 and 6–10 ng/mL for 3–6 months, and 2–5 and 5–8 ng/mL for 7–12 months, respectively. Patients were classified according to annual variation of TAC trough levels at each of the 3 time periods and were divided into a persistent LL-TAC group or persistent SL-TAC group. Patients with TAC trough levels of 4–7 ng/mL for 0–2 months, 3–6 ng/mL for 3–6 months, and 2–5 ng/mL for 7–12 months were a persistent LL-TAC group. Patients with TAC trough levels of 7–12 ng/mL for 0–2 months, 6–10 ng/mL for 3–6 months, and 5–8 ng/mL for 7–12 months were a persistent SL-TAC group. The coefficient of variation (CV, %) was defined as standard deviation/mean TAC trough level at each period × 100 to determine within-patient variability in TAC trough levels.16
Patients were defined as being at high-risk if they had one or more of the following characteristics: ABO-incompatible KT, re-transplantation, positive flow cytometry crossmatch, pre-transplant panel-reactive antibody (PRA) ≥ 10%, presence of donor-specific antibody (DSA), number of human leukocyte antigen (HLA) mismatch ≥ 4, or delayed graft function (DGF). Patients without any of these characteristics were considered to be at low-risk.
Transplant outcomes
We compared estimated glomerular filtration rate (eGFR), the incidence of BPAR, the development of dnDSA, CNI toxicity, opportunistic infections such as CMV infection and BK virus infection, and renal allograft survival between the two groups, based on TAC trough levels at different post-transplant periods. The eGFR and TAC trough levels were measured in the peripheral blood weekly during the first month and then every month thereafter until 1 year. TAC trough levels at 0–2, 3–6, and 7–12 months were determined as a mean TAC trough level during each period. TAC trough levels before BPAR were obtained. The Modification of the Diet in Renal Disease equation was used to calculate eGFR. Better renal allograft function at 7–12 months was defined as higher eGFR than the median eGFR.
BPAR and CNI toxicity were confirmed based on indications from renal allograft biopsies. DSA were determined by Luminex assays and DSA with mean florescence intensity > 500 were defined as positive. CMV infection was defined as a presence of significant positive pp65 CMV antigenemia, or CMV polymerase chain reaction or diagnosed CMV disease. BK virus infection was defined as an occurrence of BK viremia (≥ 104 copies/mL) or BK viruria (≥ 107 copies/mL), or diagnosed biopsy-proven BK virus nephropathy. We also compared the incidence of BPAR and the development of dnDSA between the high- and low-risk groups.
Statistical analysis
Continuous variables are expressed as mean ± standard deviation (SD) for normally distributed data and as the median with range when the values were not normally distributed. Differences between the groups were tested by independent sample t-tests and χ2 tests as appropriate. Survival rate during follow-up was analyzed by the Kaplan-Meier method. Multivariate logistic regression analysis was used to investigate associated factors with better renal allograft function at 7–12 months. Statistical analysis was performed using the SPSS version 21.0 (SPSS, Chicago, IL, USA). P values < 0.05 were considered statistically significant.
RESULTS
Patient flow chart
A patient flow chart is shown in Fig. 1. A total of 293 patients underwent KT during the study period. We excluded 9 patients who did not receive TAC, 5 patients younger than 19 years of age, and 1 patient who received post-transplant nephrectomy. Among the 278 KTRs ultimately included in this study, 2 patients experienced BPAR during the first 2 months after KT. During the period of 3–6 months post-transplantation, 276 KTRs without previous BPAR were included. Of the 276 patients, 6 patients experienced BPAR and 1 patient died during the 3–6 months period. After excluding patients with BPAR, death, or short-term follow-up period, 223 KTRs were analyzed during 7–12 months period post-transplantation.
 | Fig. 1Flow diagram of the included patients according to each post-transplantation period. A total of 278 KTRs aged between 19 and 70 years who received tacrolimus-based immunosuppressant regimen were initially enrolled. Patients experiencing BPAR were excluded in the next post-transplantation period. The number of included KTRs in 0–2, 3–6, and 7–12 months post-transplantation were 278, 276, and 223, respectively.KTR = kidney transplant recipient, BPAR = biopsy-proven acute rejection.
|
Baseline characteristics and transplant outcomes according to TAC trough levels at each post-transplant period
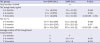
Table 1 shows the patients' baseline characteristics and transplant outcomes according to TAC trough levels at each post-transplantation period. The two groups, according to TAC trough levels at each time period, showed no significant differences in age; sex (except in the 3–6 months' period); causes of end-stage kidney disease; KT types; immunologic characteristics including the presence of DSA; positivity of flow cytometry crossmatch; number of HLA mismatch, cold ischemic time, DGF or induction therapy; or the doses of mycophenolate mofetil and prednisolone.
Table 1
Baseline characteristics and transplant outcomes in kidney transplant recipients according to post-transplantation period and TAC trough level

Values are shown as mean ± standard deviation.
BMI = body mass index, KT = kidney transplantation, PRA = panel-reactive antibody, DSA = donor specific antibody, HLA = human leukocyte antigen, DGF = delayed graft function, IL = interleukin, MMF = mycophenolate mofetil, TAC = tacrolimus, CV = coefficient of variation, eGFR = estimated glomerular filtration rate, BPAR = biopsy-proven acute rejection.
![]()
Mean TAC trough levels in the LL-TAC and SL-TAC groups were 5.8 ± 0.9 and 8.5 ± 1.3 at 0–2 months, 4.8 ± 0.9 and 7.5 ± 1.2 at 3–6 months, and 4.0 ± 0.8 and 6.5 ± 1.3 at 7–12 months, respectively, with significant differences between the groups. There were no significant differences in mean TAC CV at each period between the LL-TAC and SL-TAC groups.
The mean eGFR at 0–2 months of the SL-TAC group (n = 130) was significantly higher than that of the LL-TAC group (n = 148) (72.1 ± 20.3 vs. 64.2 ± 22.7 mL/min/1.73m2; P = 0.003). The SL-TAC group (n = 147) showed a significantly lower incidence of BPAR at 7–12 months than did the LL-TAC group (n = 76) (0.0 vs. 3.9%; P = 0.039). However, during a mean follow up of 31.0 ± 16.5 months, renal allograft survival was not significantly different between patients with SL-TAC and LL-TAC during the 7–12 months' period (Fig. 2A). There were no significant differences in eGFR and incidence of BPAR between the LL-TAC (n = 147) and SL-TAC groups (n = 129) at 3–6 months. At all time periods, no significant differences in the development of dnDSA at 1 year post-transplantation were observed between the SL-TAC and LL-TAC groups.
 | Fig. 2Renal allograft survival between patients with SL-TAC and LL-TAC at 7–12 months (A), and patients with persistent LL-TAC and persistent SL-TAC (B). There were no significant differences in death-censored renal allograft survival between patients with SL-TAC and LL-TAC at 7–12 months period (P = 0.548), nor in KTRs with persistent LL-TAC and persistent SL-TAC (P = 0.750).SL = standard-level, LL = low-level, TAC = tacrolimus, KTR = kidney transplant recipient.
|
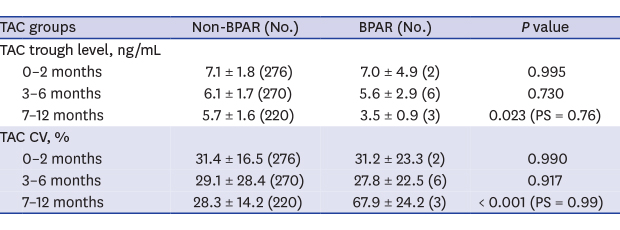
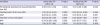
A comparison of TAC trough levels and the average number of TAC trough level measurement at each post-transplantation period between the BPAR and non-BPAR groups are shown in Table 2. Patients with BPAR at 7–12 months post-transplantation (n = 3) had significantly lower TAC trough levels (3.5 ± 0.9 vs. 5.7 ± 1.6 ng/mL; P = 0.023) and higher TAC CV (67.9 ± 24.2 vs. 28.3 ± 14.2 ng/mL; P < 0.001) than patients without BPAR (n = 220). No significant differences in TAC trough levels and TAC CV were observed in the BPAR and non-BPAR groups at 0–2 months and 3–6 months.
Table 2
Comparison of TAC trough levels between BPAR and non-BPAR groups
Values are shown as mean ± standard deviation.
BPAR = biopsy-proven acute rejection, TAC = tacrolimus, CV = coefficient of variation, PS = power statistic.
![]()
Incidence of BPAR according to immunologic risk
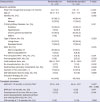
When KTRs were classified according to immunologic risk, 1.4% of KTRs with high risk (n = 70) and 4.8% of KTRs with low risk (n = 208) experienced BPAR. However, there were no significant differences of BPAR occurrence between the two groups (Table 3). Induction treatment with antithymocyte globulin was more frequently used in KTRs with high risk than low risk (5.7% vs. 0.5%; P = 0.015). TAC trough levels at 0–2 months was higher in patients with low risk than high risk (7.2 ± 1.8 vs. 6.7 ± 1.7 ng/mL; P = 0.026). There were no significant differences in TAC trough levels and TAC CV at 3–12 months between high risk and low risk groups.
Table 3
Comparison of the incidence of BPAR between high- and low-risk groups
Values are shown as mean ± standard deviation.
BPAR = biopsy-proven acute rejection, ATG = antithymocyte globulin, TAC = tacrolimus, CV = coefficient of variation.
![]()
Baseline characteristics and transplant outcomes according to annual variation of TAC trough levels
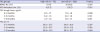
No significant differences in clinical, donor-recipient information, and immunologic characteristics were observed between the persistent LL-TAC (n = 40) and persistent SL-TAC groups (n = 56) (Table 4). The mean TAC trough levels during 0–12 months were 4.6 ± 0.5 and 7.8 ± 1.1 in the persistent LL-TAC and persistent SL-TAC groups (P < 0.001). The SL-TAC group during the entire 12 months revealed significantly higher eGFR at 7–12 months than did the persistent LL-TAC group (65.5 ± 13.0 vs. 57.9 ± 13.9 mL/min/1.73m2; P = 0.007). However, incidence of BPAR and CNI toxicity at 7–12 months (Table 4) and renal allograft survival (Fig. 2B) between the two groups were not significantly different. Patients with persistent SL-TAC showed a trend for a decreased risk of dnDSA at 1 year post-transplantation that did not reach significance (P = 0.074).
Table 4
Baseline characteristics and transplant outcomes in kidney transplant recipients according to annual variation of TAC trough level
Values are shown as mean ± standard deviation.
TAC = tacrolimus, KT = kidney transplantation, PRA = panel-reactive antibody, DSA = donor specific antibody, HLA = human leukocyte antigen, DGF = delayed graft function, IL = interleukin, eGFR = estimated glomerular filtration rate, PS = power statistic, BPAR = biopsy-proven acute rejection, CNI = calcineurin inhibitor.
![]()
Table 5 shows associated factors with better renal allograft function at 7–12 months. The multivariate analysis revealed that persistent SL-TAC were independently associated with better renal allograft function at 7–12 months (odd ratio, 2.53; 95% confidence interval, 1.02–6.26; P = 0.044).
Table 5
Univariate and multivariate logistic regression analysis for better renal allograft function at 7–12 months
OR = odds ratio, CI = confidence interval, TAC = tacrolimus, DSA = donor specific antibody, DGF = delayed graft function, HLA = human leukocyte antigen, BMI = body mass index.
![]()
Other adverse events
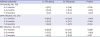
During follow up, no significant differences were observed in the incidence of CNI toxicity, BK infection, and CMV infection between the LL-TAC and SL-TAC groups (Table 6). CNI toxicity in the LL-TAC and SL-TAC groups were 2.7% and 3.8% at 0–2 months, 2.0% and 2.3% at 3–6 months, and 1.2% and 1.4% at 7–12 months, respectively. CMV infection in the LL-TAC and SL-TAC groups were 9.5% and 9.2% at 0–2 months, 5.4% and 3.1% at 3–6 months, and 3.9% and 0.7% at 7–12 months, respectively. BKV infection in LL-TAC and SL-TAC group were 8.8% and 7.7% at 0–2 months, 7.5% and 7.8% at 3–6 months, and 5.3% and 2.0% at 7–12 months, respectively.
Table 6
Comparison of CNI toxicity, CMV infection, and BKV infection between LL- and SL-TAC groups according to post-transplantation period
CNI = calcineurin inhibitor, CMV = cytomegalovirus, BKV = BK virus, LL = low-level, SL = standard-level, TAC = tacrolimus.
![]()
DISCUSSION
This study investigated in detail the association between TAC trough levels at 3 different time points within 1 year of transplantation, and considered transplant outcomes, including renal allograft function and survival, BPAR, the development of dnDSA, and drug toxicity-related adverse events. Post-transplant periods were divided into intervals of 0–2, 3–6, and 7–12 months to reflect the time points that actual post-transplant immunosuppressant dosing alterations take place at transplant centers. An approximately lower than 5 ng/mL of TAC trough level at 7–12 months and high within-patient variability during 7–12 months were significantly associated with increased BPAR occurrence in KTRs. However, proper TAC concentration during post-transplant at 7–12 months did not result in increased drug toxicity, including CNI toxicity, CMV, and BK infection. Furthermore, KTRs with persistent SL-TAC during the entire 1 year after KT showed significantly better renal allograft function at 7–12 months and a trend for decreased dnDSA than KTRs with persistent LL-TAC.
It is an important task for clinicians to maintain optimal TAC trough levels to prevent both acute rejection and drug toxicity. Previous research on the TAC concentration-effect relationship has tried to drive optimal TAC concentration targets according to post-transplantation time points. In our study, the relationship between TAC concentration and BPAR occurrence in the KTRs were different according to post-transplantation time period. Until six months after KT, there were no significant differences in BPAR occurrence between the LL-TAC and SL-TAC groups nor were there any differences in TAC trough levels between KTRs with BPAR and KTRs without BPAR. This result is in concordance with the results reported by Bouamar et al.9 and Rehman et al.17 A combined analysis of 3 large randomized-controlled trials involving a total of 1,304 KTRs found no association between TAC trough levels within 6 months after KT and BPAR occurrence during the first year post-transplantation.9 A retrospective study of 816 KTRs also demonstrated that higher TAC trough levels in first 2 weeks after KT were not related to the prevention of acute rejection.17 Contrary to our results, Staatz et al.10 argued that TAC levels greater than 10 ng/mL should be achieved in the first month after transplantation, while Israni et al.12 suggested use of 8–15 ng/mL of TAC trough level within 0–3 months after transplantation to minimize acute rejection, both of which are higher trough levels than our TAC concentration. Especially, Richards et al.18 proposed that moderately sensitized KTRs, defined as positive DSA, should maintain 8 ng/mL or more of TAC trough levels at discharge. In our study, as long as 5–10 ng/mL of TAC concentration during the first 2 months was maintained, no significant differences in the incidence of BPAR between the SL-TAC and LL-TAC groups were observed. Differences in optimal TAC cutoff levels during the early post-transplant period across the studies might depend on differences in immunologic risks, such as the proportion of deceased donors or induction therapy.
There is no consensus on the optimal TAC levels between 6 months and 1 year after KT. In our study, the maintenance of proper TAC trough level after 6 months significantly reduced the incidence of BPAR without any increased adverse events. A prospective multicenter randomized-control trial of 1,645 KTRs demonstrated that patients with low-dose CNI (TAC) within 1 year following transplantation showed a significantly lower acute rejection and better renal allograft function than patients with standard-dose CNI (cyclosporine).7 Although the results of the Efficacy Limiting Toxicity Elimination (ELITE)-Symphony study seemed to superficially conflict with those of the present study, considering that the target of low-dose TAC concentration in the ELITE-Symphony Study was 3–7 ng/mL and the actual maintenance concentration of TAC was 6–7 ng/mL during 1 year after transplantation, the results of ELITE-Symphony study were similar to those of our study, in that maintaining TAC trough levels above 5 ng/mL after KT yielded a better renal outcome. Interestingly, the result of a study on 528 KTRs that found that TAC trough levels less than 4.0 ng/mL are better avoided during the first year after KT to prevent acute rejection was consistent with the results of our study.13 A retrospective study of 198 KTRs also demonstrated that 8 ng/mL or above of TAC trough levels should be maintained after 6 months post-transplantation to prevent acute rejection.14 However, in our study, the incidence of BPAR was kept low enough by maintaining around 6 ng/mL of TAC trough level after 6 months post-transplantation. Overall BPAR rate during the period of 1 year in our study was 3.96% and was considerably lower than that reported in other studies. One study including a higher proportion of deceased donor KT13 showed 10.2% of overall BPAR rate during 1 year, and another study found that one-third of KTRs who received early steroid withdrawal12 reported 7.8% of overall BPAR rate within 6 months. Differences in the characteristics of study populations and immunosuppressant protocols might be related to differences in the incidence of BPAR. Apart from TAC trough level itself, high intra-patient variability in TAC trough levels has been associated with worse renal allograft outcomes, including acute rejection or allograft loss.161920 Our study also showed that high intra-patient fluctuations in TAC trough levels after 6 months were significantly related to acute rejection and confirmed the results of previous studies. Therefore, transplant physicians should pay attention to keep stable TAC trough levels as well proper TAC trough levels after KT.
BPAR occurrence could be affected not only by immunosuppressant concentration, but also by immunologic characteristics such as type of KT,21 presence of DSA,2223 number of HLA mismatch,24 and DGF.25 A study reported by Bouamar et al.9 classified KTRs as high-risk if they had one or more of the following characteristics: DGF, second or third KT, PRA of more than 15%, four or more HLA mismatches, or were of African descent. The study revealed that the risk of BPAR was significantly higher in a high-risk group than in a low-risk group even though there was no difference in TAC concentration between the two groups.9 The current study also analyzed the risk of BPAR according to immunologic risk. Interestingly, in our study, no significant difference in BPAR occurrence was observed between the high-risk and low-risk groups even though TAC trough levels at 0–2 months were higher in patients with low risk than high risk. This result might be affected by induction therapy with antithymocyte globulin which was more frequently used in KTRs with high risk than low risk.
Previous studies have demonstrated that the development of dnDSA is associated with antibody-mediated rejection and poor long-term renal allograft survival.262728 Therefore, in a long-term perspective, reducing detrimental effect on renal allograft survival by maintaining adequate immunosuppression and preventing the development of dnDSA is as important as reducing drug toxicities. Previous study has shown that KTRs who developed dnDSA had a greater percentage of TAC trough levels of 5 ng/mL or less.29 In this study, KTRs with persistent proper TAC levels during the entire 1 year post-transplantation showed a trend for a decreased incidence of dnDSA development, although the difference did not reach statistical significance. Although reducing the dose of TAC has been considered beneficial for renal allograft function, in our study, KTRs with persistent SL-TAC had better renal allograft function even after adjusting several factors. The mean TAC trough level in persistent SL-TAC group was not high enough to cause nephrotoxicity which leads to deterioration of renal allograft function. Furthermore, incidence CNI toxicity at 7–12 months between the two groups was not significantly different. Therefore, we have confirmed that there is no reason why the renal allograft functions of persistent SL-TAC groups are at least decreased.
Our study has some limitations. First, this is a retrospective single center study. To confirm our results, further prospective multicenter randomized-controlled trials are needed. Second, other drug-related adverse events such as gastrointestinal disorder, hypertension, and post-transplant diabetes mellitus were not reviewed. Third, since physician's strategies to determine drug dosage can vary in terms of immunologic risks and clinical situation of KTRs and can be reflected in TAC trough levels, the results of our study cannot be completely free from the effects of physician's strategies and clinical circumstances of KTRs under the retrospective study design. However, we identified the baseline and immunologic characteristics between LL-TAC and SL-TAC groups and found that there were no differences between two groups. Furthermore, when we analyzed the risk of BPAR according to immunologic risk, there was no significant difference in BPAR occurrence between the high-risk and low-risk groups. In our opinion, we were able to minimize the outcome bias because the immunologic characteristics between LL-TAC and SL-TAC groups that could affect TAC trough levels were identified. Nevertheless, the strength of this study is that we analyzed transplant outcomes according to 3 critical time periods that mimicked individualized dose adjustments of immunosuppressant performed in real clinical practice. Moreover, the effects of annual variation of TAC trough level on eGFR, BPAR occurrence, and the development of dnDSA were identified, and we concluded that persistent SL-TAC was crucial to maintain better renal allograft function and reduce the tendency of the development of dnDSA. The results of our study could be applied easily and usefully to actual KTR care. We can treat KTRs with standard immunological risk with standard TAC concentration, according to the range described earlier for the first 6 months after KT and with TAC concentration at 5 ng/mL or more after 6 months. This management protocol could reduce the risk of BPAR without adverse infectious events and help preserve superior renal allograft function in incident KTRs.
In conclusion, the maintenance of SL-TAC and lower variability during 7–12 months after KT was associated with a lower BPAR occurrence and better renal graft function in KTRs receiving a TAC-based immunosuppressant regimen. Furthermore, although there was no significant benefit for renal allograft survival, maintenance of persistent SL-TAC during the entire first year after KT resulted in better renal allograft function and a trend for decreased dnDSA. We argue that proper TAC trough level during the first year after KT, especially after 6 months, drives best transplant outcomes in KTRs.
 XML Download