

 PDF
PDF Citation
 Print
Print


INTRODUCTION
The MDR1 (also known as ABCB1) gene encodes P-glycoprotein, an ATP-binding cassette (ABC) transporter, which acts as an energy-dependent efflux pump in plasma membranes.1 Overexpression of P-glycoprotein reduces intracellular concentrations of cytotoxic anti-cancer drugs in cancer cells and leads to multidrug resistant phenotype.23 Thus, MDR1 expression is an important factor that impedes the therapeutic outcome of cancer chemotherapies. Increased MDR1 expression is associated with poor prognosis after chemotherapy in many cancers, including leukemia, neuroblastoma, and breast cancer.456 However, it is not fully understood how MDR1 expression is mediated in cancers.
Many studies have suggested that the mechanism regulating the transcription of MDR1 gene is complex.78910 MDR1 gene expression is controlled under upstream and downstream promoters.101112 The downstream promoter regulates MDR1 expression in various cancer cells and normal tissues and has regulatory elements for several transcription factors, such as Sp1, NF-Y, Egr1, and HSF1, which are involved in transcriptional activation of MDR1 gene.13141516 The upstream promoter (USP) was originally found in drug-resistant human cervical carcinoma KB cell lines,1011 and has been reported to drive MDR1 expression in mononuclear cells from patients with acute lymphoblastic leukemia.17 Furthermore, the MDR1 transcript of the USP has been detected in a high proportion of primary breast cancers and shown to be associated with lymph node metastasis.18 A previous study showed that the USP was activated by the IL6/NF-IL6 pathway.19 However, little is known about molecular mechanisms responsible for transactivation of the MDR1 gene under the USP. In this study, we show Nkx-2.5 positively regulates MDR1 USP activity in breast cancer cells, and that it binds directly to a binding site in nt +4 to +10 of MDR1 USP, and thus, upregulated the expression of the MDR1 mRNA.
METHODS
Cell culture
MCF7 and MDA-MB-231 cells (human breast cancer cell lines) and 4T1-luc cells (a mouse breast cancer cell line) were grown in RPMI-1640 medium supplemented with 10% (v/v) fetal bovine serum (FBS, Thermo Fisher Scientific, Waltham, MA, USA), 100 units/mL penicillin, and 100 μg/mL streptomycin. A MCF7 cell line overexpressing Nkx-2.5 was generated by transducing cells with retrovirus encoding human Nkx-2.5 (MCF7/Nkx-2.5). The expression of Nkx-2.5 protein was verified by immunoblotting with anti-FLAG antibody (Sigma, St. Louis, MI, USA; clone M2, 1:10,000).
Plasmid construction
A DNA fragment corresponding to the human MDR1 USP region (nucleotide [nt] −1391 to +163) was generated by polymerase chain reaction (PCR) using genomic DNA extracted from MCF7 cells and the primers detailed in Table 1. PCR products were digested with the restriction enzymes Asp718I and XhoI and then cloned into the Asp718I-XhoI restriction sites of pGL3/basic vector (Promega) and designated pMDR1-U (−1391). Generation of 5′ deleted MDR1 USPs was achieved by PCR using the same reverse primer used to amplify pMDR-U (−1391) and the forward primers detailed in Table 1. PCR products were then subcloned into the Asp718I-XhoI restriction sites of pGL3/basic vector. Mutation of the Nkx-2.5-binding site at nt +4 to +10 of the MDR1 USP was performed using the QuickChange II site-directed mutagenesis kit (Agilent Technologies, Santa Clara, CA, USA) with the primers detailed in Table 1. All constructs were verified by DNA sequencing (Bionics, Seoul, Korea). The expression vector for Nkx-2.5 (pCMV-SPORT6-Nkx-2.5) was purchased from Korea Human Gene Bank (KHGB). To generate a retroviral vector for Nkx-2.5-FLAG, the coding sequence of Nkx-2.5 was amplified from pCMV-SPORT6-Nkx-2.5 vector by PCR using the primers detailed in Table 1, digested with EcoRI and XhoI, and then cloned into pcDNA3.1 vector with FLAG tag and designated pcDNA-Nkx-2.5-FLAG. The DNA fragment encoding Nkx-2.5-FLAG was then amplified from pcDNA-Nkx-2.5-FLAG vector by PCR, digested with EcoRI and NotI, and subcloned into pMXs-IRES-puro retroviral vector (Cell BioLab, San Diego, CA, USA).
Table 1
DNA sequences of the oligonucleotides used in this study
![]()
Reporter gene assays
MCF7 cells were seeded in 12-well plates at 5 × 10⁴ cells per well. The next day cells were cotransfected with pMDR1-U or pGL3/basic vector and Nkx-2.5 expression vector with pRL-SV40 (to achieve the constitutive expression of Renilla luciferase as an internal control) using Lipofectamine 2000 (Thermo Fisher Scientific), according to the manufacturer's instructions. Forty-eight hours after transfection, cells were washed with PBS and lysed in 200 μL of passive lysis buffer (Promega, Madison, WI, USA). Firefly and Renilla luciferase activities were measured using a luminometer (Takara Bio, Kusatsu, Japan) and a Dual Luciferase assay kit (Promega). The ratio of firefly luciferase activity to Renilla luciferase activity was defined as relative luciferase activity. At least three independent experiments were performed.
Quantitative real-time PCR
Total RNA was purified from MCF7 cells using the RNeasy mini kit (Qiagen, Hilden, Germany). cDNA synthesis was performed using M-MLV reverse transcriptase (Promega). The cDNA obtained was diluted 5-fold and used to amplify the Nkx-2.5 or MDR1 transcript from its USP using SYBR green master mix (Roche Applied Science, Penzberg, Germany) in a LightCycler 480 (Roche Applied Science). β-actin was used as an internal control. Real-time PCR amplification was performed using the following conditions: initial denaturation at 95°C for 5 minutes; 45 cycles of amplification (denaturation at 95°C for 30 seconds, annealing at 58°C for 30 seconds, and extension at 72°C for 30 seconds); 1 cycle of melting curves at 95°C for 5 seconds and 65°C for 1 minute; and a final cooling step at 40°C for 30 seconds. Relative expression of Nkx-2.5 or MDR1 mRNA was analyzed using the comparative cycle threshold (CT) method as previously described.20 The primers used for real-time PCR are detailed in Table 1.
Promoter enzyme immunoassay
A promoter enzyme immunoassay was performed as described previously.21 Briefly, biotinylated oligonucleotide probes (5 pmol per well) for wild type or mutated Nkx-2.5-binding site were generated by annealing sense and antisense oligonucleotides and immobilized in streptavidin-coated 96-well plates (Thermo Fisher Scientific) by incubation for 1 hour at room temperature. After washing three times with washing buffer (10 mM HEPES, pH 7.9, 100 mM KCl, 5 mM MgCl2, 1 mM 1,4-dithiothreitol, 10% glycerol, and 0.5% Nonidet P-40), plates were incubated with nuclear extract (20 µg per well) of MCF7 cells transfected with the plasmid encoding Nkx-2.5 at 4°C for 2 hours in the presence of poly-deoxyinosinic-deoxycytidylic acid (poly-dI/dC; 5 μg per well). Plates were then washed with wash buffer, incubated with anti-Nkx-2.5 antibody (Santa Cruz Biotechnology, 1:1,000) at 4°C for 2 hours, and with HRP-conjugated secondary antibody (Santa Cruz Biotechnology, Dallas, TX, USA; 1:2,000) at 4°C for 2 hours. After washing three times with wash buffer, the substrate reagent (R&D Systems, Minneapolis, MN, USA) was added and plates were incubated for 1 hour at 4°C. The colorimetric reaction was stopped by adding 2N H2SO4, and absorbance at 450 nm was then measured using a microplate reader (BioRad, Hercules, CA, USA).
Chromatin immunoprecipitation (ChIP) assays
ChIP assays were carried out using the Upstate Biotechnology ChIP assay kit as previously described.22 Briefly, chemically cross-linked MCF7 cells were sonicated to yield DNA fragments ranging in size from 200 to 800 base pairs. After centrifugation for 10 minutes at 12,000 rpm, supernatants were recovered, diluted 10-fold into ChIP dilution buffer, and then incubated with 100 μl of 50% protein G-agarose slurry for 30 minutes at 4°C to reduce non-specific interactions between chromatin DNA and protein G-agarose beads. After centrifugation for 5 minutes at 3,000 rpm, supernatants were incubated with 2 μg of anti-Nkx-2.5 antibody (Santa Cruz Biotechnology) or control IgG for 2 hours at 4°C. Immune complexes were then immunoprecipitated by incubation with protein G-agarose beads for 1 hour, and then eluted from the protein G-agarose beads using elution buffer (1% SDS, 0.1 M NaHCO3). Cross-links were then broken by incubation for 4 hours at 65°C, and DNA was isolated using a PCR purification kit (Qiagen) and used as templates for PCR reactions using primers for MDR1 USPs. Primer sequences are detailed in Table 1.
Nkx-2.5 knockdown
Target sequences for Nkx-2.5 knockdown were analyzed from the human NKX2-5 gene (GenBank accession no. NM_004387) using an online siRNA design tool (http://dharmacon.horizondicovery.com/design-center/). Forward and reverse oligonucleotides for target sequences (siRNA-1, 5′-CAG UCA AAG ACA UCC UAA ACC′; siRNA-2, 5′-ACC CUA GAG CCG AAA AGA AAG-3′) were synthesized and annealed (Bioneer). MDA-MB-231 cells were transfected with Nkx-2.5 siRNA using Lipofectamine 2000, in accordance with the manufacturer's instructions (Thermo Fisher Scientific). Stealth RNAi negative control (Thermo Fisher Scientific) was used as a control siRNA. The levels of Nkx-2.5 and MDR1 mRNA were analyzed by real-time PCR using primers detailed in Table 1.
Statistical analysis
Significances of differences were determined using SPSS (version 23.0; SPSS Inc., Chicago, IL, USA). Comparisons of two groups were performed using the unpaired Student's t-test and comparisons of ≥ 3 groups using one-way ANOVA with Tukey's post-hoc test. Statistical significance was accepted for P values < 0.05. Results are presented as mean ± standard deviations. P values are indicated by asterisks as follows: *P < 0.05, **P < 0.01, and ***P < 0.001.
RESULTS
Transactivation of the human MDR1 USP by Nkx-2.5
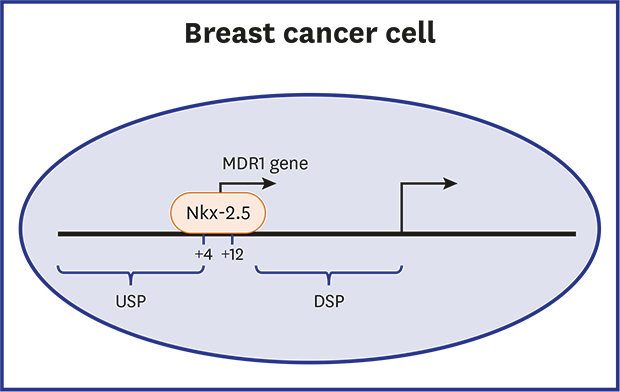
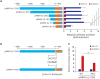
As shown in Fig. 1A, expression of the human MDR1 gene is regulated by upstream and downstream promoters. To determine the regions responsible for the transcriptional activation of MDR1 USP, we generated reporter gene constructs for the promoter and its 5′ deletion mutants and examined their activities in MCF7 cells using a reporter gene assay. Sequential deletion from −1391 to −71 exhibited promoter activity comparable with that of pMDR1-U (−1391), whereas deletion from −71 to +13 caused a marked decrease in USP activity (Fig. 1B). We then assessed potential binding sites for transcription factors in the 83 nucleotides upstream of pMDR1-U (+13) using the TFBIND program (http://tfbind.hgc.jp) and found potential binding sites for Sp1, AML1, GATA2, Nkx-2.5, and HNF3β (Fig. 2A). Thus, we assessed whether these transcription factors regulate MDR1 USP activity in MCF7 cells. Reporter gene assays revealed Nkx-2.5 increased MDR1 USP activity by 9-fold (Fig. 2B). However, transactivation of MDR1 USP was not observed in cells transfected with pGL3/basic empty vector (Fig. 2C). Increasing amounts of transfected Nkx-2.5 dose-dependently increased USP activity of the MDR1 gene (Fig. 2D). Forced expression of Nkx-2.5 increased the expression of the MDR1 mRNA in MCF7 cells (Fig. 2E and F). These results suggest that Nkx-2.5 could mediate transactivation of MDR1 USP in breast cancer cells.
 | Fig. 1Human MDR1 upstream promoter activity in MCF7 breast cancer cells. (A) Schematic diagram for the two transcription initiation sites of the human MDR1 gene. Numbers indicate number of exon in the human MDR1 gene. (B) MCF7 cells were transfected with the pMDR1-U (−1391) or plasmids harboring a series of 5′ deletion mutants of the human MDR1 upstream promoter, and their promoter activities were analyzed using reporter gene assays. Relative luciferase activities were normalized as fold value versus pMDR1-U (−1391). Results are expressed as the means ± SDs. of at least three independent experiments.USP = upstream promoter, DSP = downstream promoter, LUC, luciferase gene.
*P < 0.05, **P < 0.01; as determined by one-way ANOVA with Tukey's post-hoc test.
|
 | Fig. 2Nkx-2.5 increased MDR1 upstream promoter activity in MCF7 cells. (A) Schematic representation of the nt −71 to +13 region of MDR1 upstream promoter. Numbers indicate positions from the transcriptional start site in the human MDR1 upstream promoter. The binding sites of putative transcription factors, which were identified using the TFBIND program (http://tfbind.hgc.jp), are underlined. (B) MCF7 cells were co-transfected with the pMDR1-U construct and the indicated transcription factors or control vector (pcDNA3.1), and reporter gene assays were performed. The relative luciferase activities were expressed as fold value versus the pcDNA3.1 vector. Results are expressed as the means ± SDs of at least three independent experiments. *P < 0.05, **P < 0.01, ***P < 0.001; as determined using the unpaired Student's t-test. (C) The pMDR1-U (−1391) or pGL3/basic vector was co-transfected with Nkx-2.5 expression vector or pcDNA3.1 vector into MCF7 cells. Relative luciferase activities were normalized as fold values versus pMDR1-U (−1391) in the absence of Nkx-2.5. Results are expressed as the means ± SDs of at least three independent experiments. *P < 0.05; as determined by the unpaired Student's t-test. (D) The pMDR1-U (−1391) construct was co-transfected with the indicated amount of Nkx-2.5 expression vector into MCF7 cells. Relative luciferase activities were normalized as fold values versus pMDR1-U (−1391) in the absence of Nkx-2.5. Results are expressed as the means ± SDs of at least three independent experiments. ***P < 0.001 as determined by one-way ANOVA with Tukey's post-hoc test. (E) MCF7 cells were infected with retrovirus encoding Nkx-2.5-FLAG or retrovirus from pMxs-IRES-puro vector (Control), and Nkx-2.5 expression was examined by immunoblotting using anti-FLAG antibody. (F) Real-time PCR analysis of MDR1 mRNA in MCF7 cells infected with retrovirus encoding Nkx-2.5 or retrovirus from pMXs-IRES-puro vector. Results are expressed as the means ± SDs of at least three independent experiments. **P < 0.01 as determined by the unpaired Student's t-test.
|
The Nkx-2.5-responsive element was located at the nt +4 to +10 region of the MDR1 USP
Sequence analysis of the MDR1 promoter region (−1391/+163) revealed that there are 23 potential Nkx-2.5-binding sites in the human MDR1 USP (Supplementary Fig. 1). To determine whether Nkx-2.5 increases MDR1 USP activity in MCF7 cells by interacting with an Nkx-2.5-binding motif in the nt −71 to +13 region, we transduced MCF7 cells with a plasmid encoding Nkx-2.5 to evaluate the activities of 5′ deleted forms of human MDR1 USP. Deletion from −71 to +13 substantially reduced Nkx-2.5-mediated activation of MDR1 USP (Fig. 3A), indicating that the Nkx-2.5-responsive element was in the nt −71 to +13 region. Sequence analysis revealed a possible Nkx-2.5 binding site in the nt +4 to +10 region of the USP (Fig. 2A and Supplementary Fig. 1). To determine whether this Nkx-2.5-binding site plays a critical role in MDR1 transactivation, we generated a construct for MDR1 USP with mutations in the Nkx-2.5-binding motif (CACTTGT) in which conserved ‘TTG’ was exchanged with ‘AAA’ (Fig. 3B). The promoter with this mutated Nkx-2.5-responsive motif exhibited a significant decrease in the Nkx-2.5-mediated transactivation of the MDR1 gene (Fig. 3C), indicating that the Nkx-2.5-binding site at nt +4 to +10 plays a pivotal role in Nkx-2.5-mediated MDR1 expression under the USP.
 | Fig. 3Identification of the Nkx-2.5-binding site in MDR1 upstream promoter. (A) pMDR1-U (−1391) and plasmids harboring a series of 5′ deletion mutants of human MDR1 upstream promoter were co-transfected with Nkx-2.5 expression vector or control vector (pcDNA3.1) into MCF7 cells. Relative luciferase activities were expressed as fold over that of each promoter in the presence of pcDNA3.1 vector. Results are expressed as the means ± SDs of at least three independent experiments. *P < 0.05, **P < 0.01; as determined by one-way ANOVA with Tukey's post-hoc test. (B) Schematic representation of pMDR1-U (−1391/+136) with mutations in the Nkx-2.5-binding site. (C) pMDR1-U (−1391) or a mutated MDR1 upstream promoter construct were co-transfected with plasmid encoding Nkx-2.5 or control vector (pcDNA3.1) into MCF7 cells. Relative luciferase activities were expressed as fold over that of each promoter in the presence of pcDNA3.1 vector. Results are expressed as the means ± SDs of at least three independent experiments. **P < 0.01; as determined by the unpaired Student's t-test.
|
Nkx-2.5 bound to the Nkx-2.5-responsive element in human MDR1 USP
To assess whether Nkx-2.5 binds directly to the +4 to +10 region of the USP, we generated an oligonucleotide probe containing the putative Nkx-2.5-binding site at nt +4 to +10 of the promoter (Fig. 4A). Probes were biotinylated and immobilized to streptavidin-coated 96-well microplates and incubated with nuclear extracts from MCF7 cells transfected with a plasmid encoding Nkx-2.5. The probe harboring the Nkx2.5-binding site was observed to bind significantly to Nkx-2.5 protein in nuclear extract, as determined by colorimetric analysis using an anti-Nkx-2.5 antibody (Fig. 4B). Furthermore, Nkx-2.5 binding to the Nkx-2.5-responsive element was specific because binding of Nkx-2.5 protein to the mutated probe was remarkably reduced (Fig. 4B), indicating Nkx-2.5 binds directly to its binding site at nt +4 to +10 of MDR1 USP. To further confirm binding of Nkx-2.5 to the Nkx-2.5-responsive element at nt +4 to +10, we performed ChIP assays in MCF7 cells. The DNA-Nkx-2.5 complexes were precipitated using an anti-Nkx-2.5 antibody or isotype-matched IgG, and then the precipitated DNA was subjected to PCR amplification using primers encompassing the Nkx-2.5-binding element at nt +4 to +10. The sequence containing this element was amplified from DNA precipitated with an Nkx-2.5 antibody, but not isotype-control antibody (Fig. 4C, upper panel). No band was observed when PCR was performed using primers for the region between −1062 and −1221 of the MDR1 USP (Fig. 4C, lower panel). Taken together, these results demonstrate Nkx-2.5 specifically binds to Nkx-2.5-responsive element in the human MDR1 USP in MCF7 cells.
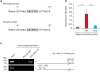 | Fig. 4Nkx-2.5 directly bound to the Nkx-2.5-binding site at nt +4 to +10 region of human MDR1 upstream promoter. (A) Schematic representation of biotinylated probes used in promoter enzyme immunoassay. (B) Streptavidin-coated microplates were conjugated with biotin-labeled oligonucleotides containing Wt or Mut Nkx-2.5-binding sites and then incubated with nuclear extracts from MCF7 cells transfected with plasmid encoding Nkx-2.5. After incubation for 2 hours, Nkx-2.5-DNA complex formation was analyzed colorimetrically using anti-Nkx-2.5 and HRP-conjugated secondary antibodies. Results are presented as the means ± SDs (n = 3). (C) Soluble chromatin was prepared from MCF7 cells and immunoprecipitated with anti-Nkx-2.5 antibody or an isotype-matched IgG. Immunoprecipitated chromatin was subjected to PCR using primers specific for the Nkx-2.5-responsive element in MDR1 upstream promoter (upper panel). As a negative control, primers for the distal region (nt −1062 to −1221) of MDR1 upstream promoter were used (lower panel).Wt = wild-type, Mut = mutated.
**P < 0.01; as determined by one-way ANOVA with Tukey's post-hoc test.
|
Nkx-2.5 knockdown leads to reduction of MDR1 expression in breast cancer cells
We assessed whether knockdown of endogenous Nkx-2.5 downregulates MDR1 expression in breast cancer cells. First, Nkx-2.5 expression was analyzed in three breast cancer cell lines, MCF7, MDA-MB-231, and 4T1-luc cells; Nkx-2.5 protein was detectable in MDA-MB-231 cells (Fig. 5A). Next, we performed Nkx-2.5 knockdown in MDA-MB-231 cells using transduction of Nkx-2.5-specific siRNAs. Nkx-2.5 mRNA level was decreased to 71% and 30% by two independent siRNAs against Nkx-2.5, respectively (Fig. 5B). Similar to pattern of Nkx-2.5 mRNA, MDR1 mRNA expression was significantly inhibited in Nkx-2.5 siRNA-treated cells, compared with control siRNA-treated cells (Fig. 5C). This result indicates that Nkx-2.5 regulates MDR1 expression in breast cancer cells.
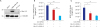 | Fig. 5Nkx-2.5 knockdown leads to reduction in MDR1 expression in breast cancer cells. (A) Nkx-2.5 expression was analyzed in MCF7, MDA-MB-231, and 4T1-luc cells by Western blot. A representative result is shown. (B, C) MDA-MB-231 cells were transfected with Nkx-2.5 siRNAs or control siRNA, and the expressions of Nkx-2.5 (B) and MDR1 mRNA (C) were analyzed by real-time PCR. Results are expressed as the means ± SDs of at least three independent experiments.
*P < 0.05, **P < 0.01, ***P < 0.001; as determined by one-way ANOVA with Tukey's post-hoc test.
|
DISCUSSION
Overexpression of the MDR1 gene can adversely affect the outcomes of cancer chemotherapy, and expression of this gene was controlled by downstream promoter (DSP) and USP. Transcriptional regulation of MDR1 has been extensively explored, though attention has focused on its DSP, and perhaps as a result, the transcription factors responsible for transactivating its USP remain to be identified. The present study shows the homeobox transcription factor Nkx-2.5 regulates the transactivation of MDR1 via its USP in MCF7 breast cancer cells.
Nkx-2.5 is a transcription factor that belongs to the NK2 class of homeobox proteins, which possess a conserved NK2-specific domain.23 Nkx-2.5 is predominantly expressed in heart24 and regulates genes for heart development and cardiomyocyte differentiation.2526 It also expressed in thyroid and mammary gland.2728 Several studies have showed that the expression and activity of Nkx-2.5 was elevated in some cancer cells, including leukemia and breast cancer cells. Nkx-2.5 activation was found to be increased in lymphoblastic leukemia through genetic translocation,2930 and the MDR1 transcript from USP was detected in mononuclear cells from patients with acute lymphoblastic leukemia.17 Thus, it is possible that enhanced Nkx-2.5 activity by oncogenic translocation induce MDR1 transcription via its USP. Nkx-2.5 has also been reported to be expressed in human breast cancer,28 and in the present study we found homeobox transcription factor Nkx-2.5 directly induces transactivation of MDR1 USP in MCF7 breast cancer cells by binding to a site in nt +4 to +10 of MDR1 USP. A previous study showed that transcript from the USP was detectable in a high proportion of primary breast tumors, and its expression was correlated with lymph node metastasis,18 which suggests Nkx-2.5 might regulate MDR1 expression via its USP in advanced breast cancer.
In summary, we found Nkx-2.5 plays a key role in the transcriptional activation of the human MDR1 USP in MCF7 breast cancer cells. In view of the fact that P-glycoprotein encoded by MDR1 gene endows cancer cells with multidrug resistance, we hope the identification of Nkx-2.5 as a transcription factor for MDR1 expression via MDR1 USP will help elucidate the regulatory mechanism responsible for the multidrug resistant cancer phenotype.
 XML Download