

 PDF
PDF Citation
 Print
Print


INTRODUCTION
Salmonellosis is a bacterial disease affecting both humans and animals worldwide [1]. The incidence of this infection is the greatest in children, the elderly, and immunosuppressed individuals [2]. A significant proportion of all cases of human salmonellosis is known to be caused by the consumption of contaminated raw or improperly cooked poultry products (both eggs and meat) [3]. Salmonella enterica ssp. enterica serovar Enteritidis (S. Enteritidis) is responsible for most cases of gastrointestinal infection in the world. In a susceptible host, S. Enteritidis replicates primarily in the mucosa of the digestive tract after oral challenge and then spreads to the spleen, liver, and various organs and tissues [2]. S. Enteritidis infections in poultry are characterized by vascular damage, eruptions at specific locations on the mucosal surface of the gastrointestinal tract, lesions in the lymphoid organs, and degenerative sequelae involving the parenchymatous organs [2]. Prevention of S. Enteritidis infection of broiler chicken is an essential first step in reducing S. Enteritidis outbreaks in humans.
Fluoroquinolones are used in the poultry industry in different countries in a number of ways to overcome S. Enteritidis infection [4]. Enrofloxacin is one of the fluoroquinolone antibiotics used often in veterinary medicine. This is a broad-spectrum antibacterial agent indicated to treat infections of intestinal and respiratory tracts in poultry caused by S. Enteritidis, Avibacterium gallinarum, Escherichia coli, Mycoplasma synoviae, Mycoplasma gallisepticum, and Pasteurella multocida. The development of bacterial resistance against antibiotics is a major threat to both humans and animals; most vital reasons for raising the bacterial resistance are misuse and overuse of antibacterial agents. The improper use or misuse of fluoroquinolone antibacterial agents in the fowl industry has resulted in an alarming incidence of resistance to this class of drugs in commensal and pathogenic bacteria [5]. Optimizing dosage scheduling is crucial to achieve clinical success and minimize the development of antibiotic resistance [6].
Pharmacodynamic (PD) parameters used to establish antimicrobial activity include minimum inhibitory concentration (MIC), minimum bactericidal concentration (MBC), and time-kill curves [7]. In the last few years, the designing of dosage schedules for antibacterial agents has developed markedly by the use of modeling and the integration of pharmacokinetic (PK) and PD data. These approaches have improved strategies for predicting dosages of drugs that minimize occurrences of antibiotic resistance and optimize the efficacy of drugs [8]. There are 3 PK/PD parameters (Cmax/MIC, T > MIC, and AUC24h/MIC) that are most frequently utilized to determine an optimum dosage by means of quantifying and describing the killing effects of antibacterial agents on pathogenic bacteria. The Cmax/MIC is the ratio of the peak concentration of the drug in serum quantified in vivo (Cmax) to the minimum inhibitory concentration (MIC) obtained in vitro; AUC24h/MIC is the ratio of the area under the curve (AUC) over 24 h to the MIC. These are the major predictors of effectiveness of fluoroquinolone antibacterials. The T > MIC parameter is the proportion of the dose-time (T) interval. (stated as a percentage) in which the concentration of drug in serum exceeds the MIC, and it correlates best with the outcome of time-dependent drugs [7].
Although the PKs of enrofloxacin have already been studied in many species, including calves, turkeys, horses, goats, sheep, pigs, and chicken [59101112], there is no such report linking the PK and PD of enrofloxacin in broiler chicken within a single investigation. Thus, the current study was designed to describe the PK profiles of enrofloxacin after the administration of 10 mg/kg of body weight (b.w.) through intravenous (IV) and peroral (PO) routes in broiler chicken and to establish PK/PD indices for determining an optimal dose against S. Enteritidis infections.
MATERIALS AND METHODS
Chemicals, reagents, and media
Enrofloxacin was obtained from Sigma-Aldrich (USA). Mueller-Hinton Broth (MHB) and Mueller-Hinton Agar (MHA) were purchased from Difco Laboratories (USA). HPLC grade acetonitrile and reagent grade formic acid were respectively purchased from Merck Millipore (USA) and Sigma-Aldrich. A Milli-Q water purification system (Millipore, Inc., USA) was utilized to purify water.
Animal experimental procedure
Broiler chickens of both sexes and aged 3–4 weeks were collected from Sunjin CU farm (South Korea). Body weight of each chicken was approximately 1 kg, and they were housed in a self-contained animal unit. Purified water and antibiotic-free commercial diet were freely accessible ad libitum to animals during the exploratory period. The chickens were kept in fasting condition for overnight and were then randomly distributed into three groups (4 in each group). Enrofloxacin (10 mg/kg b.w.) was administered to two of the groups via PO or IV routes for basic PK profile determination. Approval for the animal experiment protocols was obtained from the Institutional Animal Care and Use Committee of the Animal and Plant Quarantine Agency, South Korea (approval No.: 2014-2190).
Collection and processing of blood samples
Three milliliters of blood samples obtained individually from all control and treated chickens were drawn by stabbing either the brachial wing vein or jugular vein and collected in vacutainer heparin tubes (Becton Dickinson and Company, USA) at 5, 10, 15, 30, 45 min, and 1, 2, 3, 4, 5, 6, 9, 12, 18, 24, 30, 36, 42, 48 and 72 h. Plasma samples were obtained by centrifuging the blood samples at 2,000 ×g at 4°C for 10 min. To precipitate plasma proteins, 1.5 mL of 0.1% formic acid in acetonitrile were added to 0.5 mL plasma. The mixtures were shaken for 20 min and then centrifuged for 30 min at 5,000 ×g. To evaporate the supernatant fluid, nitrogen evaporation was performed at 50°C until the volume was reduced to 500 μL, and then the samples were preserved in a −70°C refrigerator.
Liquid chromatography-tandem mass spectrometry (LC-MS/MS) study
A YMC C18 (3.0 × 100) mm column of 3 μm inner porosity was equipped with an LC-MS/MS system (Agilent Technologies, USA) and was employed for determining the amount of enrofloxacin in plasma. The mobile phase was a mixture of (A) 0.1% formic acid in acetonitrile and (B) 0.1% formic acid in distilled water, and a gradient flow was maintained with the flow rate of 0.6 mL/min. The mobile phase was initially let to flow with a 10:90 ratio of 10% “A” and 90% “B”. During 0.1 to 3 min, the ratio of mobile phase solvents was gradually altered to 100:0 of “A” and “B”, and these proportions were maintained until 3.9 min. The proportions were altered to 95% “A” and 5% “B” from 4 to 4.9 min. The proportions of the mobile phase solvents were then reverted to the initial ratio (10% “A” and 90% “B”) at 5 min, and this composition was used until the end of the acquisition. Five microliters of sample were injected at each time. The method was optimized and validated prior to undertaking PK analysis.
Validation of enrofloxacin quantification method
Specificity of the enrofloxacin quantification method was evaluated by injecting enrofloxacin standard solution and enrofloxacin-untreated chicken plasma spiked with known concentrations of enrofloxacin to determine whether the matrix shows any interference at the retention time of enrofloxacin. The enrofloxacin stock solution (1 mg/mL) was prepared by dissolving the compound in 0.1% aqueous formic acid. The pH of the stock solution was stabilized to establish linearity. A series of standard enrofloxacin solutions were made by further diluting the stock solution. The diverse concentrations of enrofloxacin solutions were added to plasma of untreated chicken to prepare different concentrations (1, 2, 5, 25, and 50 ng/mL) of enrofloxacin-spiked plasma samples. These samples were injected to LC-MS/MS and the enrofloxacin concentrations in the plasma matrix were quantified. The concentrations of enrofloxacin obtained from different samples by LC-MS/MS analysis were used to calculate accuracy, linearity, recovery percentage, calibration curve, and regression coefficient values. Three different concentrations of spiked plasma samples were injected six times individually to examine repeatability and reproducibility. The limit of detection (LOD) and limit of quantitation (LOQ) were calculated from the calibration curve by evaluating the enrofloxacin-spiked samples. The LOD and LOQ were determined from the slope of the calibration curve and the standard deviation (SD) of the responses as stated by the equations: LOD = (3.3 × SD)/slope [13] and LOQ = (10 × SD)/slope [14].
Determination of PK profile
LC-MS/MS was performed to quantify the enrofloxacin in the plasma samples of chickens. Samples were drawn at different time intervals after the IV or PO administration of the drug. Different features of enrofloxacin PKs were determined by using WinNonlin software (Version 6.1). The elimination half-life (T1/2), AUC, Cmax, peak time (Tmax), and absolute bioavailability (F) were estimated by using non-compartmental analysis. The absolute bioavailability of the drug applied through the PO route relative to the IV route was calculated by the equation, F = (AUCpo/AUCiv) × 100%. The AUCiv and AUCpo were obtained after IV and PO administrations, respectively.
PD profile determination
The broth microdilution procedure of the Clinical and Laboratory Standards Institute (CLSI) was utilized to evaluate the MIC and MBC of enrofloxacin against different strains of S. Enteritidis [15]. Enrofloxacin was successively diluted 2-fold in a 96-well microtiter plate in which the final drug concentration after bacterial inoculation would be 16–0.031 μg/mL. One hundred microliters of bacterial suspension from the mid-logarithmic phase were dispensed in individual wells so that the final cell density would be 5 × 10⁵ CFU/mL. The mixture of bacteria and drug substances in the 96-well plates were incubated for 18 h at 35°C. After incubation, the 96-well plates were assessed for MIC determination. MIC was considered as the lowest concentration of drug that inhibited visible growth of bacteria. The values of MIC50 and MIC90, which respectively represent the MIC values that inhibit the growth of at least 50% and 90% of isolates in a test population, were calculated [16]. Cultures (20 µL) from all wells that did not show visible growth were cultured again for 24 h on MHA plates at 35°C. The MBC is considered as the lowest concentration that completely inhibited the growth of bacteria on the MHA plate. All experimentations were performed in triplicates.
RESULTS
Validation of the analytical method
The analysis method validation results are displayed in Table 1. Good linearity (R2 > 0.9998) was observed within the concentration range of 1 to 50 ng/mL, and the quantified average recovery of enrofloxacin was 96%. The coefficient of variation percentage (%CV, within-run precision) was under 10%. The LOD and LOQ of enrofloxacin obtained via the LC-MS/MS method were 5 and 15 ng/mL, respectively.

PKs of enrofloxacin in plasma
Plasma concentrations of enrofloxacin quantified from different time points after IV and PO administrations are shown in Fig. 1, whereas, the PK indices of enrofloxacin associated with IV and PO applications are presented in Table 2. The Cmax of enrofloxacin were 3.82 ± 0.59 µg/mL and 6.74 ± 0.03 µg/mL for PO and IV administrations, respectively. The 24-hour area under the plasma concentration–time curves (AUC0–24) were 20.84 ± 5.00 h·μg/mL and 21.13 ± 0.90 h·μg/mL for PO and IV administrations, respectively. The T1/2 values were 12.84 ± 1.40 h and 25.84 ± 1.40 h for the IV and PO administrations, respectively. The absolute percentage of F of the enrofloxacin in chicken administered via the PO route was 98.60% ± 8.90% of that of the IV route.
Fig. 1
Concentration (ng/mL) of enrofloxacin in plasma after administration via various routes to chicken.
PO, peroral; IV, intravenous.
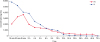
Table 2
Pharmacokinetic parameters of enrofloxacin following intravenous and peroral administrations
| Parameters | Unit | IV | PO |
|---|---|---|---|
| T1/2 | h | 12.84 ± 1.40 | 25.84 ± 1.40 |
| Tmax | h | 0.22 ± 0.10 | 0.65 ± 0.12 |
| Cmax | µg/mL | 6.74 ± 0.03 | 3.82 ± 0.59 |
| AUC0–24 | h·µg/mL | 21.13 ± 0.90 | 20.84 ± 5.00 |
| F | % | - | 98.60 ± 8.90 |
Values are means ± standard deviation of 8 samples. Values were determined by using WinNonlin software.
IV, intravenous; PO, peroral; T1⁄2, elimination half-life; Tmax, time of maximum concentration; Cmax, maximum concentration after administration; AUC0–24, area under the serum concentration-time curve from time zero to 24 h; F, bioavailability.
In vitro antibacterial activity of enrofloxacin
Table 3 shows the in vitro antibacterial activities (MIC and MBC) of enrofloxacin against 10 strains of S. Enteritidis. The MICs of this antibacterial agent were 0.0625–1.00 µg/mL against different strains of S. Enteritidis. The MBCs of enrofloxacin were 0.25–4.00 µg/mL against the tested S. Enteritidis strains. Among the 10 strains, 2, 2, and 6 strains showed 8, 4, and 2 MIC/MBC values, respectively. Thus, the MICs of enrofloxacin against those strains were 2- to 8-fold lower than their respective MBCs.
Integration of PK and PD data
The in vivo PK data and the in vitro MICs were integrated to evaluate the PK/PD parameters; the AUC0–24/MIC50 and Cmax/MIC50 are presented in Table 4. The AUC0–24/MIC50 ratio of enrofloxacin against S. Enteritidis after PO and IV administrations were 41.68 ± 0.10 and 42.26 ± 0.30 h, respectively. The Cmax/MIC50 of enrofloxacin after PO and IV administrations were 7.64 ± 0.20 and 13.48 ± 0.70, correspondingly. There were no significant differences in PK/PD parameters of enrofloxacin between the IV and PO administration routes.
Table 4
Pharmacokinetic/pharmacodynamic integration of enrofloxacin in chicken after IV and PO administrations (10 mg/kg b.w.)

| Parameters | IV | PO |
|---|---|---|
| AUC0–24/MIC50 (h) | 42.26 ± 0.30 | 41.68 ± 0.10 |
| Cmax/MIC50 | 13.48 ± 0.70 | 7.64 ± 0.20 |
Values are means ± standard deviation. Recommended dosage: AUC0–24/MIC50 ≥ 100–125; Cmax/MIC50 ≥ 8–10.
IV, intravenous; PO, peroral; b.w., body weight; AUC0–24, area under the serum concentration-time curve from time zero to 24 h; MIC50, minimum inhibitory concentration values that inhibit the growth of at least 50% of isolates; Cmax, maximum concentration after administration.
DISCUSSION
The design of a dose regimen for antibacterial agents should be based on their PK and PD properties to obtain the best therapeutic effect and to prevent the development of antibiotic resistance in bacteria [17]. In this study, we optimized the dosage regimen of enrofloxacin against S. Enteritidis in broiler chicken by applying a method involving PK and PD indices. We have optimized and validated a chromatographic method to determine the PK parameters of enrofloxacin after IV and PO administrations to chicken. This study established a promising PK profile of enrofloxacin in broiler chicken with regard to the rapid absorption and long duration of activity, which are manifested by the extended T1/2 and the creditable “F” value. The Cmax/MIC50 and AUC0–24/MIC50 of enrofloxacin were evaluated to estimate the successfulness in a clinical field.
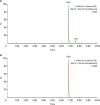
In order to quantify enrofloxacin in chicken plasma, an LC-MS/MS method was optimized and validated. To develop such a method, a number of trials are needed for selection of an appropriate mobile phase, which is due to the affinities of the mobile phase components in the direction of numerous solvents and the complexity of chemical compounds inside the biological samples. The ratios of the aqueous and organic phases were fine-tuned to achieve a simple and rapid assay method with an intense response, suitable retention time, and reasonable runtime. In the adjusted setting, the LC-MS/MS system can provide an enhanced symmetric band for enrofloxacin from both the standard solutions and plasma matrix. The peaks of enrofloxacin from the standard solution were perceived at about 6.8 min in the chromatogram (Fig. 2). The value of the mass to charge ratio (m/z) and the retention time of enrofloxacin from the enrofloxacin-spiked plasma samples were similar as they were achieved in the standard solutions (Fig. 2). The vital aspects of the optimized-quantitation technique are the efficient, simple, and fast extraction of enrofloxacin. Further, the lack of a need for derivatization and a shorter extraction time are key advancements provided by the current LC-MS/MS method.
Fig. 2
Representative LC-MS/MS chromatograms of spiked sample (A) and standard (B) solutions.
LC-MS/MS, liquid chromatography-tandem mass spectrometry.
The validation data from the LC-MS/MS method for enrofloxacin analysis in chicken plasma are presented in Table 1. In this method, linear feedback of enrofloxacin, based on the concentration of the standard range from 1–50 ng/mL, was observed. An analytical method is considered as linear when the value of correlation coefficient (r2) is more than 0.9900 [18]. The r2 value for enrofloxacin was 0.9998 in the currently optimized LC-MS/MS method, which establishes the presence of a linear relationship between the drug and its responses over a varied dynamic range (Table 1). The precision (%CV) of the optimized LC-MS/MS method was within the acceptable limits based on the rules of developing and validating analysis method [19].
The recovery rates of enrofloxacin from the chicken plasma samples, presented in Table 2, were attained through a comparison of the mean responses that were obtained from triplicate injections of various concentrations. The recovery of enrofloxacin from plasma was 96% (w/v) when the pure enrofloxacin was spiked with plasma. Following the guidelines of the International Conference on Harmonization, the LOD and LOQ of this analytical method were assessed on the basis of the slope of the calibration curve and the SD of the mean responses (Table 2) [13]. No interfering peaks from the mobile phase, matrix, and diluents were observed, and the measured-signals originated from the expected compounds, which confirm the specificity of the optimized LC-MS/MS method. When these spectra were overlain, there was no other co-eluting peak at the retention time of the desired compound observed, and the spectra were completely superimposed. Thus, from the method validation data, the suggested LC-MS/MS technique is validated and useful for determining and quantifying enrofloxacin in plasma samples in chickens.
The drug-response curves of enrofloxacin after the administration of 10 mg/kg b.w. to chickens via the IV and PO routes are displayed in Fig. 1. The daily recommended dose of enrofloxacin in chicken is 10 mg/kg b.w. [20]. Enrofloxacin was quantifiable in chicken plasma from 15 min to 72 h after administering through the PO route, whereas the compound was able to be measured for up to 72 h beginning a few minutes after IV administration. The mean enrofloxacin concentrations of 2 dosages administered at different times were almost identical except during the first part of the curve (0–45 min).
It is observed in this study that the elimination half-life of enrofloxacin is lengthy, which demonstrates that this drug has the advantage of maintaining an effective concentration in the body; thus, providing an extended time for interaction of the drug with the pathogen. The T1/2 of enrofloxacin in chicken after administering through IV route (12.8 h) was longer than the value in emu (4.36 h) [21], pigs (4.99 h) [22], calves (3.88 h) [22], dogs (4.07 h) [23], and horses (6.7 h) [24], and shorter than the values observed in pigs (26.6 h) and American alligators (21.05 h) [2225]. In this study, the T1/2 of enrofloxacin in chicken after administering through the PO route was 25.8 h, which is similar to that in elephant (18.4 h) [26], almost double that in African penguin (13.79 h) [27] and broiler chicken (14.23 h) [28], but much higher than that in emu (4.125 h) [21] and houbara bustard (6.80 h) [29]. At the time of elimination, enrofloxacin might be absorbed continuously from the gastrointestinal tract of chicken in this study, extending the elimination half-life of the drug, which may create a difference from the elimination half-life reported in other studies.
The Tmax value of enrofloxacin after administering through the PO route was 0.65 h in this study, which is lower than the Tmax value determined in broiler chicken (3.28 h) in another study [30]. The Tmax values after IV administration were higher in pig (1.81 h) [9] and houbara bustard (1.72 h) [29] and lower in sheep (0.042 h) [31] than the Tmax value in broiler chicken (0.22 h) in this study. Enrofloxacin was rapidly absorbed with a Cmax of 6.74 ± 0.03 µg/mL after IV administration in this study. A notably similar Cmax value (6.83 µg/mL) was obtained after IV administration of enrofloxacin in sheep [31]. Cmax of enrofloxacin was 3.82 ± 0.59 µg/mL after 0.65 h of PO administration in broiler chicken in this study. The Cmax obtained by oral administration of enrofloxacin in broiler chicken in another study was 1.63 ± 0.12 µg/mL at 3.58 ± 0.61 h (Tmax) [12]. Cmax values of 1.69 µg/mL at 2.52 h [32]; 1.9 µg/mL at 1.5 h [33]; and 1.5 µg/mL at 9 h [34] were reported after oral administration in chicken in previous studies. By using a compartmental method, enrofloxacin was shown to have Cmax values of 1.232 and 1.498 µg/mL in dogs and cats, respectively [31].
The Cmax values of enrofloxacin achieved in this study after administering through the PO and IV routes to chickens were greater than the break-point MIC for fluoroquinolone drugs [15]. The bioavailability of enrofloxacin was calculated to be 98.60% ± 8.90% after PO administration in this study; previously, absolute bioavailabilities of enrofloxacin have been reported after oral administration in broiler chicken (77.47% ± 5.86% and 80.10%) [14], emu (79.94% ± 7.15%) [21], and sheep (94.60%) [35]. In this study, the higher bioavailability (98.60% ± 8.90%) of enrofloxacin after oral administration might be due to the extended T1/2, which may induce elevated AUC values. The plasma concentrations of enrofloxacin were also compared to MICs against the tested strains. It is predicted that enrofloxacin concentration at the action site can be complementary to the concentration quantitated from plasma samples because of the low tissue distribution, high bioavailability, and low protein-binding properties of fluoroquinolones.
Integrating PK and PD data introduces an improved way for studying dose-titration for the selection of rational dosage regimens in medicine including veterinary antibacterials. Moreover, the PK/PD indices of an individual antibiotic against diverse strains are variable. Therefore, the study of PK/PD profiles of fluoroquinolone drugs against a particular strain is very important [36]. The values of PK/PD indices, for instance, the AUC0–24/MIC and Cmax/MIC of the target bacteria, have been utilized for predicting the clinical effectiveness of antibacterial drugs. The Cmax/MIC values ≥ 8–12 h and AUC0–24/MIC values ≥ 100–125 are generally utilized as threshold levels for an effective healing response of fluoroquinolone drugs against Gram-negative bacterial strains and are usually recognized as the best measures of activity for an antibacterial that kills bacteria concentration-dependently [37]. However, the threshold for an effective therapeutic response may be not similar in some fluoroquinolone drugs. The immune status of the animal markedly influences these differences. Moreover, the indices of PK/PD of a particular drug may also vary depending on the pathogen. Therefore, individually studying the PK/PD indices of fluoroquinolone drugs is greatly advantageous [36]. In the current study, comparatively low values of Cmax/MIC and AUC0–24/MIC for enrofloxacin against S. Enteritidis isolates after IV and PO administrations to chicken were obtained (Table 4). The results indicate that 10 mg/kg b.w. of enrofloxacin through PO or IV administration to broiler chicken is insufficient for treatment of infections caused by resistant strains of S. Enteritidis. Moreover, metabolic activity may affect the effective drug concentration in chickens, and the PK profiles of different chicken breeds may vary. Thus, increasing the existing dose by 5-fold (5 × 10 mg/kg b.w.) may provide effective responses of the drug against these bacterial strains.
The present study determined favorable PK indices of enrofloxacin administered via PO and IV dosage routes in chicken. Moreover, the research showed a correlation between the in vitro antibacterial activity of enrofloxacin against the pathogenic bacterium S. Enteritidis and the concentration of the drug in plasma. Further, it was demonstrated that enrofloxacin was completely absorbed and slowly eliminated after either PO or IV administrations in healthy chickens. The mean concentrations of enrofloxacin in plasma after 24 h of PO and IV administrations with 10 mg/kg b.w. were low compared to 0.25 µg/mL, which is below the MIC90 against most major pathogenic bacteria [36]. In conclusion, the data of this study indicate that the application of 50 mg/kg b.w. of enrofloxacin to chicken through PO and IV routes with a dosing interval of 24 h can effectively cure an S. Enteritidis infection thus demonstrating the need for a 5-fold increase in the recommended dosage of enrofloxacin in chicken.
 XML Download