

 PDF
PDF ePub
ePub Citation
 Print
Print


INTRODUCTION
Chronic myeloid leukemia (CML), a chronic myeloproliferative neoplasm, comprises 14% of all leukemias and arises from a reciprocal translocation between chromosomes 9 and 22; the resultant bcr-abl fusion protein is a constitutively active tyrosine kinase. The synthetic tyrosine kinase inhibitor imatinib mesylate is well-known as the first-line treatment for CML [1].
Imatinib has been recognized as a prototype for targeted therapy because it inhibits bcr-abl tyrosine kinase activity by competing with ATP at its binding sites, leading to inhibition of leukemogenesis [2].
Most patients achieve a good therapeutic effect with imatinib, but some patients are resistant to the drug and are at a greater risk of disease progression. The development of resistance to imatinib is a multifactorial phenomenon in patients with CML and may be mediated by diverse mechanisms [3]. Imantinib resistance is mainly categorized as primary or secondary resistance [45].
Primary resistance to imatinib is defined as the inability to achieve response milestones. The mechanisms by which resistance occurs can be grouped into BCR-ABL1-related and BCR-ABL1-independent [678]. Among the BCR-ABL1-independent factors are the polycomb genes, including B-cell specific Moloney murine leukemia virus integration region 1 (BMI1) and transmembrane transporters such as ATP-binding cassette (ABC) transporters [9101112].
Membrane-bound efflux transporters play important roles in mediating the chemoresistance of tumor cells. There are seven subfamilies of ABC transporters, named as ABCA through ABCG. Members of the ABC family are important in the mechanism of multidrug resistance. Imatinib is a substrate of ABC transporters [13]. The ABCB subfamily consists of 11 genes. The first and best-characterized ABC transporter is ABCB1, which is known as the multidrug resistance (MDR1) transporter and is thought to play a role in the multidrug resistance mechanism [1415161718]. In leukemia cells, these transporters are involved in drug extrusion, while in the gut mucosa and excretory organs, particularly the kidneys and liver, they are thought to reduce the absorption and increase the elimination of drugs [1112].
Polycomb group genes (PcGs) are epigenetic effectors involved in the progression of both solid and hematological malignancies [19]. Some members of this gene family have been implicated in chemotherapy resistance and proposed as innovative therapeutic targets in hematological and solid malignancies [1920].
BMI1 is a transcriptional repressor that belongs to the PcG family. Polycomb family proteins act mainly as transcriptional regulators by controlling specific genes involved in development, cell differentiation, proliferation, and senescence [21]. BMI1 represses the INK4A locus, which is a family of cyclin-dependent kinase inhibitors [22232425]. BMI1 also silences pro-apoptotic and onco-suppressive genes, thus mediating resistance in several neoplasms [262728].
MATERIALS AND METHODS
This study was conducted from February 2014 to December 2017 and included 81 (45 males and 36 females) patients with CML recruited from the Hematology Department of the Medical Research Institute, Alexandria University. The mean age of patients was 49 years. An age- and gender-matched control group composed of 20 healthy subjects (12 males and 8 females) were enrolled with a mean age of 45 years. Control subjects had no history of any hematologic disorders, and their complete blood counts were within normal ranges.
The diagnosis of CML was based on standard clinical data and confirmed by cytogenetic and molecular analyses. Sixty-five patients were in the chronic phase of CML and 16 cases were in the advanced phase (11 in accelerated and 5 in blastic phase). All patients gave informed consent. Sokal and Hasford scores were calculated for patients in the chronic phase at the initiation of treatment and patient risk was categorized as low, intermediate, and high. Before starting imatinib mesylate, the complete blood count, serum creatinine, and electrolytes were analyzed. Treatment was started at a dose of 400 mg/day in patients in the chronic phase and at doses of 600 and 800 mg/day in patients in the accelerated phase and blastic crisis, respectively. While on therapy, complete blood counts were monitored biweekly until the patients achieved a hematological response, after which monitoring was conducted monthly. The response to imatinib was evaluated according to the European Leukemia Net criteria [629]. Fifty patients achieved an optimal response, 16 patients achieved a suboptimal response, and 15 patients were imatinib-resistant. Patients who responded optimally to imatinib were further followed-up for progression-free survival (PFS). The follow-up period ranged from 18 to 35 months, with a median of 28.5 months.
Methods
RNA extraction and QRT-PCR
From each patient and healthy subject, 3 mL of EDTA-anticoagulated peripheral blood was collected and total RNA was extracted with QIAamp RNA blood mini kits (Qiagen, Hilden, Germany). The concentration and purity of extracted RNA were estimated by measuring absorbance at 260 and 280 nm using a Nano Drop spectrophotometer ND-1000 (Thermo Scientific, Waltham, MA, USA). Only samples with A260 to A280 ratios between 1.9 and 2.1 were included. Extracted RNA was reverse-transcribed into cDNA according to standard methods using a QuantiTect reverse transcription kit (Qiagen, Hilden, Germany).
The expression of ABCB1, BMI1, and GAPDH was assessed by quantitative real-time polymerase chain reaction (QRT/PCR) using the Applied Biosystems SteoOne Real-Time PCR System (Foster City, CA, USA). All Q-RT/PCRs were performed in a 50 µL volume. GAPDH expression was measured as an endogenous cDNA control.
The sequences of the primers and probes were as follows: ABCB1 F, 5′-AGACATGACCAGGTATGCCTAT-3′; ABCB1 R, 5′-AGCCT ATCTCCTGTCGCATTA-3′; BMI-1 forward primers 5′-GTATTCCCTCCACCTCTTCTTG-3′, BMI-1 reverse primers 5′-TGCTGATGACCCATTTACTGAT-3′. The sequences of the primers and probes for the GAPDH control were as follows: GAPDH forward primer: 5′-GAAGGTGAAGGTCGGAGTC-3′, GAPDH reverse primer: 5′-GAAGATGGTGATGGGATTTC-3′.
Samples volumes of 50 µL in each tube contained 25 µL universal master mix, 2.5 µL each primer, 10 µL water, and 10 µL sample. PCR was performed as follows: 1 cycle for 2 min at 52℃, 1 cycle for 10 min at 95℃, 40 cycles for 15 sec at 95℃, and 1 min at 60℃. The relative amounts of the genes of interest and GAPDH were measured in 3 independent assays. The comparative expression levels were determined as the ratio between the relative amounts of the genes of interest and housekeeping gene (GAPDH) to correct for variations in the amounts of mRNA, and then normalized to the mean level of studied controls as determined by the 2−ΔΔCT method [30].
Statistical analysis
Statistical analyses were performed using the software package SPSS/Win version 16 (SPSS, Inc., Chicago, IL, USA). Qualitative data were presented as the frequency and percentage. Chi square test was used to compare groups. Quantitative data were presented as the median or mean and standard deviation. To compare groups, t-test and Mann-Whitney test were used according the type of data. Kaplan-Meier test was used for PFS analysis and the significance of differences among curves was determined by log-rank test. Patients were divided into groups based on Q-RT/PCR values delineated by the median. A P-value less than 0.05 was considered significant.
RESULTS
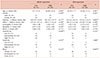
The ABCB1 mRNA expression level did not differ significantly between patients and controls. BMI1 mRNA expression was significantly higher in patients than in controls (P=0.030) (Table 1).
As assessed by the Sokal score, the risk of patients in the chronic phase was stratified as low-risk (12 patients), intermediate-risk (41 patients), and high-risk (12 patients). For the Hasford score, 21 patients showed a low-risk score, 29 patients showed an intermediate-risk, and 15 patients showed a high-risk score.
According to the median expression level of ABCB1 and BMI1, patients were grouped into a low-expression group (expression level less than or equal to the median) or high-expression group (expression level higher than the median). No significant association was found between the ABCB1 expression level and age, spleen size, Sokal score, Hasford score, phase of CML, total leukocytic count, Hb concentration, platelet count, eosinophil percentage, basophil percentage, or blast percentage at diagnosis (Table 2). The BMI1 expression level was not associated with age, spleen size, Sokal score, Hasford score, total leukocytic count, Hb concentration, eosinophil percentage, basophil percentage, or blast percentage at diagnosis. In contrast, the platelet count was significantly higher in the high versus low BMI1 expression groups (P=0.004). BMI1 expression levels were significantly higher in patients with advanced phase (accelerated and blastic crisis) than in patients with chronic-phase CML (P=0.004) (Table 2).
Among the 65 patients with chronic phase CML, 42 and 12 patients achieved optimal and suboptimal responses to imatinib, respectively. Eleven patients were imatinib-resistant. ABCB1 mRNA expression was significantly lower in patients who achieved an optimal response to imatinib compared to those who did not achieve this response (P=0.001). BMI expression did not differ significantly between the 3 response groups (P=0.950) (Table 3).
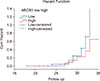
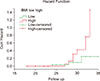
Of the 16 patients who presented with advanced phase, 8 achieved an optimal response to imatinib. The 50 patients who achieved an optimal response in the whole cohort were followed-up and the PFS was 74% at a median follow-up period of 28.5 months. The ABCB1 expression level did not significantly affect the PFS of patients (P=0.289) (Fig. 1). In contrast, patients displaying low BMI1 expression levels at diagnosis had a longer PFS than patients with statistical values approaching significance (P=0.052) (Fig. 2).
DISCUSSION
The use of tyrosine kinase inhibitors, particularly imantinib, for treating patients with CML has significantly improved the clinical outcomes of these patients. Numerous molecular studies have investigated the various factors affecting the responsiveness to this therapy. Among these studies, differences in the expression levels of BMI1 and ABCB1 and their relationship with imatinib resistance have been evaluated [5].
In the present study, there was no significant difference between patients and healthy individuals in the expression level of ABCB1 mRNA. Low ABCB1 expression was observed in patients who achieved an optimal response to imatinib. Non-responders showed the highest ABCB1 levels. This may be because of the decreased intracellular concentration of imatinib when ABCB1 was overexpressed. Our results agree with those of Radza et al., Solali et al., and others [131323334]. Moreover, Eadie et al. [1] found that the level of ABCB1 mRNA remained high during imatinib therapy in patients who failed therapy or underwent disease progression. Kim et al. [35] showed that the ABCB1 expression level was significantly higher in poor imatinib responders. In contrast, Ben Hassine et al. and others reported [536] no significant difference in ABCB1 expression among responders and non-responders. These controversial data may be attributed to variabilities in the sample size, patient ethnicity, and disease phase [5].
In this study, we found no association between the expression levels of ABCB1 and phases of the disease, different prognostic factors, and PFS. A total of 77% of our patients had low and intermediate Sokal scores, while 19 patients had high Sokal scores. This result agrees with those of Francis et al. [37]. We found no association between the phases of CML, response to treatment, and PFS in patients with high Sokal scores compared to in patients with low and intermediate Sokal scores. Contrasting findings were reported by Castagnetti et al. [38] who found that low and intermediate Sokal scores were associated with optimal imatinib responses and better overall survival. This may be explained by the low number of patients with high Sokal scores compared to the total number of cases in the current study.
BMI1 overexpression has been observed in several types of cancer, including hematologic neoplasms [3940]. In the present study, BMI1 expression was significantly upregulated in patients with CML compared to in healthy controls. The BMI1 expression level was significantly higher in patients in the blastic and accelerated phase than in those in the chronic phase. Our data agree with the findings of previous studies [102641].
We found no association between the BMI1 expression level and age, gender, total leukocytic count, and Hb level at diagnosis. Similar results were reported by Saudy et al. [41].
In the present study, high BMI1 expression was associated with shorter PFS compared to the low BMI1 expression group with a borderline significant difference. In agreement with this, Saudy et al. [41] and Mohty et al. [26] showed that higher BMI1 expression predicted significantly shorter overall survival than low BMI1 expression.
The results of the present study emphasize the expected effects of ABCB1 as a drug efflux pump and BMI1 as an adverse tumor behavior controller. High ABCB1 expression reduces the intracellular imatinib concentration and consequently lowers its efficacy. High BMI1 expression mediates resistance through selective transcriptional regulation and lowers the efficacy of imatinib.
ABCB1 mRNA expression levels before treatment are related to the response to imatinib in patients with CML. This prognostic value requires further evaluation including monitoring the change in the expression levels of ABCB1 after starting imatinib therapy. The expression levels of BMI1 are useful for risk stratification of patients with CML, and its measurement at the time of diagnosis may help predict treatment outcomes. Future screening for ABCB1 and BMI1 expression may help refine CML management by predicting the outcome of imatinib therapy.


 XML Download