

 PDF
PDF ePub
ePub Citation
 Print
Print


INTRODUCTION
Autoimmune involvement in the pathogenesis of asthma has been proposed. Epidemiological studies have shown that asthma and autoimmune disease were associated at the population level and shared common risk factors.123 At the individual level, physician-diagnosed asthma was positively associated with reports of physician-diagnosed autoimmune disorders4 and there was an increased prevalence of asthma symptoms in patients with autoimmune diseases.5 Recent findings in experimental asthma animal models also supported the autoreactive involvement in allergic asthma as well.6
Autoantibodies (Abs) are a hallmark of autoimmunity. Increased levels of Abs have been detected in most autoimmune disorders.7 In asthmatic patients, especially non-allergic asthmatics, several elevated serum Abs (Se-Abs) against bronchial tissue antigens and nuclear antigens have been detected, which further provides evidence that the cause of asthma may be related to autoimmune dysregulation.8910111213141516
However, very few of those elevated Se-Abs which have been identified in asthmatic patients were significantly associated with clinical characteristics of asthma. It has been considered, therefore, that the Se-Abs might serve as indicators of immune dysregulation16 as opposed to active causes of asthma pathophysiology. A case report described 3 patients with uncontrolled asthma who demonstrated autoimmune inflammation in their airways and responded to therapy directed against autoimmune disease.17 In addition, there is an autoimmune endotype of severe asthma identified by the presence of sputum Abs (Sp-Abs) against eosinophil (Eos) peroxidase and autologous cellular components, but with a notable absence of circulating Ab.18 These studies offer new insights that autoimmune responses in the airways could be a risk factor for the progression of asthma, which aroused our interest in whether Sp-Abs—in contrast to Se-Abs—might be more relevant to asthma clinical characteristics, if so, whether Se-Abs could be a proxy candidate for Sp-Abs to reflect airway localized autoimmune responses, considering that Sp induction is less common implementation in clinical setting compared to blood collection.
There are very limited data about the associations between asthma clinical characteristics and autoimmunity in the airways. We conducted a prospective study to measure 10 types of Abs in matched Sp and Se samples and further compared and analyzed their associations with clinical characteristics. Our selected Abs—Ab against proteinase-3 (anti-PR3), Ab against La/Sjögren syndrome type B antigen (anti-SSB), Ab against Ro/Sjögren syndrome type A antigen (anti-SSA), Ab against Smith antigen (anti-Sm), Ab against ribosomal phosphoprotein P0 (anti-P0), Ab against DNA topoisomerase (anti-Scl-70), Ab against histidyl-tRNA synthetase (anti-Jo1), Ab against U1 small nuclear ribonucleoprotein (anti-U1-SnRNP), Ab against myeloperoxidase (anti-MPO) and Ab against thyroid peroxidase (anti-TPO)—have been examined in previous research aiming to explore the relationship between asthma and autoimmune disease716 or commonly present in autoimmune diseases.19
MATERIALS AND METHODS
Study design and subjects
We conducted a prospective observational study (Fig. 1). Between December 2016 and December 2017, we screened adult patients with asthma treated at the Department of Allergy and Clinical Immunology at The First Affiliated Hospital of Guangzhou Medical University. We recruited control volunteers by means of local advertising. All asthmatic subjects met the following inclusion criteria: 1) an expert physician's diagnosis of asthma with objective evidence (defined as ≥1 of the following: peak flow variation ≥ 20% over a 2-week period, bronchodilator reversibility ≥ 12% and > 200 mL, or airway hyperresponsiveness [methacholine PC20 ≤ 8 mg/mL]); 2) treated with regular controller medications for ≥6 months and maintaining asthma control (asthma control test ≥ 20). Healthy volunteers had no prior history of respiratory and autoimmune disease. Asthma treatment intensity was used as a marker for disease severity and defined according to Global Initiative for Asthma (GINA) treatment steps with the following severity strata20 (GINA1–2, mild; GINA3, moderate; and GINA4–5, severe). Subjects and control volunteers were excluded if they had 1) physician-diagnosed autoimmune diseases or current or past symptoms consistent with undiagnosed autoimmune disease; 2) other respiratory diseases, including emphysema, chronic obstructive pulmonary disease, bronchiectasis, pneumonia or lung damage caused by previous medical conditions such as pulmonary tuberculosis; 3) asthma exacerbations in 3 months prior to recruitment (defined as need to double dosage of inhaled corticosteroids [ICS], use of systemic corticosteroids and visit at the emergency department or hospitalization).
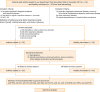 | Fig. 1Flow diagram of study progression.ACT, asthma control test; GINA, Global Initiative for Asthma; FeNO, fractional exhaled nitric oxide; anti-PR3, autoantibody against proteinase-3; anti-Sm, autoantibody against Smith antigen; anti-P0, autoantibody against ribosomal phosphoprotein P0; anti-SSA, autoantibody against Ro/Sjögren syndrome type A antigen; anti-SSB, autoantibody against La/Sjögren syndrome type B antigen; anti-Scl-70, autoantibody against DNA topoisomerase; anti-Jo1, autoantibody against histidyl-tRNA synthetase; anti-U1-SnRNP, autoantibody against U1small nuclear ribonucleoprotein; anti-MPO, autoantibody against myeloperoxidase; anti-TPO, autoantibody against thyroid peroxidase.
|
The subjects underwent a standardized assessment including age, body mass index, duration of asthma (determined by patient's recall of first experiencing symptoms of asthma), pulmonary function, Sp induction, allergy status, fractional exhaled nitric oxide (FeNO) and blood examinations.
The study was approved by the Ethics Review Board of the First Affiliated Hospital of Guangzhou Medical University[medical ethics year 2017, No. 25]. All participants provided written informed consent.
Pulmonary function and FeNO
Pulmonary function was conducted by trained operators with a spirometer (MasterScreen PFT; Jaeger™, CareFusion, Hoechberg, Germany), in accordance with the American Thoracic Society/European Respiratory Society guidelines.21 Parameters, including percent of predicted forced vital capacity (FVC%) predicted and forced expiratory volume in 1 second of predicted, and midflows (average forced expiratory flow during the mid (25%-75%) portion of FVC maneuver, were recorded. FeNO were measured with a portable rapid response chemiluminescent analyzer at an expiratory flow rate of 50 mL/s (NIOX System, Aerocrine, Sweden).22
Allergen sensitization
Allergen sensitizations were assessed by means of Se allergen-specific immunoglobulin E (IgE) (ImmunoCAP®; Phadia, Uppsala, Sweden). Subjects were characterized as atopic if they had at least 1 positive response to a common aeroallergen (house dust mites, cat, dog, grass pollen, tree pollen and a mixture of molds).
Collection and processing of induced Sp and Se
Sp induction was performed according to a method previously described.23 Briefly, patients received 2 puffs of salbutamol (100 μg/puff) 15 minutes prior to the procedure. Sp was induced from each subject by inhalation of 3% hypertonic saline solutions for 15 minutes. Patients rinsed their mouth with 0.9% saline solution before Sp expectoration in order to minimize oral contamination, and blew their nose. They expectorated Sp into a cup. The first portion of Sp was discarded, and the inhalation procedure was continued for a further 15 minutes. Eight volumes of PBS were added to the final Sp, and the sample was mixed vigorously on a plated shaker for 15 minutes at 4°C, then the Sp sample was centrifuged (3,000 revolutions per minute for 10 minutes at 4°C). Four volumes of the supernatant of the Sp were collected and stored at −80°C, and then 2 volumes of dithiothreitol solution were added to the Sp for 15 minutes to solubilize mucus. The Sp samples were centrifuged and cell counts were performed on the cell pellet. Differential cell counts were performed on cytospin preparations. Blood samples were taken from the recruited patients and centrifuged (3,000 revolutions per minute for 10 minutes at 4°C). Then the Se was collected and stored at −80°C.
Detection of Abs
Ten autoantigens, including PR3, P0, SS-A, SS-B, Scl-70, Jo-1, U1-SnRNP, Sm, MPO and TPO, were previously coupled to multiplex magnetic beads (Bio-Rad, Hercules, CA, USA) and then incubated with Sp supernatant, and Se samples diluted 1:10 and 1:180, respectively, at 37°C for 1 hour. The beads were washed 3 times using the Bio-Plex Pro™ wash station (Bio-Rad), and biotin-conjugated anti-human IgG (ThermoFisher, Waltham, MA, USA) at a 1:1,000 dilution was then added to each well and incubated at 37°C for 1 hour. Thereafter, the wells were washed 3 times and streptavidin-R-phycoerythrin (Bio-Rad) at a 1:100 dilution was then added to each well and incubated at 37°C for 15 minutes. The beads were washed 3 times and resuspended using the assay buffer. The mean fluorescence intensity of each encoded microsphere was measured using a Bio-Plex 200 (Bio-Rad). Bio-Plex Manager™ 6.0 software (Bio-Rad) was used to obtain the result.
Statistical analysis and visualization
Statistical analysis was performed using the SPSS software package (version 18.0; IBM Corp., Armonk, NY, USA). Continuous variables are expressed as number (%), means (standard deviation [SD]) or medians (interquartile range). Comparisons between groups were made using the t test or Mann-Whitney U test for continuous endpoints and the χ2 test for categorical endpoints. Correlation analysis was assessed using Pearson's correlation or Spearman's correlation. A P value of <0.05 was considered significant.
The correlation matrix of the Abs and clinical parameters were displayed by Heatmap graphic created with GraphPad Prism 7. We used Gephi (version 0.9.2; GitHub, Inc., San Francisco, CA, USA) to create the network graphic of the 20 Abs. Each Ab is represented in the graph by a specific node whose color represents a specific cluster. The size of the node is proportional to the sum of the edges that connects to them. Edges connecting nodes represent statistically significant correlations (P < 0.05). The edge's thickness represents the strengths of their association (Spearman's correlation). The correlation coefficient is represented by color, with green and purple indicating positive and negative relationships. We used the existence of modules represented by highly interlinked topological clusters in the network using the computational algorithm proposed by Blonde et al.24 included in the Gephi statistical module. This community detection algorithm is based on a network property called modularity. Modularity is the fraction of the edges that fall within the given groups of nodes minus the expected fraction if the edges were distributed at random. The value of the modularity lies in the range of −1 to 1. If positive then the number of edges within groups exceeds the number expected on the basis of chance.25
RESULTS
Patients
After screening, we recruited 70 asthmatic patients and 50 healthy volunteers into the study, but 20 asthmatic patients and 26 healthy controls were excluded because of failure of Sp induction. According to the GINA guidelines, 50 patients with asthma were divided into 3 groups: 15 with mild asthma, 18 with moderate asthma and 17 with severe asthma. All of these patients included in the current study had received treatment recommended by the GINA and achieved asthma control. Among these patients, 60% were atopic as confirmed by a positive Se specific IgE. The clinical characteristics of the subjects are shown in Table.
Table
Demographic and clinical characteristics of healthy controls and patients with different severity of asthma
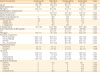
Data expressed as mean ± standard deviation, median (interquartile range) or number (%).
The P value was calculated from the χ2 test, ANOVA, Kruskal-Wallis test among the 4 groups.
Sp, sputum; Se, serum; BMI, body mass index; BDP, beclomethasone dipropionate; FEV1, forced expiratory flow in 1 second; FVC, forced vital capacity; FEF25–75, forced expiratory flow between 25 and 75% of vital capacity; Neu, neutrophil; Eos, eosinophil; ICS, inhaled corticosteroid; CS, corticosteroid; IgE, immunoglobulin E; FeNO, fractional exhaled nitric oxide; ACT, asthma control test; LABA, long-acting beta-adrenoceptor antagonist; LTRA, leukotriene receptor antagonist; LAMA: long-acting muscarinic antagonist.
![]()
Sp- and Se-Ab concentrations and their associations with clinical parameters
The concentrations of Sp-anti-Sm, Sp-anti-U1-SnRNP, and Se-anti-TPO in severe asthmatic patients and Sp-anti-U1-SnRNP in moderate patients were significantly higher compared to those in the mild asthmatic group or healthy controls (P < 0.05; Fig. 2). Using the mean plus 2 SD of healthy controls as the cutoff value, the prevalence of Sp-anti-U1-SnRNP, Sp-anti-Sm, Sp-anti-TPO are 24%, 10% and 12%, respectively in the total asthma group while those are 41%, 12% and 23%, respectively in the severe asthma group. Abs are known to increase with age. In our study population, the age of subjects increases with asthma severity. Therefore, it is essential to adjust for age in order to show that Abs are related to asthma severity. Of all detected Abs, with adjustment for age, Sp-anti-U1-SnRNP levels were significantly correlated with the dose of ICS (r = 0.326, P = 0.022), FeNO (r = 0.241, P = 0.025), and Sp-Eos counts (r = 0.356, P = 0.012) and inversely correlated with Sp neutrophil (Sp-Neu) counts (r = −0.308, P = 0.031). In addition, the age of asthmatic subjects was inversely correlated with Se-anti-PR3 (r = −0.286, P = 0.044), Se-anti-SSA (r = −0.401, P = 0.004), Se-anti-Sm (r = −0.280, P = 0.049) and Se-anti-Scl-70 (r = −0.442, P = 0.001) (Fig. 3). However, intriguingly, our 10 Sp-Abs do not show any correlations with age.
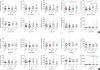 | Fig. 2Ten types of Sp (panel A) and Se (panel B) Abs in asthmatic patients and healthy volunteers.Sp, sputum; Se, serum; Ab, autoantibody; anti-PR3, autoantibody against proteinase-3; anti-SSB, autoantibody against La/Sjögren syndrome type B antigen; anti-SSA, autoantibody against Ro/Sjögren syndrome type A antigen; anti-Sm, autoantibody against Smith antigen; anti-U1-SnRNP, autoantibody against U1small nuclear ribonucleoprotein; anti-Scl-70, autoantibody against DNA topoisomerase; anti-P0, autoantibody against ribosomal phosphoprotein P0; anti-Jo1, autoantibody against histidyl-tRNA synthetase; anti-MPO, autoantibody against myeloperoxidase; anti-TPO, autoantibody against thyroid peroxidase.
*P < 0.05 indicates statistical significance between 2 groups for the concentration of Ab (Mann-Whitney U test).
|
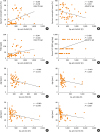 | Fig. 3The scatter plots of the correlations between Sp- and Se-Abs with clinical characteristics (the correlations with P > 0.05 were not shown). (A-D) performed partial correlation analysis adjusted by age. (E-H) performed Spearman correlation analysis.Sp, sputum; Se, serum; Ab, autoantibody; ICS, inhaled corticosteroid; BDP, beclomethasone dipropionate; FeNO, fractional exhaled nitric oxide; FI, fluorescence intensity; anti-SnRNP, autoantibody against small nuclear ribonucleoprotein; anti-PR3, autoantibody against proteinase-3; anti-SSA, autoantibody against Ro/Sjögren syndrome type A antigen; anti-Sm, autoantibody against Smith antigen; anti-Scl-70, autoantibody against DNA topoisomerase.
|
The correlation matrix of Abs
Fig. 4 depicts the correlations among Abs. Multiple positive correlations were seen among the Sp-Abs and Se-Abs, but very few correlations were seen between Sp-Abs and Se-Abs. Notable findings include: 1) numerous high correlations among ten Sp-Abs (P < 0.05); 2) numerous correlations among ten Se-Abs with less intensity compared to Sp-Abs' correlations (P < 0.05); 3) very few significant correlations between Sp-Abs and the Se counterparts; 4) Sp-anti-Scl-70 was negatively correlated with Se-anti-Scl-70 (r = −0.334, P = 0.018) and Sp-anti-TPO was positively correlated with Se-anti-TPO (r = 0.637, P = 0.000).
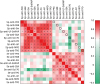 | Fig. 4The correlation matrix of Abs.Sp, sputum; Se, serum; Ab, autoantibody; anti-PR3, autoantibody against proteinase-3; anti-SSB, autoantibody against La/Sjögren syndrome type B antigen; anti-Sm, autoantibody against Smith antigen; anti-U1-SnRNP, autoantibody against U1small nuclear ribonucleoprotein; anti-SSA, autoantibody against Ro/Sjögren syndrome type A antigen; anti-Scl-70, autoantibody against DNA topoisomerase; anti-P0, autoantibody against ribosomal phosphoprotein P0; anti-Jo1, autoantibody against histidyl-tRNA synthetase; anti-MPO, autoantibody against myeloperoxidase; anti-TPO, autoantibody against thyroid peroxidase.
*P < 0.05, †P < 0.01, ‡P < 0.001, a circle represents a correlation between Sp- and Se-Abs regarding 1 type of Ab.
|
Network-based analysis
To further understand the different patterns between Sp-Abs and Se-Abs, we performed a network-based analysis (Fig. 5). The network graph comprises 20 nodes, with each representing an Ab and a total of 73 links representing those correlations with a P value of < 0.05.
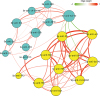 | Fig. 5The network-based analysis for the associations between Abs in Sp and Se. The network graph was constructed with the 20 Abs. Each Ab is represented in the graph by a specific node who's color represents a specific cluster and the size of the node is proportional to the sum of the edges that connect to them. Edges between nodes represent a statistically significant association (P < 0.05). The edge's thickness represents the strengths of their association (correlation coefficient, Spearman's correlation). The correlation coefficient is represented by color, with green and purple indicating positive and negative relationships, respectively.Ab, autoantibody; Sp, sputum; Se, serum; anti-PR3, autoantibody against proteinase-3; anti-Sm, autoantibody against Smith antigen; anti-P0, autoantibody against ribosomal phosphoprotein P0; anti-SSA, autoantibody against Ro/Sjögren syndrome type A antigen; anti-SSB, autoantibody against La/Sjögren syndrome type B antigen; anti-Scl-70, autoantibody against DNA topoisomerase; anti-Jo1, autoantibody against histidyl-tRNA synthetase; anti-U1-SnRNP, autoantibody against U1small nuclear ribonucleoprotein; anti-MPO, autoantibody against myeloperoxidase; anti-TPO, autoantibody against thyroid peroxidase.
|
The network graph contains 2 clusters of highly interlinked nodes. Cluster 1 is comprised of 10 nodes (yellow) which included 10 types of Sp-Abs (shown as Sp-anti-PR3, Sp-anti-Sm, Sp-anti-P0, Sp-anti-SSA, Sp-anti-SSB, Sp-anti-Scl70, Sp-anti-Jo1, Sp-anti-U1-SnRNP, Sp-anti-MPO and Sp-anti-TPO). Cluster 2 is comprised of 10 nodes (light blue), including 10 Se-Abs (shown as Se-anti-PR3, Se-anti-Sm, Se-anti-P0, Se-anti-SSA, Se-anti-SSB, Se-anti-Scl70, Se-anti-Jo1, Se-anti-U1-SnRNP, Se-anti-MPO and Se-anti-TPO).
DISCUSSION
We investigated the concentrations of 10 types of Abs in matched Sp and Se samples from asthmatic subjects and explored their associations with clinical characteristics. According to our results, the concentrations of Sp-anti-Sm, Sp-anti-U1-SnRNP, Sp-anti-TPO and Se-anti-TPO in severe asthmatic patients and Sp-anti-U1-SnRNP in moderate asthmatic patients were significantly higher compared to those in mild asthmatic patients or healthy controls (P < 0.05). With adjustment for age, Sp-anti-U1-SnRNP levels were positively correlated with the dose of ICS, Sp-Eos and FeNO, and negatively correlated with Sp-Neu. In addition, Spearman's correlation matrix showed multiple inter-correlations among Sp-Abs and Se-Abs, respectively, while only the levels of anti-Scl-70 and anti-TPO in Se were significantly correlated with the Sp counterparts. The network-based analysis defined 2 clusters: clusters 1 and 2 contained 10 Sp-Abs and 10 Se-Abs, respectively. Overall, our findings presented with extremely diverse Ab characteristics and clinical relevance between matched Sp and Se samples from asthmatic subjects.
The increased frequency of Se-Abs in asthma has been reported previously. In 1965, Serafini et al.26 discovered organ-specific Abs in the Se of asthmatic patients. Since then, a growing number of Se-Abs have been found in asthmatics, including airway-specific and other types of Abs.16 However, without enough meaningful links to asthma, most of them were considered to be indicators of immune dysregulation in asthmatics instead of playing a pathological role.11 Similarly, of 10 Se-Abs in our study, only the level of Se-anti-TPO in severe asthmatic patients was higher than those in healthy volunteers and mild asthmatic patients. However, these Se-Abs had not shown an association with clinical characteristics.
Conversely, in severe asthmatic patients with persistent eosinophilia, Abs against eosinophil peroxidase in Sp (but absent from circulation) have been found to be related to eosinophilic nflammatory activity, which suggests that autoimmune events localized to the airways play a pathological role in patients with an “autoimmune endotype” of severe asthma.18 Spencer et al.17 described 3 asthmatic patients with a poor response to therapy who had displayed pathologic features of autoimmune inflammation in the airways and Mukherjee et al.27 further reported a case of a severely eosinophilic patient who developed airway autoimmune responses while receiving low-dose mepolizumab treatment. These prior studies and reports collectively revealed that the deterioration of asthma might have a crucial association with local autoimmune responses in some patients. In our study, of 10 Sp-Abs, we found that the concentrations of Sp-anti-U1-SnRNP and Sp-anti-Sm in severe asthmatic patients and Sp-anti-U1-SnRNP in moderate asthmatic patients were significantly higher than those in healthy volunteers or mild asthmatics. As we observed, the frequency of elevated Sp-Abs was higher in severe asthma, which suggests that autoimmune responses might be relevant to the progression of asthma, reflecting similar observations by Mukherjee et al.18 In addition, Sp-anti-U1-SnRNP significantly correlated with clinical asthma characteristics, including eosinophilic inflammation and the dose of ICS, but similar results were absent in the Se-Ab counterparts. Taken together, it seems that the detection of Sp-Abs, compared to the measurement of Se-Abs, contains more information regarding the relationship between autoimmune responses and asthma, regardless of its less common implementation in clinical practice.
In clinical practice and research, Se is a widely used sample. However, very few Se-Abs have been meaningfully linked to asthma. Interestingly, Schiøtz et al.28 found Sp rheumatoid factor in patients with cystic fibrosis, but not in Se, suggesting local production of RF in the CF airways. Lacedonia et al.29 observed that the microRNA expression profile in Se was different from Sp in asthmatic patients. In our study, we observed that there were multiple significant inter-correlations among Sp-Abs and Se-Abs, respectively, while there were very few correlations between Sp-Abs and Se-Abs. Only 2 of 10 Se-Abs were significantly correlated with their Se-Ab counterparts. Furthermore, the Sp- and Se-Abs were completely separated and clustered into 2 specific groups. Such “separated” phenomenon we have observed could be explained as follows: Sp-Abs only stem from the Abs secretion in the airways, whereas Se-Abs could source from any part of the body where occur autoimmune responses which might concentrate the levels or could be diluted through the transportation from the airway to the elbow (the most common sites collecting blood samples).
Furthermore, Se-Abs are known to increase with age in healthy subjects,3031 linking to immunosenescence leading increased exposure to self-antigen.32 However, in diseases, especially some of which related to impaired immune system exhibited a reduction in Se-Abs.3334 Similarly, we observed that 4 Se-Abs, comprising of Se-anti-Sm, Se-anti-PR3, Se-anti-SSA and Se-anti-Scl-70, were negatively correlated with age. It is worth noting that, of 10 Sp-Abs included in the current study had no significant correlation with age, but some of which did significantly correlate with asthma parameters. It seems that, rather than aging, persistent inflammation localized in the airways plays a more critical role in triggering the Sp-Abs production in asthmatic patients, through damaging airway tissue causing increased exposure of self-antigens. To sum up, our findings highlight that Se-Abs are likely to be affected by age, whereas persistent inflammation localized in the airways tend to be the main trigger for the excess Sp-Abs production.
Although anti-TPO was considered as the hallmark of autoimmune thyroiditis, the elevated concentration of anti-TPO has been demonstrated in other diseases such as asthma, breast cancer and chronic urticaria.35 Previous work has shown that Se anti-TPO levels in asthmatic patients were significantly higher compared to controls, but without any symptom related to autoimmune thyroiditis.3637 In our study, an extremely high concentration of Se-anti-TPO was measured in some of the moderate and severe asthmatic subjects. None of these asthmatic patients displayed any symptom of thyroiditis. In addition, we observed that a portion of these subjects with increased Se-anti-TPO exhibited a high concentration of Sp-anti-TPO. Intriguingly, although not previously reported in lung tissue, Voraphani et al.38 found that TPO was highly expressed in epithelial microarrays and further confirmed that the expression of TPO was particularly elevated in the airway epithelium of severe asthmatic patients. However, since we failed to see any association of Sp- or Se-anti-TPO with asthma, we could not clarify the impact of anti-TPO, especially Sp-anti-TPO, in asthma in the present study. Further studies are needed.
In 1996, Weiler et al.39 demonstrated that immunoglobulin could induce Eos degradation and release free granules which were not responsive to dexamethasone. Recently, it is reported that steroid-resistant asthmatic population has a higher prevalence of Sp-Abs which could enhance the activity of eosinophils leading to release Eos extracellular traps, but also could not be suppressed by using dexamethasone in vitro.18 Therefore, it seems that excess Abs could contribute to the development of asthma by serving as an Eos degranulation stimulant. Although dexamethasone at a physiologically relevant concentration could not interfere with the process of Eos degranulation in vitro, it cannot be simply ruled out that asthma maintenance medication could not affect those elevated Abs after a long period of treatment. A longitudinal clinical study assessing the influence of asthma drugs on the levels of Sp-Abs and the efficacy of asthma maintenance medication for patients with high Sp-Abs is urgently needed. Furthermore, persistent airway inflammation is pivotal to the pathophysiology of asthma, which can cause epithelial damage resulting in the exposure of self-antigens. With progression of disease and persistence of inflammation, the airways are constantly exposed to immunogenic entities, the ongoing process might trigger the adaptive immune response to cause autoimmune dysregulation which might start accumulating a cocktail of chemokines such as B-cell activating factor, B-cell chemoattractant, supporting ectopic lymphoid neogenesis, in situ Ab generation.40
The present study has limitations. First, the 10 types of Abs included in our study are not specific to asthma, which presented a relatively low prevalence and could be a limiting factor to identify pathological Abs contributing to asthma mechanism. Even though a direct causality between our included Abs and the mechanism of asthma could not be established, with the findings of differences in Ab characteristics in the matched Sp and Se, we propose that instead of Se-Abs, targeting Sp-Abs comprising of Abs targeted against pathological factors, such as Eos degranulation proteins, might be more beneficial for ongoing investigations in context to the role of airway autoimmune responses in asthma. Secondly, although we found some significant associations of Sp-Abs with clinical parameters, the design of the current study does not allow conclusions about the cause and effect of the production of these Sp-Abs in asthmatic patients, including Sp-anti-U1-SnRNP, Sp-anti-Sm and Sp-anti-TPO. The underlying explanation might be relevant to persistent airway inflammation which damages intact tissue causing excess exposure to self-antigen.
In conclusion, we observed that there are apparent differences between Sp-Abs and Se-Abs in context to their characteristics and their associations with asthma. Compared to Se-Abs, Sp-Abs are more associated with clinical parameters and the severity of disease. To data, we firstly propose that targeting on Sp-Abs which are the hallmark of localized autoimmune phenomenon might help us better understand the role of autoimmunity in the pathological mechanism of asthma and pave the way for effective and novel therapy. More studies are needed to investigate Abs against airway inflammatory cells and explore their associations with asthma mechanism.
 XML Download