

 PDF
PDF ePub
ePub Citation
 Print
Print


INTRODUCTION
In previous decades, the prognosis of breast cancer has remarkably improved, particularly for the hormone receptor-positive (HR+) population, which is largely attributed to the benefit of endocrine therapy (ET) [1234]. However, the risk of death in breast cancer persists at least 15 years after diagnosis [5]. As the HR+ has been considered an unfavorable prognostic factor for late period survival [6], an extended adjuvant ET was deemed imperative for the HR+ population. However, until recently, there has been limited knowledge of the real impact of HR status on later period breast cancer-specific death (LP-BCSD) and later period non-breast cancer-specific death (LP-non-BCSD) in patients of different age groups. Due to the long-term survival period and the non-ignorable competing risks of death, the effect of LP-non-BCSD on survival should be highlighted as it might exceed the rate of LP-BCSD. Survival analyses based on absolute risk of death, which ignore LP-non-BCSD, may fail to correctly interpret the outcomes.
Therefore, our study analyzed women with resectable breast cancer who have survived ≥ 5 years, identified from the Surveillance, Epidemiology, and End Results (SEER) database, and explored the real effect of HR status on LP-BCSD and LP-non-BCSD.
METHODS
Inclusion and exclusion criteria
The invasive breast cancer cases in SEER's 18-registry database were analyzed. SEER.Stat version 8.3.2 (http://seer.cancer.gov/seerstat) was utilized to identify patients who were diagnosed with breast cancer from January 1990 to December 2007. The patients who were diagnosed after 2007 were excluded to ensure an adequate duration of follow-up. The cutoff of 1990 was selected because SEER has collected estrogen receptor (ER) and progesterone receptor (PR) data since 1990. The year and age at diagnosis, gender, ethnicity, marital status, histological type, differentiated grade, location of the tumor, T-classification, N-classification, stage TNM, administration of radiotherapy, ER, PR, survival months, and cause of death were retrieved from the SEER database. The specific inclusion criteria were as follows: 1) the site record ICD-O-3 was limited to breast (C500–506; C508–509); 2) the histological type ICD-O-3 was limited to infiltrative ductal cancer (IDC) (8500/3, 8521/3, 8523/3), infiltrative lobar cancer (ILC) (8520/3, 8524/3) or a mixture of both (IDC+ILC) (8522/3); 3) the survival time of the patients exceeded 60 months; and 4) the age at diagnosis was 20–80 years. The exclusion criteria were as follows: 1) patients who lacked documentation of ethnicity, marital status, differentiated grade, location of tumor, ER, PR, T-classification, N-classification, and administration of therapy; 2) patients with tumor of M1-classification or stage IV; 3) patients with multiple primary tumors; 4) the cause of death was unknown; or 5) bilateral primary breast cancer (for the detailed inclusion and exclusion criteria, refer to Supplementary Fig. 1).
Variable declaration
The ethnicity was classified into white, black, and others. The patients were divided into 3 groups according to age: 20–40 years, 41–60 years, 61–70 years, and 71–80 years. The marital status was classified as married, single, and divorced. The HR status was stratified into negative (ER− and PR−) and positive (ER+ and/or PR−). The tumor locations were divided as central portion, outer upper quadrant, outer lower quadrant, inner upper quadrant, inner lower quadrant, and overlapping lesion. The histological types were classified as IDC, ILC, and mixture. All cases were regrouped according to the 8th edition of the American Joint Committee on Cancer (AJCC) TNM staging system.
Statistical analysis
The LP-BCSD was set as the primary endpoint, and the LP-non-BCSD was set as the secondary endpoint. The cumulative incidence of LP-BCSD or LP-non-BCSD was estimated and compared via Gray's test [7]. When the cumulative incidence of LP-BCSD was estimated, the LP-BCSD was considered as the failure event and LP-non-BCSD as the competing event, and vice versa. Moreover, the subdistribution hazard ratio (SHR) of the variables for cause-specific death was estimated using the Fine and Gray proportional hazard model [8]. The statistical analysis was developed by rms and cmprsk package in R software (http://www.r-project.org/). A p-value < 0.05 was considered statistically significant.
RESULTS
We identified 181,108 eligible patients with breast cancer with > 5 years survival after the initial diagnosis. The final date of the follow-up was November 2013, and the median follow-up duration was 59 months (range, 0 to 227 months) (calculated from 60 months after diagnosis). In total, 13,067 (7.22%) and 16,579 patients (9.15%) died from breast cancer and other causes, respectively. The median age was 56 years (20–80 years). The 5- and 10-year LP-BCSD rates were 6.43% and 10.89%, respectively, and the 5- and 10-year LP-non-BCSD rates were 6.65% and 15.35%, respectively. The LP-non-BCSD exceeded the LP-BCSD at 115 months among the HR+ breast cancer population. The LP-non-BCSD exceeded the LP-BCSD at 144 months among the HR− breast cancer population and played a key role in all causes of death.
Patient demographics and tumor characteristics according to HR status
The age 40–60 years old was the most frequent age group in patients who have survived > 5 years with a slightly higher rate in the HR− group (57.38%) than in the HR+ group (51.84%). Compared to the HR− group, significantly more patients in the HR+ group were aged 70–80 years (17.39% vs. 10.58%, p < 0.001), white ethnicity (84.91% vs. 77.48%, p < 0.001), ILC tumors (7.46% vs. 1.17%, p < 0.001), and T1 tumors (70.25% vs. 54.62%, p < 0.001).
Regarding the differentiated grade, only 2.86% of well-differentiated tumors were identified in the HR− group, whereas 23.66% patients were diagnosed with well-differentiated tumors in the HR+ group. The percentages of patients with poorly differentiated tumors were 76.83% and 25.85% in the HR− group and HR+ group, respectively, with significant differences (p < 0.001) (Table 1).
Table 1
Characteristics of 181.108 patients with breast cancer
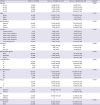
HR = hormone receptor; IDC = infiltrating duct carcinoma; ILC = infiltrating lobular carcinoma; ER = estrogen receptor; PR = prognosis receptor; AJCC = American Joint Committee on Cancer.
*p-values obtained from the χ2 test. All statistical tests were 2-sided, †Stage TNM, T, N-classification according to 8th edition of AJCC staging.
![]()
Univariate and multivariate analyses based on competing risk regression model
The univariate analysis showed that HR+ was significantly associated with more LP-BCSD (SHR, 1.18; 95% confidence interval [CI], 1.13–1.24; p < 0.001) (Figure 1). Further, multivariate analysis demonstrated that HR+ was an independent prognostic factor for more LP-BCSD (SHR, 1.54; 95% CI, 1.44–1.64; p < 0.001). The following variables were also independently associated with more LP-BCSD: young age, black ethnicity, single marital status, poorly differentiated grade, larger tumor, and lymph node involvement (Table 2). The univariate and multivariate analyses showed that old age was the strongest predictive factor for more LP-non-BCSD and that HR+ was associated with more LP-non-BCSD. Furthermore, the multivariate analysis showed that HR+ was not associated with the occurrence of LP-non-BCSD.
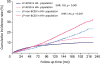 | Figure 1Cumulative incidence of LP-BCSD and LP-non-BCSD for HR+ and HR− breast cancer. HR+ breast cancer had more LP-BCSD in the whole cohort compared to HR− breast cancer (SHR, 1.18; 95% CI, 1.13–1.24; p < 0.001). Moreover, HR+ was associated with more LP-non-BCSD (SHR, 1.41; 95% CI, 1.35–1.47; p < 0.001). The risk of LP-BCSD was exceeded by that of LP-non-BCSD in the HR+ and HR− subgroups. The curves were plotted using the Gray method.LP-BCSD = later period breast cancer-specific death; LP-non-BCSD = later period non-breast cancer-specific death; HR = hormone receptor; SHR = subdistribution hazard ratio; CI = confidence index.
|
Table 2
LP-BCSD and non-LP-BCSD in univariate and multivariate analysis
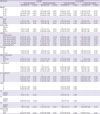
LP-BCSD = later period breast cancer-specific death; LP-non-BCSD = later period non-breast cancer-specific death; SHR = subdistribution hazard ratio; CI = confidence interval; HR = hormone receptor; IDC = infiltrating duct carcinoma; ILC = infiltrating lobular carcinoma; ER = estrogen receptor; PR = prognosis receptor; AJCC = American Joint Committee on Cancer.
*LP-BCSD and LP-non-BCSD were conducted using the Fine and Gray competing regression model, †Stage TNM, T, N-classification according to 8th edition of AJCC staging.
![]()
Stratified analysis for LP-BCSD and LP-non-BCSD according to HR status
The stratified analyses included age at diagnosis, ethnicity, differentiation, histological type, T-classification N-classification, and TNM stage. The 20–40 year-old and 40–60 year-old subgroups had 130.29% and 18.37% increased risks of LP-BCSD, respectively, in the HR+ subgroup (Figure 2). In the 70–80 year-old subgroup, the risk of LP-BCSD in the HR+ subgroup had a decreasing trend, without a statistically significant difference (Figure 3). In the low stage subgroup (including T1, N0 and stage I), the patients with HR+ tumors had less LP-BCSD (Figure 2). Regarding the LP-non-BCSD, there was no significant difference in all age subgroups (Figure 2). LP-BCSD played a key role in all causes of death in the 20–40 year-old and 40–60 year-old subgroups. LP-non-BCSD, however, played a key role in all causes of death in the 70–80 year-old subgroups. In the 60–70 year-old subgroup of the HR+ group, the LP-non-BCSD exceeded the LP-BCSD at 115 months; it exceeded the LP-BCSD at 77 months in the HR− breast cancer group and played a key role in all causes of death (Figure 3).
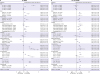 | Figure 2Forest plot of the subgroup analysis for LP-BCSD and LP-non-BCSD according to HR status. (A) The forest plot of subgroup (HR+ vs. HR−) analysis for LP-BCSD. In the low-stage subgroups (including T1, N0 and stage I), patients with HR+ tumors had less LP-BCSD. (B) The forest plot of subgroup (HR+ vs. HR−) analysis for LP-non-BCSD; there was no difference in all 4 age subgroups.LP-BCSD = later period breast cancer-specific death; LP-non-BCSD = later period non-breast cancer-specific death; HR = hormone receptor; IDC = infiltrating duct carcinoma; ILC = infiltrating lobular carcinoma; SHR = subdistribution hazard ratio; CI = confidence index.
|
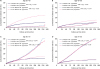 | Figure 3Impact of HR status on LP-BCSD and LP-non-BCSD by subgroup analysis according to age subgroups. (A) In the 20–40 year-old subgroup, patients with HR+ breast cancer had more LP-BCSD than patients with HR− breast cancer (SHR, 2.30; 95% CI, 2.02–2.62; p < 0.001). Moreover, the risk of LP-BCSD was higher than LP-non-BCSD in both the HR+ and HR− subgroups. (B) In the 40–60 year-old subgroup, patients with HR+ breast cancer had more LP-BCSD than patients with HR− breast cancer (SHR, 1.18; 95% CI, 1.11–1.26; p < 0.001). Moreover, the risk of LP-BCSD was higher than LP-non-BCSD in both the HR+ and HR− subgroups. (C) In the 60–70 year-old subgroup, the risk of LP-BCSD in HR+ breast cancer was similar to that of HR− breast cancer (SHR, 0.98; 95% CI, 0.88–1.09; p = 0.644). Moreover, the risk of LP-BCSD was exceeded by that of LP-non-BCSD in both the HR+ and HR− subgroups. (D) In the 70–80 year-old subgroup, the risk of LP-BCSD in the HR+ subgroup has a decreasing trend compared to that of the HR− subgroup, without a statistically significant difference (SHR, 0.93; 95% CI, 0.81–1.05; p = 0.241). The risk of LP-BCSD had been exceeded by LP-non-BCSD in both the HR+ and HR− subgroups at the beginning of follow up.LP-BCSD = later period breast cancer-specific death; LP-non-BCSD = later period non-breast cancer-specific death; HR = hormone receptor; SHR = subdistribution hazard ratio; CI = confidence index.
|
Impact of HR status on LP-BCSD and LP-non-BCSD adjusted for age
The SHR for LP-BCSD of HR+ was 1.24 (95% CI, 1.18–1.30) in the presence of age adjustment, which was significantly different (p < 0.001). However, the SHR for LP-non-BCSD of HR+ was 0.99 (95% CI, 0.95–1.04), without statistical significance (p = 0.688). Thus, only the factor of age, rather than HR status, was good predictors of increased LP-non-BCSD.
DISCUSSION
Patients with resectable breast cancer who have survived for > 5 years after diagnosis remain at a considerable risk of death. The probability of LP-non-BCSD has exceeded LP-BCSD, particularly in old women. Moreover, we found that LP-non-BCSD exceeded LP-BCSD in the 10-year cumulative incidence at 64 years old. We found that the HR+ LP-BCSD exceeded HR− LP-BCSD at 115 months. HR+ was proven to be a risk factor of LP-BCSD in young women (≤ 60 years old), rather than in old women. LP-BCSD played a key role in all causes of death in the 20–40 year-old and 40-60 year-old subgroups. LP-non-BCSD played a key role in all causes of death in the 70–80 year-old subgroup. In the 60–70 year-old subgroup of the HR+ group, the LP-non-BCSD exceeded the LP-BCSD at 115 months. The LP-non-BCSD exceeded the LP-BCSD at 77 months in the HR− breast cancer group and played a key role in all causes of death. The association between HR+ and LP-non-BCSD was eliminated after adjusting for age. HR+ was proven to be associated with a higher risk of LP-non-BCSD due to the multicollinearity observed between the covariates of HR and age.
In our previous study, when BCSD was considered as the primary endpoint, the BCSD curve for HR+ and HR− groups crossed only in young women (age ≤ 60 or premenopausal women) rather than in old women (age > 60 or postmenopausal women) [9]. This finding demonstrated that the risk of death for postmenopausal HR+ patients was no longer higher than that of HR− patients at > 5 years since the initial diagnosis. Our findings were further confirmed in the subgroup analyses. Four previous clinical trials indicated that extended adjuvant ET could improve disease-free survival (DFS). Only postmenopausal women were enrolled in the previously described trials. Based on our results, HR+ status was related to more LP-BCSD in young women, rather than in the old women. Therefore, we have reason to question whether the extended adjuvant ET could really provide more benefits to premenopausal women. Several previous studies have shown that the poor outcomes in premenopausal women with ET was mainly due to primary endocrine therapy resistance [1011]. Survival benefits of extended tamoxifen administration for young women have been demonstrated by subgroup analysis [12].
Ignoring the impact of non-BCSD would confuse the interpretation of the benefits of extended adjuvant ET trials. The randomized controlled trials of MA.17R indicated a significant reduction of DFS events (91% vs. 95%; SHR, 0.66; 95% CI, 0.48–0.91; p = 0.01) [13]. However, a similar study (NSABP B-42) showed that extended ET could only improve DFS from 81.3% to 84.7%, while it failed to meet its primary endpoint-DFS, with p = 0.048 (p < 0.0418 was prospectively set as the significance level) [14]. Moreover, carefully considering the differences between MA.17R and NSABP B-42, the DFS was defined as survival without recurrence, second primary cancer, and new breast cancer events in MA.17R [13], while it was defined as survival without recurrence, second primary cancer, new breast cancer events, and non-BCSD in NSABP B-42 [15]. Thus, the non-BCSD occurrence was considered in NSABP B-42 and not in MA.17R. The efficacy of extended adjuvant endocrine therapy would be diluted by non-BCSD in NSABP B-42, which partly explained the different outcomes. It has been argued that trials of ET should censor non-BCSD in primary analyses. Based on our finding, not only should the definition of the primary endpoint be altered to include BCSD but also the sample size estimation should consider non-BCSD [16].
HR+ was proven to be associated with a higher risk of LP-non-BCSD through age. The question arises as to whether ET will result in more non-BCSD? A meta-analysis demonstrated that the toxicities of ET were associated with more non-BCSD [17]. However, in a similar study, favorable DFS was demonstrated to correlate with endocrine treatment-related symptoms. In our analysis, HR+ was no longer related to more LP-non-BCSD based on the subgroup analysis and analysis for age adjustment. A recent study, which used the National Cancer Data Base indicated that the administration of ET among HR+ cancer patients increased to 82.4% in 2013, which changed by 1.51% per year. In patients with HR− cancer, the ET administration decreased to 3.4%, which was an 0.17% annual reduction [18]. Another study, which used the SEER-Medicare data showed that the use of ET was approximately 10% underreported because outpatient therapy is not always reported in hospital records [19]. Therefore, to a large extent, the association between HR+ and LP-non-BCSD that was identified in the current study supported that ET was not associated with LP-non-BCSD in the real-world.
Previous studies have identified factors that are related to the potential risks for the late recurrence of breast cancer. A study identified that HR+ and HER2− patients have a higher risk of recurrence at > 5 years, particularly in patients with a high ER titer [20]. Another study found that PR positivity and lymph node metastases were significantly correlated to late recurrence [21]. In the present study, patients who were young; of black ethnicity, single, and had poorly differentiated grade, large tumors; and had lymph node involvement were also independently associated with more LP-BCSD. Recently, molecular assay studies, such as 12-gene EndoPredict, Breast Cancer Index, or 50 gene PAM50 ROR, were built to predict the risk of late recurrence. However, these multiparameter assays are also limited by availability and cost [20]. Risk factors based on clinicopathological parameters remain the key to clinical decision-making in our practice.
Different schedules of treatment, including the use of upfront aromatase inhibitors (AIs) or sequential use of tamoxifen and AIs, are known for their drug-specific side effects. Tamoxifen is associated with increased risks of uterine cancer and thromboembolism [22]. AIs have a different safety profile that are predominantly predictable consequences of estrogen deprivation, such as musculoskeletal events, bone loss. and cardiovascular events. Seven trials that comprised 16,349 patients analyzed the reported toxicity of extended endocrine treatment with AIs. Longer treatment with AIs was associated with increased risks of cardiovascular events, bone fractures, and cessation of treatment due to adverse events. Extended use of AIs did not influence the risk of a second malignancy; however, a numerical excess in deaths without breast cancer recurrence was found with extended AI therapy [23]. Previous studies have investigated the correlation between treatment efficacy and adverse events that were caused by endocrine therapy; however, the results were inconsistent across trials.
Our study may have several potential limitations. Some biases were inevitable due to the retrospective nature of the study. Moreover, the HER2 status and Ki-67 were not available in SEER prior to the year 2010, partly due to the lack of attention paid to molecular biology in earlier years. There is no record of adjuvant ET in the SEER data, which is recognized as an important variable in our study. The SEER data does not provide information regarding the recurrence and metastasis of the disease, and the inclusion of patients who have survived for > 5 years and then exhibit signs of recurrence and metastasis will result in bias. We would urge caution and not advocate guiding clinical decision making based on our findings.
In conclusion, HR+ was associated with more LP-BCSD in the young population. Prospective studies should be carried out to explore the efficacy of extended adjuvant ET in young patients. As for older patients, more efforts should be devoted to reducing the risk of non-BCSD and encouraging healthy lifestyles, and extended ET should be cautiously recommended. Moreover, in further clinical trials, BCSD may be an alternative endpoint instead of overall survival.
 XML Download