

 PDF
PDF Citation
 Print
Print


INTRODUCTION
Assessment and quantification of the population health scenarios expected to occur in the future provide information on probable trends in health and enable setting of priorities for healthcare and public health policies. This is particularly important for Korea, which is currently undergoing a major epidemiologic and demographic transition; the Korean population has aged more rapidly than those of other developed countries, and Korea is expected to be a super-aged society by 2026.1 Comprehensive assessments of current burden of disease in Korea have been conducted.23 However, little effort has focused on projections of disease-specific mortality and the burden of disease for the entire disease spectrum at the national level.
At the global level, projections for a complete set of causes were conducted as part of the Global Burden of Disease (GBD) study.45 The GBD projections used a structural model based on relationships between mortality and projected changes in key system components. However, the structural model requires considerable knowledge of the important system components and the relationships among them. In addition, when the system is complex and highly sensitive to its components, the structural model provides less reliable estimates. In contrast, aggregate models are based on the assumption that previous trends will continue into the future. This method requires good mortality and morbidity registration data.
We prepared projections of mortality and burden of disease from 2016 to 2030 by developing separate age-, sex-, and cause-specific projection models using coherent functional data models and time-series methods based on the trends from 2002 to 2015.
METHODS
Data source
To estimate the mortality rates from 2002 to 2015 and to project future mortality rates from 2016 to 2030 of diseases and injuries in the entire Korean population, the 2002–2015 Causes of Death Statistics and database of residents registered with the Ministry of Interior, the 2016–2030 projected population, and the 2002–2030 Life Expectancy Table from Statistics Korea were used.6 To estimate the prevalence and incidence rates of the selected causes in 2015, we used National Health Insurance Service claims data for 2015, the 2015 National Cancer Registration and Statistics from the Korea Central Cancer Registry, and the 2015 Korea National Hospital Discharge Injury Surveillance data from the Korea Centers for Disease Control and Prevention.
Case definitions
In total, 260 mutually exclusive diseases and injuries were classified into the following 21 cause clusters: 1) human immunodeficiency virus/acquired immune deficiency syndrome (HIV/AIDS) and tuberculosis; 2) diarrhea, lower respiratory infections, meningitis, and other common infectious diseases; 3) neglected tropical diseases and malaria; 4) maternal disorders; 5) neonatal disorders; 6) nutritional deficiencies; 7) other communicable, maternal, neonatal, and nutritional disorders; 8) neoplasms; 9) cardiovascular and circulatory diseases; 10) chronic respiratory diseases; 11) cirrhosis of the liver; 12) digestive diseases except cirrhosis; 13) neurological disorders; 14) mental and behavioral disorders; 15) diabetes, urogenital, blood, and endocrine diseases; 16) musculoskeletal disorders; 17) other non-communicable diseases (NCDs); 18) transport injuries; 19) unintentional injuries other than transport injuries; 20) self-harm and interpersonal violence; and 21) forces of nature, war, and legal intervention. These 21 cause clusters were further grouped into three broad cause groups: 1) communicable, maternal, neonatal, and nutritional conditions (CMNNs); 2) NCDs; and 3) injuries. Detailed information on the definition of cause of death and epidemiologic parameters is available.3
Mortality projection methods
We used these 21 cause clusters to estimate mortality rates from 2002 to 2015 for both sexes and eighteen 5-year age groups (0–4, 5–9, 10–14, 15–19, 20–24, 25–29, 30–34, 35–39, 40–44, 45–49, 50–54, 55–59, 60–64, 65–69, 70–74, 75–79, 80–84, and ≥ 85 years). For analysis of maternal, neonatal, and childhood behavioral disorders, age restriction was applied depending on the characteristics of the diseases. Only females 10–59 years of age were included for maternal disorders, children 0–9 years of age for infant disorders, newborns 0–1 years of age for sepsis and other infectious disorders of newborns, and children under 20 years of age for childhood behavioral disorders.
To forecast mortality rates from 2016 to 2030, we developed coherent functional time-series models for each age-sex group for the 21 cause-of-death clusters using the demography package in R software (version 3.4.4; R Foundation, Vienna, Austria). This model uses smoothed historical mortality data, and we used the mortality rates for the years 2002–2015 as the basis for the projection of mortality rates. The past mortality rates were calculated by the ratio between the number of deaths and mid-year population. The square roots of the products and ratios of the smoothed rates for each sex were modeled using functional time series models.7 The projected number of deaths was generated by applying the projected population to the projected mortality rate.
Calculation of years of life lost (YLLs), years lived with disability (YLDs), and disability-adjusted life years (DALYs)
Details of the methods for estimating YLLs, YLDs, and DALYs are provided elsewhere.89 The cause-specific YLLs for 2015 were computed by multiplying the number of deaths for each cause cluster by the residual expected life expectancy at the age of death. We used a 4% age weighting and 3% time discount rate. The YLDs for 2015 were calculated by multiplying the number of incident cases by the average duration of a case and the disability weight of the disease. To calculate the age at onset and disease duration, we used DisMod-II software (EpiGear, Noosa, Australia) with appropriate input parameters, including the incidence rate, prevalence rate, mortality rate, and fatality rate. Detailed information on the disability weights used in this study is available.10 The DALY was the sum of YLL and YLD.
YLLs from 2016 to 2030 were calculated based on the projected mortality by cause, age, and sex. YLD projections were derived from the YLL projections by applying the ratio of YLDs to YLLs for 2015 with the assumption that these ratios would be constant from 2015 to 2030, as estimated in the original GBD projections.4 For causes for which there was no mortality, the 2015 YLD rates per capita were assumed to remain constant until 2030. We used the projected population to calculate age-standardized YLL, YLD, and DALY rates per capita. All the analysis was done by age-, and sex-specific models.
RESULTS
Overall, the number of deaths is projected to increase from 275,777 in 2015 to 421,700 in 2030; and the age-standardized death rate (ASDR) is projected to decrease from 586.9 in 2015 to 447.3 in 2030. NCDs are projected to account for approximately 80% of all deaths in 2030. In contrast, injuries and CMNNs will account for 13.7% and 5.9%, respectively, of the total deaths in 2030.
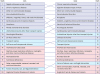
Table 1 summarizes the projected number of deaths and ASDRs for the 21 cause clusters in 2030 by sex in comparison with those in 2015, as well as the percentage changes in ASDRs for 2015–2030. The five leading causes of death are projected to be NCDs. The largest number of deaths is projected to be caused by neoplasms (75,758 deaths for males; 44,660 deaths for females), followed by cardiovascular and circulatory diseases (34,795 deaths for males; 48,553 deaths for females); these were also the leading causes of death in 2015. Although the ASDRs for both are projected to decline from 2015 to 2030, the number of deaths from those causes is projected to increase, likely due to population growth and/or aging. For injuries, the rank orders of the causes drop or are unchanged from those in 2015. Unintentional injuries and self-harm and interpersonal violence are projected to account for almost 90% of the injury-related deaths in 2030. Generally, CMNNs had the lowest rank orders in both 2015 and 2030, with the exceptions of diarrhea, lower respiratory infections, meningitis, and other common infectious diseases (ninth for males and seventh for females in 2030) and HIV/AIDS (11th for both males and females in 2030), each of which is projected to move up one place in the rankings.
Table 1
Projected mortality for selected 21 causes in 2030 in comparison to mortality in 2015
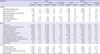
ASDR = age-standardized death rate, ds = diseases, N/A = not applicable, CMNN = communicable, maternal, neonatal, and nutritional condition, HIV/AIDS = human immunodeficiency virus/acquired immune deficiency syndrome, NCD = non-communicable disease, DM = diabetes mellitus.
aDiarrhea, lower respiratory infections, meningitis, and other common infectious diseases; bUnintentional injuries other than transport injuries; cForces of natures, war, and legal intervention.
![]()
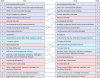
The estimates of YLL per 100,000 population for 2015 and 2030 and the changes in rank order by sex are shown in Table 2. Neoplasms were the leading cause of YLL for both sexes in 2015 and is projected to remain so in 2030. For males, self-harm and interpersonal violence is projected to move up one place in the rankings to be the second leading cause of YLL. Cardiovascular and circulatory diseases is projected to move down one place in the rankings and be the third leading cause of YLL. For females, the ranking of cardiovascular and circulatory diseases is projected to remain unchanged as the second leading cause of YLL, and neurological disorders is projected to move up three places to be the third leading cause of YLL. In general, there is projected to be little or no change in the YLL rankings between 2015 and 2030, while chronic respiratory diseases is projected to move up four places for males, neurological disorders is projected to move up three places for females, and transport injuries is projected to move down three places for males and four places for females.
Table 2
Projected YLLs and changes in rankings for selected 21 causes for 2015 and 2030
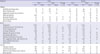
YLL = years of life lost, CMNN = communicable, maternal, neonatal, and nutritional condition, HIV/AIDS = human immunodeficiency virus/acquired immune deficiency syndrome, ds = diseases, N/A = not applicable, NCD = non-communicable disease, DM = diabetes mellitus.
aYLLs per 100,000 population; bDiarrhea, lower respiratory infections, meningitis, and other common infectious diseases; cUnintentional injuries other than transport injuries; dForces of natures, war, and legal intervention.
![]()
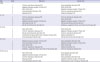
Table 3 summarizes the changes of YLDs and DALYs per 100,000 population for the 21 cause clusters from 2015 to 2030 by sex. For males, the leading cause of YLD in 2015 was digestive diseases except cirrhosis, followed by chronic respiratory diseases and other NCDs, while the leading cause of YLD in 2030 was chronic respiratory diseases followed by other NCDs and digestive diseases except cirrhosis. For females, the largest number of YLD per 100,000 in 2015 was caused by musculoskeletal disorders, followed by diabetes mellitus (DM), urogenital, blood, and endocrine diseases, and other NCDs. The top leading causes of YLD were unchanged in 2030. Other NCDs and digestive diseases except cirrhosis were projected to be second and third in the rankings, respectively, while DM, urogenital, blood, and endocrine diseases is projected to move down five places to be seventh in the rankings.
Table 3
Projected YLDs and DALYs for selected 21 causes for 2015 and 2030
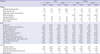
YLD = years lived with disability, DALY = disability-adjusted life year, CMNN = communicable, maternal, neonatal, and nutritional condition, HIV/AIDS = human immunodeficiency virus/acquired immune deficiency syndrome, ds = diseases, N/A = not applicable, NCD = non-communicable disease, DM = diabetes mellitus.
aYLDs per 100,000 population; bDALYs per 100,000 population; cDiarrhea, lower respiratory infections, meningitis, and other common infectious diseases; dUnintentional injuries other than transport injuries; eForces of natures, war, and legal intervention.
![]()
DALYs are projected to increase from 26,799,184 in 2015 to 30,685,593 in 2030, an increase of 14.5%. During the same period, the population is projected to increase by 3.9%. NCDs are projected to account for 90% of the total DALYs and to represent a leading burden of disease, while CMNNs and injuries are projected to account for 5% each. The three leading causes of DALYs for both sexes are projected to be chronic respiratory diseases, musculoskeletal disorders, and other NCDs.
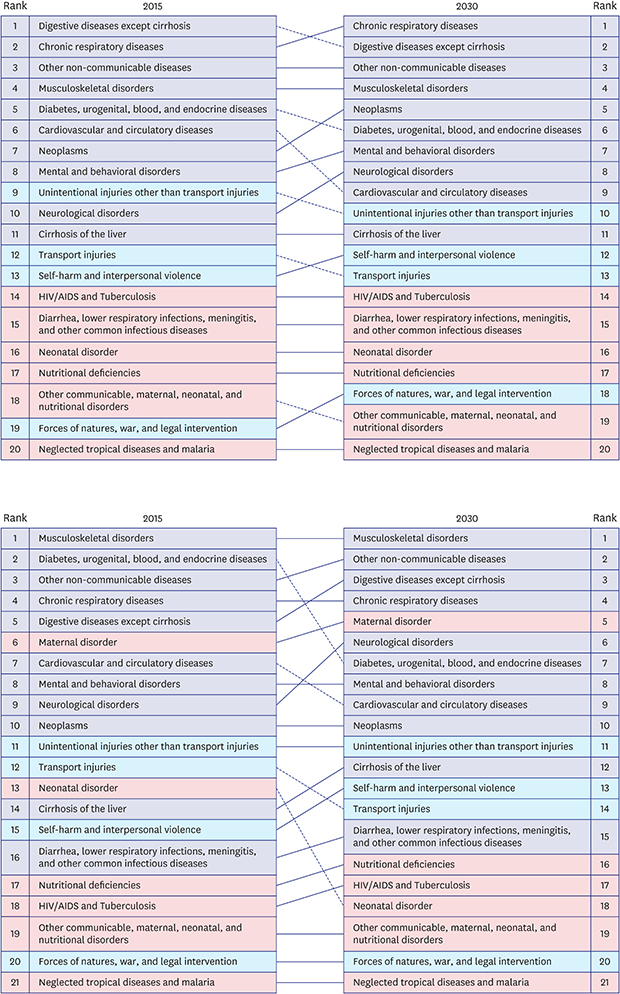
Figs. 1 and 2 show the rank orders of DALYs in 2015 and 2030 by sex. The three leading causes of DALY are projected to be chronic respiratory diseases, digestive diseases except cirrhosis, and other NCDs for males; and musculoskeletal disorders, other NCDs, and digestive diseases except cirrhosis for females. Overall, NCDs are ranked highly and CMNNs are ranked lowly. Generally, there was little or no change in the DALY rankings between 2015 and 2030, while cardiovascular and circulatory diseases is projected to move down three places for males, neurological disorders is projected to move up three places for females, and both DM, urogenital, blood, and endocrine disorders and neonatal disorders are projected to move down five places for females.
 | Fig. 1Change in rank order of DALYs between 2015 and 2030 for the 21 selected causes in male.DALY = disability-adjusted life year, HIV/AIDS = human immunodeficiency virus/acquired immune deficiency syndrome.
|
 | Fig. 2Change in rank order of DALYs between 2015 and 2030 for the 21 selected causes in female.DALY = disability-adjusted life year, HIV/AIDS = human immunodeficiency virus/acquired immune deficiency syndrome.
|
Table 4 lists the five leading causes of DALYs in 2030 by age group. Chronic respiratory disease is projected to be an important cause of DALYs in all age groups. Mental and behavioral disorders as well as unintentional injuries other than transport injuries are projected to be the major causes of DALYs for males in the 10–19 years age group, and maternal disorders is projected to be the major cause of DALYs for females of childbearing age. Musculoskeletal disorders are projected to be ranked highly in the 20–64 years age group, and neoplasms for males and neurological disorders for females are the leading causes of DALY in the > 65 years age group.
Table 4
Ranking for 5 leading disease groups of DALYsa by sex and age group in 2030
The value in parentheses are percentages of the DALY of the disease among the total DALY by sex and age group.
DALY = disability-adjusted life year, NCD = non-communicable disease.
aDALYs per 100,000 population.
![]()
DISCUSSION
We performed projections of the number of deaths and burden of disease from 2016 to 2030 by 21 cause clusters, age, and sex. The number of deaths is projected to increase, and the ASDRs are projected to decrease, from 2015 and 2030. By 2030, the largest number of deaths is projected to be caused by neoplasms and cardiovascular and circulatory diseases. There is no substantial change in the patterns of DALYs between 2015 and 2030. In 2030, the three leading causes of DALY will be chronic respiratory diseases, musculoskeletal disorders, and other NCDs. The proportions of deaths and DALYs due to NCDs were projected to be 82% and 90%, respectively.
The projected trends of deaths and DALYs can be attributed in part to population growth and demographic transition in addition to improvements in medical care and health policy. According to the population projections reported by Statistics Korea, the proportion of the population aged 0–14 years is projected to decrease from 13.8% in 2015 to 11.5% in 2030, the proportion of the population of working age is projected to decrease from 73.4% in 2015 to 64.0% in 2030, and the proportion of the population ≥ 65 years is projected to increase from 12.8% in 2015 to 24.5% in 2030.1
According to the GBD projection, the three leading causes of burden of disease worldwide in 2030 will be HIV/AIDS, depression, and ischemic heart disease, and those in high-income countries will be depression, ischemic heart disease, and dementias. Comparing the GBD projection with our results is difficult because the GBD study performed projections for 132 detailed causes, whereas we conducted projections for 21 cause-clusters. However, the future disease burden in Korea is in accordance with that in high-income countries in the GBD projection, in that NCDs will account for the majority.
To the best of our knowledge, this is the first study to predict cause-specific mortality and DALYs for a comprehensive set of causes in Korea; therefore, comparisons with previous studies are impossible. Our projections for all-cause mortality are similar to those by Statistics Korea, despite our use of the sum of the projections for 21 cause clusters compared to past trends in all-cause mortality by Statistics Korea. The projected total number of deaths in 2030 is 421,700 (227,036 for males; 194,664 for females) and that by Statistics Korea is 423,000 (222,000 for males; 201,000 for females).
The GBD projection used a methodology based on the assumption of a relationship between cause-specific mortality rates and a set of socioeconomic variables. The GBD study considered a limited number of socioeconomic variables — including average income per capita, the average number of years of schooling in adults, and time — to capture the impact of technological change on health status. In addition, tobacco use was included in the projections for cancers, cardiovascular diseases, and chronic respiratory diseases.5
We applied coherent functional data models to forecast cause-, age-, and sex-specific mortality in Korea from 2016 to 2030. The coherent functional data model is a variant of the Lee–Carter model, which extrapolates historical trends and forecasts the probability distributions of age-specific death rates using a statistical time-series method.11 The time-series method presupposes that the historical trend will continue into the future, and is regarded to be superior to structural modeling using exogenous variables for forecasting.12 The coherent functional data model is a product-ratio method based on forecasting of the simple product function (the geometric mean of subpopulation death rates) and the ratio function (ratios of the subpopulation death rates to the geometric mean rates).7 In this paradigm, coherence is imposed and the forecasts of cause-specific mortality for the two sexes maintain certain structural relationships without continuing to diverge.7131415
This study had limitations that should be considered. The forecasting is based on the assumption that past trends would be reflected in future trends, and unpredictable future occurrences are not considered.15 In addition, we assumed that the YLD to YLL ratio in 2015 would remain unchanged in the future. However, the YLD to YLL ratio can increase if the mortality rate decreases or decrease if the disease burden decreases due to improvements in medical technologies and health interventions.
To the best of our knowledge, this is the first projection of the future burden of a comprehensive set of diseases in Korea. Our results will facilitate establishment of appropriate health interventions to reduce the burdens imposed by various diseases.
 XML Download