

 PDF
PDF Citation
 Print
Print


INTRODUCTION
There are several methods for calculating the burden of a specific disease. Population health can be presented with epidemiological parameters, such as prevalence, incidence, or mortality. Additional health-related indicators, such as disability-adjusted life years (DALY) and socioeconomic costs of illness, can also be measured.1 Cost of illness studies can quantitatively assess the socioeconomic costs incurred by a disease, providing the maximum costs that could potentially be reduced if the disease is prevented.2 Thus, such studies serve the important purpose of providing evidence for the logical allocation of limited resources during various decision-making processes in the healthcare sector. Owing to such benefits, several countries have estimated economic disease burden at the national level; for instance, since the first report in 1986, Canada recently estimated its economic burden of disease in the period of 2005–2008.3
All residents of Korea are enrolled in a single National Health Insurance System.4 According to the national health insurance statistical yearbook, total medical costs increased from USD 14.8 billion in 2005 to USD 51.4 billion in 2015, a total cost that was a 6.4% increase from the previous year's estimate.56 Population estimates provided by Statistics Korea indicated that 12.8% of the Korean population were elderly (aged 65 years or older) in 2015, and this proportion is expected to increase by 2.8 times by 2065.7 Furthermore, the super-aged population (older than 85 years) is predicted to rise from 1% in 2015 to 11.7% in 2065.7 This continued aging of the Korean population is expected to increase the prevalence of chronic diseases and the subsequent risk of disability, thereby also elevating the socioeconomic burden of disease. In addition to chronic diseases, acute and novel infectious diseases are also important health problems. For example, the 2009 influenza H1N1 pandemic resulted in an estimated USD 1.1 billion economic burden of disease. Thus, there is a need to understand how these emerging infectious disease epidemics affect socioeconomic burden.
Despite the importance of measuring the socioeconomic burden, previous Korean studies attempting to estimate socioeconomic burden have generally been conducted for a single disease or group of diseases.8910 For example, in 2009, one study computed economic burden caused by cancers.11 In 2015, the National Health Insurance Service (NHIS) exceptionally estimated the socioeconomic costs of all diseases, but that report applied a broad definition of disease prevalence, in which individuals who visited a healthcare facility once were defined as patients regardless of whether they received outpatient or inpatient services.12
Methods for estimating economic burden vary widely between studies. Some studies include only medical costs in the estimation, while other methods utilize the friction cost method or the human resource approach when computing indirect costs. Thus, the outcomes of economic burden of disease estimations may differ between studies by twofold or even over tenfold the cost; due to these differences in methodology, it is difficult to directly compare economic burden of results for each disease across different studies.13
Therefore, there is a need to use a standard methodology to estimate Korea's socioeconomic burden of overall diseases caused by illnesses and injuries. Such a standardized approach is essential for accurately comparing and analyzing burdens of different conditions. For this purpose, this study aimed to compute the socioeconomic disease burden of 238 diseases and 22 injuries in 2015, using a single methodology, from a social perspective.891011
METHODS
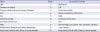
In this study, economic burden was computed using the human resource approach, from a social perspective, and direct and indirect costs were calculated. Direct costs were divided into medical and nonmedical costs. Medical costs included costs incurred by hospital admission, outpatient visits, and the use of medications, while nonmedical costs included costs of transportation and caregiver fees. Indirect costs were also calculated; these refer to costs incurred by productivity losses, either from the use of healthcare services or by premature death. Data sources used to estimate direct and indirect costs (Table 1) are as follows.
Table 1
Economic disease burden variables and data sources
![]()
First, medical costs were computed using the 2015 health insurance claims data from the NHIS.14 Medical costs for each of the 238 diseases were calculated based on the definitions of prevalence for each disease. As determined by a literature review and expert consultation, patients for each disease were defined as those who were hospitalized for the major illness at least once or were treated as an outpatient at least 1–5 times.8910
Nonmedical costs (transportation and caregiver fees) were computed using data for each disease (infectious, chronic, maternal, psychiatric, and injuries) in the 2015 Korean Health Panel Study database.15 For caregiver fees, patients under the age of 19 and those above the age of 70 at the time of outpatient visit were considered to have a caregiver.
Productivity losses caused by developing a disease were computed by multiplying the average daily wage for each age group by the number of days of hospital stays or outpatient visits. The day of hospitalization was defined as whole day, while an outpatient visit was considered as 1/3 of a day. Productivity losses caused by premature death were computed by estimating the number of deaths from the cause of death database using the garbage code algorithm.16 For calculating productivity losses, individuals up to the age of 88 years were considered economically active, with a 3% discount rate applied to the employment rate of each gender and age group.12 The rationale for determining the age of 88 as the cut-off age for being considered economically active was based on recent criticism of defining the productive population as those younger than 65 or 69 years old.17 In this study, in cases when the patient was over 70 years old, we applied aging research panel data, which presents the average wage and employment rate of Korean individuals who are over 70 years old.18
Maternal diseases (maternal hemorrhage, maternal sepsis, hypertensive disorders of pregnancy, obstructed labor, abortion) were applied only to individuals aged 10–59 years. Preterm birth complications and neonatal encephalopathy were applied to individuals aged 0–9 years. Sepsis and other infectious disorders of newborn babies were applied to infants aged 0–1 years, and sudden infant death syndrome was applied only to < 1 years old. Furthermore, conduct disorder and attention-deficit hyperactivity disorder were applied only to individuals under the age of 19.8910
For injuries, Korean national hospital discharge in-depth injury survey data were used to compute disease burden for each cause of injury.19 This database provides information on the percentages of injury types (S-code, T-code) by cause of injury (V-code, X-code, Y-code), so after estimating patient percentages, that percentage was applied to the disease code (S-code, T-code) in the health insurance claims data to estimate the final disease burden for each cause of injury.
Economic burden was calculated with the following equations:

Non-medical cost = ∑ij∑(IVij × ITC)+(OVij × OTC)+(IDij × CG)+(OVij × CG × 1/3)-∑j∑69i=20(OVij × CG × 1/3) ,
,
,where IPC = inpatient insured cost, UC = un-insured cost, OPC = outpatient insured cost, PHC = pharmaceutical cost, IV = inpatient visit, ITC = inpatient transportation cost, OV = outpatient visit, OTC = outpatient transportation cost, ID = inpatient duration, CG = caregiver cost, and

 ),
),where ID = inpatient duration, IC = average daily income, OV = outpatient visit, N = number of death, and
Economic burden was presented as US dollars using the 2015 currency exchange rate (USD 1 = 1,131.52 KRW).7 Additionally, discount rates of 0% and 5% were applied for sensitivity analysis.
All statistical analyses were performed using the SAS 9.4 version software (SAS Inc., Cary, NC, USA).
RESULTS
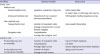
In 2015, the socioeconomic disease burden is estimated to be USD 133.7 billion (direct costs, USD 65.5 billion; indirect costs, USD 68.2 billion). The total cost of non-communicable diseases was USD 92.3 billion (69.1%; direct costs, USD 47.5 billion; indirect costs, USD 44.4 billion), injuries was USD 25.4 billion (19.0%; direct costs, USD 5.9 billion; indirect costs, USD 19.5 billion), and communicable diseases was USD 16.0 billion (11.9%; direct costs, USD 11.6 billion; indirect costs, USD 4.4 billion) (Fig. 1).
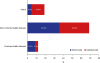
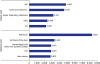
The top 20 diseases with highest cost are shown in Fig. 2. Self-harm incurred the greatest cost (USD 8.3 billion), followed by low back pain (LBP, USD 6.6 billion), acute bronchitis (USD 5.6 billion), falls (USD 4.3 billion), and upper respiratory tract infections (URI, USD 4.1 billion).
 | Fig. 2Ranking of total cost for diseases in 2015 (million USD).LBP = low back pain, IHD = ischemic heart disease, DM = diabetes mellitus, OA = osteoarthritis.
|
Among direct costs, those incurred by LBP were the highest (USD 4.9 billion), followed by acute bronchitis (USD 4.6 billion), URI (USD 3.2 billion), falls (USD 2.4 billion), and osteoarthritis (OA) (USD 2.2 billion). Among indirect costs, those incurred by self-harm were the highest (USD 8.3 billion), followed by cirrhosis of the liver (USD 3.3 billion), hemorrhagic and other non-ischemic stroke (USD 2.9 billion), ischemic heart disease (IHD, USD 2.9 billion), and liver cancer (USD 2.8 billion) (Fig. 3).
 | Fig. 3Ranking of direct and indirect cost for diseases in 2015 (million USD).LBP = low back pain, OA = osteoarthritis, IHD = ischemic heart disease.
|
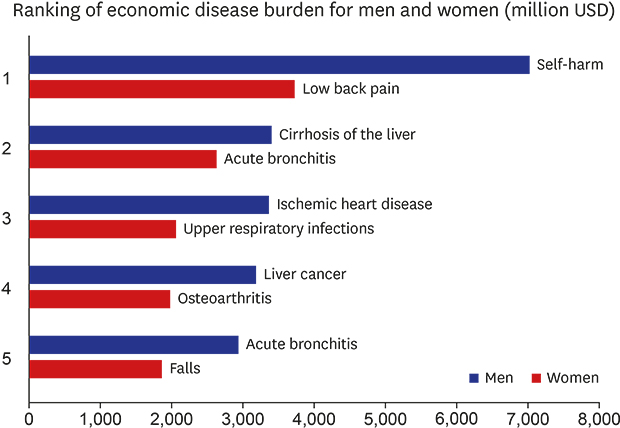
The economic burden for men and women were USD 83.8 billion and USD 49.9 billion, respectively. For men, self-harm was the leading cause (USD 7.1 billion), followed by cirrhosis of the liver (USD 3.4 billion), IHD (USD 3.4 billion), liver cancer (USD 3.2 billion), and acute bronchitis (USD 2.9 billion). For women, LBP was the leading cause (USD 3.7 billion), followed by acute bronchitis (USD 2.6 billion), URI (USD 2.1 billion), OA (USD 2.0 billion), and falls (USD 1.9 billion) (Table 2).
Table 2
Economic disease burden for men and women
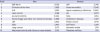
Costs are presented in million USD.
LBP = low back pain, IHD = ischemic heart disease, OA = osteoarthritis.
![]()
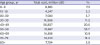
Socioeconomic costs incurred by the 50s age group accounted for 23.7% of the total costs, followed by those of the 40s group (20.0%), 70s group (12.3%), and 30s group (11.2%) (Table 3).
Table 3
Total socioeconomic costs of disease by age
| Age group, yr | Total cost, million USD | % |
|---|---|---|
| 0–9 | 9,625 | 7.2 |
| 10–19 | 4,347 | 3.3 |
| 20–29 | 7,580 | 5.7 |
| 30–39 | 14,986 | 11.2 |
| 40–49 | 26,807 | 20.0 |
| 50–59 | 31,667 | 23.7 |
| 60–69 | 14,586 | 10.9 |
| 70–79 | 16,410 | 12.3 |
| 80+ | 7,704 | 5.8 |
![]()
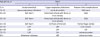
For children aged 0–9 years, the socioeconomic costs caused by acute bronchitis were the highest, followed by URI and preterm birth. URI was also the leading cost in the 10–19 years group, followed by acute bronchitis and self-harm. Self-harm was the leading cost for people in their 20s to 40s, while LBP was the leading cost in for people in their 50s to 70s. Dementia was the leading socioeconomic cost in people above age 80 (Table 4).
Table 4
Top three socioeconomic costs for specific age ranges
![]()
DISCUSSION
In 2015, the total socioeconomic disease burden in Korea was an estimated USD 133.7 billion and 9.7% of gross domestic product (GDP); of this, USD 65.5 billion and USD 68.2 billion were attributed to direct and indirect costs, respectively. Non-communicable diseases accounted for the majority (69.1%), with cancers accounting for 15% of the overall disease burden. Among individual diseases, self-harm incurred the highest costs, followed by LBP and acute bronchitis. The top 30 diseases accounted for 56.6% of the total socioeconomic disease burden. Costs incurred by the 50s age group (23.7%) were the highest, followed by those of the 40s and 70s groups. According to Yoon et al.,20 the socioeconomic costs in 2012 were 111 trillion won (8.1% of GDP), with self-harm ranking as the leading cause of burden. Our findings show that self-harm still poses a great economic burden.
Men accounted for 61% of the economic disease burden, while women accounted for 39%. The top-ranking diseases differed between men and women; among men, the leading cost was attributed to self-harm, while the leading cost in women was LBP. In terms of age groups, the disease burden from infectious diseases such as acute bronchitis and URI was the highest in individuals under the age of 19, while that from self-harm was the highest among individuals in their 20s to 40s. The disease burden from LBP was the highest in individuals in their 50s to 70s, while that from dementia was highest in the elderly above the age of 80. These findings indicate that a high percentage of the total socioeconomic disease burden in Korea is due to chronic diseases, such as cancer and cardiovascular diseases. However, infectious diseases, injuries (in particular, self-harm), and LBP are high in specific age groups, which emphasizes a need for social interventions to manage and prevent disease risk factors that are specific to each age group. In addition, in terms of indirect costs, self-harm was the leading condition, followed by liver cirrhosis, hemorrhagic and other non-ischemic stroke, IHD, and liver cancer; most of these conditions are preventable, underscoring the importance of measures to manage unnecessary productivity losses.
An NHIS report estimated the socioeconomic disease burden to be 133 billion dollars (148 trillion won) in 2015, with 79 billion dollars (88 trillion won) of direct costs and 53 billion dollars (59 trillion won) of indirect costs. For men, socioeconomic costs incurred by unknown external causes were the highest, followed by dental disability, liver cancer, schizophrenia, and diabetes mellitus (DM). For women, the leading cost was dental disability, followed by dementia, essential hypertension, and arthrosis.12 Unlike in our study, the NHIS study calculated direct costs by defining patients as those who used a healthcare facility at least once; as a result, diseases with high rates of outpatient treatment received a high ranking and total costs were higher than those reported in the present study. The total direct costs in the NHIS study were about 10 trillion won higher than was calculated in the current study.12
There is an ongoing debate on the inclusion of employment rate in the calculation of productivity losses, related to the potential underestimation of labor that cannot be expressed as wages (such as household work by the elderly and housewives) and the application of ideal full employment. Statistics Korea reported that 43.9% of the Korean population belonged to double-income families,7 and that despite the fact that unpaid housework is a productive activity, its value as labor is generally disregarded or neglected in official statistics.21 Since the 1970s, concerns have been raised regarding the underestimation of women's unpaid household labor in the labor market and income statistics.22 In 1989, the United Nations stated that these statistics are incorrect, and opportunity costs can be applied as a countermeasure. In other words, opportunity costs estimate the potential income that could be earned by unpaid laborers, such as housewives, if they were to give up their unpaid labor and engage in occupational labor. Thus, per the opportunity cost principle, housewives who are devoted to housework have lost their opportunity to participate in paid labor, and their opportunity cost then becomes their monetary income they could earn through productive labor.23
In this context, the present study presented productivity losses without considering the employment rate in the sensitivity analysis. If the employment rate is not considered, the indirect costs are estimated to be 110.3 billion dollar (122.4 trillion won), which is about 1.5 times higher than the previously described estimate, resulting in a total socioeconomic cost of 177.1 billion dollar (196.5 trillion won). Thus, the socioeconomic cost from diseases in 2015 is estimated to range from 133.7–177.1 (148–196 trillion won).
According to Annemans et al.,24 the costs of illness and disease burden are highly correlated, and the same is true for direct costs. But in the KBD study that applied the same disease prevalence criteria, DALY was the highest for LBP in 2015, followed by DM, chronic obstructive pulmonary disease, IHD, and OA,25 while the highest socioeconomic burden was caused by self-harm, LBP, and acute bronchitis. Five diseases (LBP, IHD, cirrhosis of the liver, falls, and motorized vehicle with three or more wheels) were included in the top 10 for both economic burden and DALY rankings (Table 5). This shows that the diseases that are important in terms of quality of life and those that are important in terms of costs are not the same. Therefore, both quality of life and social costs should be considered when determining the priorities of healthcare policies and resource allocation.
Table 5
Top conditions sorted by DALY and economic burden
DALY = disability-adjusted life years, LBP = low back pain, IHD = ischemic heart disease, OA = osteoarthritis.
![]()
This study has a few limitations related to the use of health insurance claims data to compute socioeconomic costs. First, patients were defined based on their use of healthcare services, with reference to previous studies and expert suggestions, but there is a possibility that the number of patients was under- or overestimated. Furthermore, non-covered healthcare costs were estimated using an assumed percentage. Productivity losses were calculated using the human resources approach, so the size of losses may have been overestimated compared to the value calculated using the friction cost approach. In addition, the burden of younger groups and men could be overestimated. However, this study presented ranges of economic disease burden by applying various methodologies to calculate productivity losses, including employment rate, and comparisons have been presented for the results with and without the application of discount rates.
The economic burden of disease focuses on the financial costs of illnesses for individuals, households, and societies, while DALY involves measuring the impact of disease and disability on bodies from the onset of illness to the outcome.26 The comparative analysis in terms of cost-effectiveness can be a strong tool to decide how to use the limited resources. Also, within the relationship between economic and DALY approach to burden of disease, the process for establishing health care priorities needs to be developed.
In summary, this study calculated the disease burden of all diseases using a single methodology, and the disease burden for each disease was computed using a more sophisticated definition of patients than has been used in previous studies. Our findings showed that the 2015 socioeconomic disease burden of 238 diseases and 22 injuries in Korea was an estimated USD131–173 billion (148–196 trillion won). Self-harm, LBP, and acute bronchitis were highly ranked but these diseases did not get much attention. Appropriate disease specific policy to minimize the burden of disease is required.
 XML Download