Burden of disease and injuries in 2015
In Korea, the total number of all-age DALYs in 2015 was 15 million and DALYs per 100,000 population was 29,476 (
Table 1). To look into the trend by age, the crude DALYs increased until people were in their 50s and then showed a decreasing trend, and the DALYs per 100,000 population increased until people were in their 70s and slightly decreased at the age of 80 and older. The distribution of DALYs by age was similar both in men and women. Women showed a higher burden of disease overall compared to men (DALYs per 100,000 population for men was 28,887, while that of women was 30,064), but when observed by age group, there were some differences in their patterns. Based on the DALYs per 100,000 population, men and women showed a similar level of DALYs in infancy and early childhood (< 10 years old), but men were at a higher level in adolescence, women were at a higher level in middle age (20s to 40s), and men were again at a higher level at the age of 50 and older (
Fig. 1).
Table 1
DALYs per 100,000 population by gender and level 2 disease groups in Korea, 2015

|
Level 1 |
Level 2 |
Men |
Women |
Total |
|
DALYsa
|
DALYsa
|
DALYsa
|
|
Communicable, maternal, neonatal, and nutritional diseases |
HIV/AIDS and tuberculosis |
180 (0.6) |
86 (0.3) |
133 (0.5) |
|
Diarrhea, lower respiratory infections, meningitis, other common infectious diseases |
137 (0.5) |
136 (0.5) |
136 (0.5) |
|
Neglected tropical diseases and malaria |
4 (0.0) |
2 (0.0) |
3 (0.0) |
|
Maternal disorders |
- (0.0) |
849 (2.8) |
425 (1.4) |
|
Neonatal disorders |
55 (0.2) |
44 (0.1) |
49 (0.2) |
|
Nutritional deficiencies |
23 (0.1) |
96 (0.3) |
59 (0.2) |
|
Other communicable, maternal, neonatal, and nutritional disorders |
6 (0.0) |
5 (0.0) |
5 (0.0) |
|
NCD |
Neoplasms |
2,711 (9.4) |
2,246 (7.5) |
2,479 (8.4) |
|
Cardiovascular and circulatory diseases |
3,877 (13.4) |
3,073 (10.2) |
3,475 (11.8) |
|
Chronic respiratory diseases |
1,752 (6.1) |
1,988 (6.6) |
1,870 (6.2) |
|
Cirrhosis of the liver |
1,180 (4.1) |
536 (1.8) |
858 (2.9) |
|
Digestive diseases (except cirrhosis) |
1,548 (5.4) |
1,912 (6.4) |
1,730 (5.9) |
|
Neurological disorders |
927 (3.2) |
1,597 (5.3) |
1,262 (4.3) |
|
Mental and behavioral disorders |
1,674 (5.8) |
2,020 (6.7) |
1,847 (6.3) |
|
Diabetes, urogenital, blood, and endocrine diseases |
4,348 (15.1) |
3,889 (12.9) |
4,118 (14.0) |
|
Musculoskeletal disorders |
3,357 (11.6) |
5,633 (18.7) |
4,496 (15.3) |
|
Other NCD |
3,387 (11.7) |
3,709 (12.3) |
3,548 (12.0) |
|
Injuries |
Transport injuries |
1,205 (4.2) |
742 (2.5) |
973 (3.3) |
|
Unintentional injuries other than transport injuries |
1,667 (5.8) |
1,078 (3.6) |
1,372 (4.7) |
|
Self-harm and interpersonal violence |
840 (2.9) |
421 (1.4) |
630 (2.1) |
|
Forces of nature, war, and legal intervention |
11 (0.0) |
4 (0.0) |
8 (0.0) |
|
Total |
|
28,887 (100.0) |
30,064 (100.0) |
29,476 (100.0) |

 | Fig. 1
DALYs per 100,000 population by gender and age group in Korea, 2015.
DALY = disability-adjusted life year, YLLs = years of life lost, YLDs = years lived with disability.

|
The DALYs for Korean people in 2015 consists of 14% YLL and 86.0% YLD. In the case of men, 18% of DALYs were attributed to YLL, while for women, it was 11%. In other words, it was analyzed that the proportion of YLL in the gender-specific DALYs was slightly larger for men than for women. To look into each age group, the proportion of YLL showed an increasing trend as the age increased. In the 0–9 age group, it was high at 14%, but it decreased to 6% in the 10–19 age group and then consistently increased, reaching 41% in the 80+ age group. As for women, it was observed that the proportion of YLL was slightly lower compared to men in all age groups (
Fig. 1).
From the analysis results of each higher-level (level 1) disease group, CMNN made up 2.8% of the total DALYs, while NCD and injuries made up 87.1% and 10.1%, respectively. Overall, YLD made up a larger proportion than YLL, and in the case of NCD, 89% of the total DALYs were due to YLD, while for CMNN it was 79% and for injuries was 66%. For women, CMNN and NCD showed higher DALYs per 100,000 population compared to men, whereas injuries showed a higher figure for men than for women (
Table 1).
From the analysis results of each middle-level (level 2) disease group, the DALYs per 100,000 population for musculoskeletal disorders was 4,496. This ranked the highest as it made up 15.3% of the total DALYs in Korea. It was followed by the DALYs per 100,000 population for diabetes, urogenital, blood, and endocrine diseases at 4,118 (14.0%), other NCD at 3,548 (12.0%), cardiovascular and circulatory diseases at 3,475 (11.8%), and neoplasms at 2,479 (8.4%). In the case of men, the DALYs per 100,000 population for diabetes, urogenital, blood, and endocrine diseases was 4,348, ranked the highest as it made up 15.1% of the total DALYs of men. For women, the DALYs per 100,000 population due to musculoskeletal disorders was the highest at 5,633 (18.7% of the women's total DALYs) (
Table 1).
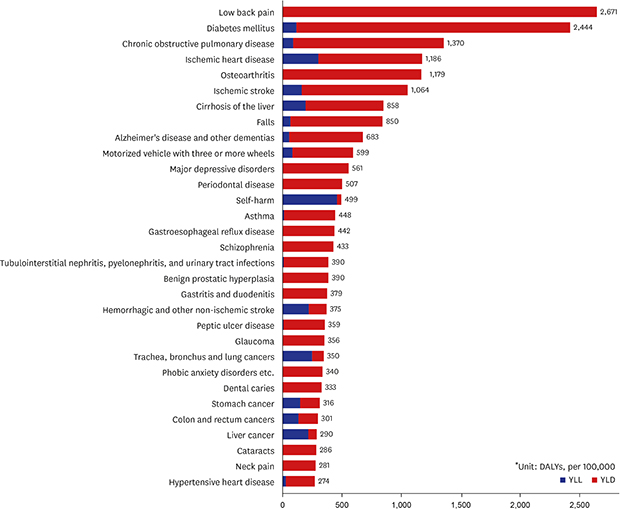
From the analysis results of each lower-level (levels 3 and 4) disease group, the DALYs per 100,000 population for low back pain was the highest at 2,671 (9.1%), followed by diabetes mellitus at 2,444 (8.3%), chronic obstructive pulmonary disease (COPD) at 1,370 (4.6%), ischemic heart disease at 1,186 (4.0%), and osteoarthritis at 1,179 (4.0%). The DALYs of the top three diseases made up 22% of the total Korean burden of disease in 2015, with the top 10 diseases comprising 43.8% (
Fig. 2). For men, the DALYs per 100,000 population for diabetes mellitus was the highest at 2,841 (9.8%), followed by low back pain at 2,140 (7.4%), and ischemic heart disease at 1,481 (5.1%). For women, the DALYs per 100,000 population for low back pain was the highest at 3,202 (10.7%), followed by diabetes mellitus at 2,048 (6.8%), and osteoarthritis at 1,763 (5.9%). Among the burden of disease for men, the top three diseases made up 22.4% out of the total burden of disease of men, while among the burden of disease of women, the top three diseases made up 22.3% out of the total burden of disease of women (
Table 2).
 | Fig. 2
Top 30 leading specific causes (level 3 and 4) of DALYs in Korea, 2015.
DALY = disability-adjusted life year, YLLs = years of life lost, YLDs = years lived with disability.

|
Table 2
DALYs per 100,000 population by gender and level 3 and 4 disease groups in Korea, 2015

|
Rank |
Men |
DALYsa
|
Women |
DALYsa
|
|
1 |
Diabetes mellitus |
2,841 |
Low back pain |
3,202 |
|
2 |
Low back pain |
2,140 |
Diabetes mellitus |
2,048 |
|
3 |
Ischemic heart disease |
1,481 |
Osteoarthritis |
1,763 |
|
4 |
COPD |
1,281 |
COPD |
1,460 |
|
5 |
Cirrhosis of the liver |
1,180 |
Ischemic stroke |
999 |
|
6 |
Ischemic stroke |
1,129 |
Alzheimer's disease and other dementias |
955 |
|
7 |
Falls |
953 |
Ischemic heart disease |
892 |
|
8 |
Benign prostatic hyperplasia |
780 |
Major depressive disorders |
748 |
|
9 |
Motorized vehicle with three or more wheels |
680 |
Falls |
747 |
|
10 |
Self-harm |
664 |
Tubulointerstitial nephritis, pyelonephritis, and urinary tract infections |
600 |
|
11 |
Osteoarthritis |
595 |
Cirrhosis of the liver |
536 |
|
12 |
Periodontal disease |
503 |
Gastroesophageal reflux disease |
523 |
|
13 |
Trachea, bronchus and lung cancers |
480 |
Motorized vehicle with three or more wheels |
519 |
|
14 |
Liver cancer |
450 |
Periodontal disease |
510 |
|
15 |
Schizophrenia |
435 |
Abortion |
504 |
|
16 |
Hemorrhagic and other non-ischemic strokes |
419 |
Asthma |
490 |
|
17 |
Stomach cancer |
415 |
Gastritis and duodenitis |
480 |
|
18 |
Alzheimer's disease and other dementias |
411 |
Schizophrenia |
430 |
|
19 |
Asthma |
406 |
Phobic anxiety disorders etc. |
415 |
|
20 |
Major depressive disorders |
375 |
Women infertility |
406 |
|
21 |
Gastroesophageal reflux disease |
360 |
Dental caries |
402 |
|
22 |
Colon and rectum cancers |
358 |
Breast cancer |
399 |
|
23 |
Glaucoma |
355 |
Peptic ulcer disease |
368 |
|
24 |
Peptic ulcer disease |
350 |
Glaucoma |
358 |
|
25 |
Gout |
303 |
Self-harm |
334 |
|
26 |
Gastritis and duodenitis |
277 |
Hemorrhagic and other non-ischemic stroke |
331 |
|
27 |
Mechanical forces (other) |
273 |
Cataracts |
324 |
|
28 |
Overexertion and strenuous movements |
268 |
Neck pain |
322 |
|
29 |
Phobic anxiety disorders etc. |
264 |
Thyroid cancer |
308 |
|
30 |
Dental caries |
263 |
Hypertensive heart disease |
296 |

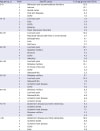
Regarding age group, in the 0–9 age group, the burden from refraction and accommodation disorders was ranked highest at 13.6%, followed by asthma at 13.1%, and dental caries at 12.3%. The DALYs of those top three diseases comprise 38.9% of the total DALYs of the 0–9 age group. In the 10–49 age group, low back pain showed the highest burden of disease, while diabetes mellitus was ranked highest in the 50–69 age group and Alzheimer's disease and other dementias in the age group of 70 and older (
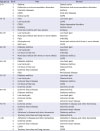
Table 3). In particular, in the case of women in the pregnancy and childbirth stage (between the ages of 20 and 39), the burden of specific diseases such as abortion and women infertility was high, and for the men aged 20–39, it was characteristic that the burden of injury-related diseases including falls and injuries from motorized vehicles with three or more wheels was high (
Table 4).
Table 3
Top 5 leading specific causes (level 3 and 4) of DALYs by age group in Korea, 2015
|
Age group, yr |
Rank |
Specific cause |
% of age group total DALYs |
|
0–9 |
1 |
Refraction and accommodation disorders |
13.6 |
|
2 |
Asthma |
13.1 |
|
3 |
Dental caries |
12.3 |
|
4 |
Viral skin diseases |
8.3 |
|
5 |
COPD |
7.5 |
|
10–19 |
1 |
Low back pain |
7.5 |
|
2 |
Falls |
5.4 |
|
3 |
COPD |
5.3 |
|
4 |
Epilepsy |
4.0 |
|
5 |
Major depressive disorders |
3.9 |
|
20–29 |
1 |
Low back pain |
10.0 |
|
2 |
Motorized vehicle with three or more wheels |
5.7 |
|
3 |
Schizophrenia |
4.1 |
|
4 |
Falls |
3.7 |
|
5 |
Self-harm |
3.7 |
|
30–39 |
1 |
Low back pain |
12.1 |
|
2 |
Diabetes mellitus |
8.7 |
|
3 |
Abortion |
4.3 |
|
4 |
COPD |
4.3 |
|
5 |
Infertility |
3.6 |
|
40–49 |
1 |
Low back pain |
13.4 |
|
2 |
Diabetes mellitus |
12.1 |
|
3 |
Cirrhosis of the liver |
4.5 |
|
4 |
COPD |
3.4 |
|
5 |
Osteoarthritis |
3.3 |
|
50–59 |
1 |
Diabetes mellitus |
11.1 |
|
2 |
Low back pain |
10.3 |
|
3 |
Osteoarthritis |
7.2 |
|
4 |
Ischemic heart disease |
5.1 |
|
5 |
COPD |
4.6 |
|
60–69 |
1 |
Diabetes mellitus |
8.3 |
|
2 |
Low back pain |
7.5 |
|
3 |
Osteoarthritis |
6.8 |
|
4 |
Ischemic heart disease |
6.8 |
|
5 |
Ischemic stroke |
6.1 |
|
70–79 |
1 |
Alzheimer's disease and other dementias |
9.4 |
|
2 |
Ischemic stroke |
8.2 |
|
3 |
Ischemic heart disease |
7.1 |
|
4 |
Diabetes mellitus |
5.3 |
|
5 |
COPD |
5.2 |
|
≥ 80 |
1 |
Alzheimer's disease and other dementias |
19.0 |
|
2 |
Ischemic stroke |
9.8 |
|
3 |
Ischemic heart disease |
8.1 |
|
4 |
COPD |
5.5 |
|
5 |
Falls |
3.9 |

Table 4
Top 5 leading specific causes (level 3 and 4) of DALYs by gender and age group in Korea, 2015
|
Age group |
Rank |
Men |
Women |
|
0–9 |
1 |
Asthma |
Dental caries |
|
2 |
Refraction and accommodation disorders |
Refraction and accommodation disorders |
|
3 |
Viral skin diseases |
Asthma |
|
4 |
COPD |
Viral skin diseases |
|
5 |
Dental caries |
COPD |
|
10–19 |
1 |
Falls |
Low back pain |
|
2 |
Low back pain |
COPD |
|
3 |
COPD |
Major depressive disorders |
|
4 |
Epilepsy |
Dental caries |
|
5 |
Motorized vehicle with two wheels |
Epilepsy |
|
20–29 |
1 |
Low back pain |
Low back pain |
|
2 |
Motorized vehicle with three or more wheels |
Abortion |
|
3 |
Falls |
Infertility |
|
4 |
Schizophrenia |
Motorized vehicle with three or more wheels |
|
5 |
Self-harm |
COPD |
|
30–39 |
1 |
Diabetes mellitus |
Low back pain |
|
2 |
Low back pain |
Abortion |
|
3 |
Cirrhosis of the liver |
Infertility |
|
4 |
Motorized vehicle with three or more wheels |
Diabetes mellitus |
|
5 |
Falls |
COPD |
|
40–49 |
1 |
Diabetes mellitus |
Low back pain |
|
2 |
Low back pain |
Diabetes mellitus |
|
3 |
Cirrhosis of the liver |
Osteoarthritis |
|
4 |
Ischemic heart disease |
COPD |
|
5 |
Falls |
Periodontal disease |
|
50–59 |
1 |
Diabetes mellitus |
Low back pain |
|
2 |
Low back pain |
Osteoarthritis |
|
3 |
Ischemic heart disease |
Diabetes mellitus |
|
4 |
Cirrhosis of the liver |
COPD |
|
5 |
Ischemic stroke |
Ischemic stroke |
|
60–69 |
1 |
Ischemic heart disease |
Osteoarthritis |
|
2 |
Diabetes mellitus |
Diabetes mellitus |
|
3 |
Low back pain |
Low back pain |
|
4 |
Ischemic stroke |
Ischemic stroke |
|
5 |
COPD |
Ischemic heart disease |
|
70–79 |
1 |
Ischemic stroke |
Alzheimer's disease and other dementias |
|
2 |
Ischemic heart disease |
Ischemic stroke |
|
3 |
COPD |
Ischemic heart disease |
|
4 |
Alzheimer's disease and other dementias |
Diabetes mellitus |
|
5 |
Trachea, bronchus and lung cancers |
Osteoarthritis |
|
≥ 80 |
1 |
Alzheimer's disease and other dementias |
Alzheimer's disease and other dementias |
|
2 |
Ischemic stroke |
Ischemic stroke |
|
3 |
Ischemic heart disease |
Ischemic heart disease |
|
4 |
COPD |
Falls |
|
5 |
Trachea, bronchus and lung cancers |
COPD |

It was analyzed that communicable diseases accounted for 0.9% of the total DALYs in Korea in 2015. The burden of disease for men was approximately 42% higher than that for women, with YLLs making up 45% and YLDs making up 55% (
Table 1). Among communicable diseases, the DALYs per 100,000 population for tuberculosis was the highest at 98.5, followed by acute bronchitis etc., and HIV resulting in other specified or unspecified diseases (
Fig. 3A).
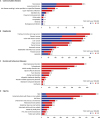 | Fig. 3
Top 10 leading specific causes (level 3 and 4) of DALYs by disease group in Korea. (A) Communicable diseases, (B) Neoplasms, (C) Mental and behavioral diseases, (D) Injuries.
DALY = disability-adjusted life year, YLLs = years of life lost, YLDs = years lived with disability.

|
Neoplasms accounted for 8.4% of total DALYs in Korea in 2015. Men had a 21% higher burden of disease compared to women. In neoplasms, YLLs makes up 53% and YLDs makes up 47%, and it comprises 31.8% of the total YLLs and 4.6% of the total YLDs in Korea. In particular, in terms of the level 2 disease classification, neoplasms showed the highest YLLs (
Table 1). Among neoplasms, the DALYs per 100,000 population for trachea, bronchus, and lung cancers was the highest at 350, followed by stomach cancer, colon and rectum cancers, liver cancer, and breast cancer in rank order (
Fig. 3B). For men, trachea, bronchus, and lung cancers showed the highest burden, while the burden of breast cancer was the highest for women.
It was revealed that mental and behavioral disorders occupied 6.3% of the total DALYs in 2015. In mental and behavioral disorders, YLLs makes up 2% and YLDs makes up 98%, and they comprise 0.7% out of the total YLLs and 7.2% out of the total YLDs in Korea (
Table 1). Among mental and behavioral disorders, the DALYs per 100,000 population for major depressive disorders was ranked highest at 561, followed by schizophrenia, phobic anxiety disorders etc., bipolar affective disorder, and panic disorder (
Fig. 3C).
Injuries occupied 10.1% of the total DALYs in 2015. Injuries accounted for 34% of YLLs and 66% of YLDs, and 25% of the total YLLs and 8% of the total YLDs in Korea (
Table 1). The DALYs per 100,000 population for falls was the highest at 850, followed by injuries from motorized vehicles with three or more wheels, and self-harm (
Fig. 3D).
In terms of the YLDs per 100,000 population, the YLDs per 100,000 population for low back pain was the highest at 2,671, followed by diabetes mellitus at 2,326, COPD at 1,280, osteoarthritis at 1,179, and ischemic stroke at 901. As for the YLLs per 100,000 population, the YLLs per 100,000 population due to self-harm was the highest at 464; followed by ischemic heart disease at 304; trachea, bronchus, and lung cancers at 252; hemorrhagic and other non-ischemic strokes at 223; and liver cancer at 218. Among the top 30 diseases with the highest DALYs per 100,000 population, the YLLs due to self-harm made up the largest proportion at 93%; followed by liver cancer at 75%; trachea, bronchus and lung cancers at 72%; and hemorrhagic and other non-ischemic strokes at 60%. Regarding other diseases, the ratio of YLDs was higher than that of YLLs (
Fig. 2).
Trends and patterns of burden of disease and injuries, 2007–2015
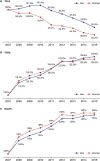
We looked into the trends of the YLLs per 100,000 population in Korea for the period of 2007 to 2015, and it was observed that it stayed at a certain level from 2007 to 2010 and then it showed a consistently decreasing trend from 2011. The YLLs per 100,000 population in 2015 decreased by approximately 6.5% compared to 2007. The YLLs per 100,000 population decreased both for men and women. In the case of men, the YLLs per 100,000 population decreased by 5.5% in 2015 compared to 2007, while it decreased by 7.8% in the case of women. Among the top 30 diseases with the highest YLLs per 100,000 population in 2015, injuries from motorized vehicles with three or more wheels decreased by 33.9%, showing the largest decrease, while pedestrian injuries caused by road vehicles fell by 30.2% and ischemic stroke by 28.8%. In contrast, Parkinson's disease increased by 129.3%, recording the largest increase, over-exertion and strenuous movements rose by 50.8% and pancreatic cancer by 34.0% (
Fig. 4A).
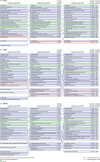 | Fig. 4
Top 20 leading specific causes (level 3 and 4) of YLLs due to premature mortality, YLDs, and DALYs for 2007, 2010, and 2015, with percentage change in DALYs (per 100,000). (A) YLLs due to premature mortality, (B) YLDs, (C) DALYs.
YLLs = years of life lost, YLDs = years lived with disability, DALY = disability-adjusted life year.

|
We observed the trend of YLDs per 100,000 population in Korea for the period from 2007 to 2015, and it showed a consistently increasing trend from 2007 to 2015. The YLDs per 100,000 population increased by approximately 36.7% in 2015 compared to 2007. By gender, the YLDs per 100,000 population rose both for men and women. In the case of men, the YLDs per 100,000 population in 2015 increased by 37.9% compared to 2007, while it rose by 35.5% in the case of women. Among the top 30 diseases with the highest YLDs per 100,000 population in 2015, asthma fell by 42.6%, showing the largest decrease, peptic ulcer disease decreased by 33.1%, and injuries caused by motorized vehicles with three or more wheels by 8.8%. For all the other diseases, the YLDs per 100,000 population increased in 2015 compared to 2007. Alzheimer's disease and other dementias showed the largest increase at 339.9%, periodontal disease rose by 210.7%, and benign prostatic hyperplasia by 138.8% (
Fig. 4B).
From the analysis results of the changes in the Korean burden of disease for the period from 2007 to 2015, it was observed that both the crude DALYs and the DALYs per 100,000 population showed a consistently increasing trend from 2007 to 2015. Korea's population in 2015 had increased by approximately 3.7% compared to 2007, and for the same period, the crude DALYs increased by 32.8% and the DALYs per 100,000 population by 28.1%. By gender, the DALYs per 100,000 population as of 2015 rose by 27.4% for men and 28.8% for women compared to 2007, and they showed similar yearly trends (
Fig. 5). Among the top 20 diseases in 2015, it was Alzheimer's disease and other dementias, which showed the largest increase as its DALYs per 100,000 population, increased by 283.8% compared to 2007. In the case of diabetes mellitus, which ranked high in 2015 in terms of burden of disease, the DALYs per 100,000 population in 2015 rose by 42.3% compared to 2007, while low back pain increased by 88.5%, COPD by 53.7%, and ischemic heart disease by 40.8%.
 | Fig. 5
Change of YLLs due to premature mortality, YLDs, and DALYs per 100,000 by years in Korea. (A) YLLs due to premature mortality, (B) YLDs, (C) DALYs.
YLLs = years of life lost, YLDs = years lived with disability, DALY = disability-adjusted life year.

|
Among the top 20 diseases in terms of the DALYs per 100,000 population as of 2015, the DALYs per 100,000 population for asthma in 2015 fell by 42.7% compared to 2007, while injuries from motorized vehicles with three or more wheels decreased by 13.4% and hemorrhagic and other non-ischemic strokes by 0.3%. All the other top 17 diseases with the highest DALYs per 100,000 population as of 2015 also showed an increasing trend. The DALY's per 100,000 population for Alzheimer's disease and other dementias showed the largest increase at 283.8% compared to 2007, while periodontal disease rose by 210.7%, benign prostatic hyperplasia by 138.8%, glaucoma by 124.5%, and gastroesophageal reflux disease by 116.4%. Liver cancer and dental caries were ranked within the top 20 in terms of the DALYs per 100,000 population in 2007, but they were excluded from the top 20 as their ranks fell (
Fig. 4C).


 PDF
PDF Citation
 Print
Print


 XML Download