

 PDF
PDF Citation
 Print
Print


INTRODUCTION
Burden of disease analysis is well established internationally as the standard summary measure to assess population health. The Global Burden of Disease (GBD) study quantifies the gap between a population's actual health and an ideal level where every individual lives in full health for their estimated life span. It includes both fatal and non-fatal components for each disease and injury, as well as a comprehensive list of risk factors, and provides estimates at the global level, and by individual country.
While the GBD provides country-specific estimates and is important for international comparisons, several countries, including Australia, have undertaken their own national burden of disease studies. These country-specific studies offer particular advantages, including the capacity to add diseases and risk factors of national interest, calculate disease burden estimates for specific population groups and take advantage of detailed data and methodological approaches more appropriate to that country.
Australia has a population of 25.2 million people. Overall, Australians have similar or better health than those in similarly developed countries, including a relatively high life expectancy and low smoking rate.1 Recent years have seen improvements, such as in the number of years lived in full health, however, further improvements could be made, such as in the rate of obesity. Around 71% of people in Australia live in major cities and the remainder live in regional or remote areas.1
DATA AND METHODS DEVELOPMENTS
The ABDS 2011 used and adapted methods from the GBD studies to produce disease and risk factor estimates best suited to the Australian context. It included additional diseases—such as cancer of unknown primary site—and a risk factor—sun exposure. The study included estimates for over 200 diseases and injuries from 17 disease groups, and for 29 risk factors. Sub-national estimates by state and territory, remoteness area and socioeconomic group were also produced. The overarching methods were developed under the guidance of an expert advisory group. The detailed methods for each disease and risk factor were determined following comprehensive assessment of GBD's methods and consideration of how they could be applied to the Australian study, in conjunction with Australian experts.6 In summary, the ABDS 2011 used a similar methodological framework to GBD, with adjustments for the Australian context; notably additional diseases and risk factors, more detailed Australian data, enhanced redistribution of deaths, and revised conceptual models for some diseases.7
The majority of estimates were derived directly from high-quality Australian data; usually detailed, unit record or linked data. Deaths data for estimating fatal burden were sourced from the National Mortality Database. Data for estimating non-fatal burden came from a variety of sources including national datasets with complete coverage (such as the National Hospital Morbidity Database and the Australian Cancer Database), from registry data, national surveys, linked hospitals and deaths data, and a number of epidemiological studies.
The ABDS used the hybrid approach for calculating disability-adjusted life-years (DALY) consistent with recent global studies: calculating years of life lost (YLL) from an incidence perspective and years lived with disability (YLD) from a prevalence perspective. One key advantage of this approach is that data to calculate the DALY are measured in the reference period (whereas an incidence-based DALY requires projection of the future duration of health loss, and the prevalence-based DALY requires knowledge of deaths that occurred before the reference period).
Methods used to calculate fatal burden estimates in GBD studies were further developed for the ABDS 2011 by using evidence for Australian-specific deaths to better redistribute deaths not appropriate for burden of disease analysis. In ABDS 2011, 85% of redistribution was based on some form of empirical evidence, including use of direct evidence, notably for cancer and heart failure deaths, as well as use of Australian multiple causes of death data for other high-volume diseases.
Other developments since the previous Australian studies included use of the new GBD standard life table which substantially increased the ‘ideal’ life span. New data sources, greater use of linked data and updated disability weights (from GBD 2013) were also implemented for the 2011 study.
Due to the substantial changes, estimates from previous Australian studies34 as well as Australian estimates from global studies are not comparable with those for the ABDS 2011.2 However, for the ABDS 2011, estimates were recalculated for 2003 using revised methods. All figures in this paper are taken from the ABDS 20112 and detailed methods have been published.7
HEALTH LOSS IN AUSTRALIA IN 2003 AND 2011
Australians lost 4.5 million DALY in 2011, equating to 190 DALY for every 1,000 people. There were substantial gains in the health of Australians, with the DALY rate decreasing by 15%, from 210 DALY per 1,000 people in 2003 (Table 1). This was mainly driven by a reduction in fatal burden due to preventing or delaying deaths from cardiovascular diseases (mostly coronary heart disease and stroke).
Table 1
Change in disease burden (DALY, YLL and YLD) in Australia, 2011 and 2003

Rates were age standardised to the 2001 Australian standard population, and are expressed per 1,000 population.
DALY = disability-adjusted life-year, YLL = years of life lost, YLD = years lived with disability, ASR = age-standardised rate.
aChange in number is 2011 metric (DALY, YLD, or YLL) minus 2003 metric (DALY, YLD, or YLL), expressed as a percentage of 2003 metric; bChange in ASR is 2011 age standardised rate minus 2003 age standardised rate.
![]()
In terms of living with disease, there was a 3.8% reduction in non-fatal burden between 2003 and 2011. As the reduction in fatal burden was not off-set by an increase in non-fatal burden, this suggests that the success in reducing premature deaths had not resulted in higher health loss from living with disease.
CHRONIC DISEASE AND INJURY DOMINATE HEALTH LOSS IN AUSTRALIA
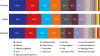
Cancer (19% of total DALY), cardiovascular diseases (15%), mental and substance use disorders (12%), musculoskeletal conditions (12%) and injuries (9%) were the leading causes of total burden in Australia in 2011 at the disease group level (Fig. 1). Premature death was mostly responsible for health loss from cancer, cardiovascular diseases and injuries whilst health loss from mental and substance use disorders and musculoskeletal disorders were mainly due to people living with these conditions.
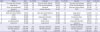
The top 10 diseases accounted for 37% of the total burden (Table 2). Coronary heart disease, other musculoskeletal disorders, back pain and problems, chronic obstructive pulmonary disease (COPD) and lung cancer were the top 5 specific causes of burden. Differences in health loss were evident between males and females. For example, dementia and anxiety disorders were in the top 5 causes of burden only for females, while suicide and self-inflicted injuries were in the top 5 only for males.
Table 2
Leading 10 causes of total burden (DALY), by sex, 2011
![]()
MENTAL AND MUSCULOSKELETAL DISORDERS CAUSE THE MOST HEALTH LOSS FROM LIVING WITH DISEASE
Mental and substance use disorders and musculoskeletal disorders made up almost half of the non-fatal health loss experienced by Australians in 2011 (24% and 23% of the total YLD, respectively).
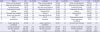
The top 10 diseases accounted for 50% of non-fatal burden (Table 3). “Other musculoskeletal conditions” (which included ill-defined and unknown types of arthritis; chronic pain in joints, muscles and other soft tissue; and systemic lupus erythematosus) was the leading cause of non-fatal burden for both males and females. This group of conditions (7.8%), back pain and problems (7.3%), anxiety disorders (6.3%), depressive disorders (5.7%) and asthma (4.5%) contributed one-third (32%) of the non-fatal burden.
Table 3
Leading 10 causes of non-fatal burden (YLD), by sex, 2011
![]()
CANCER, CARDIOVASCULAR DISEASE AND INJURIES CAUSE THE MOST PREMATURE DEATHS IN AUSTRALIA
Cancer (34% of YLL), cardiovascular diseases (23%) and injuries (14%) accounted for nearly three-quarters (71%) of fatal burden in 2011. Although injuries ranked third for both males and females, when looking at the number of YLL, males experienced 2.5 times more fatal burden due to injuries than females.
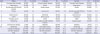
The top 10 diseases accounted for nearly half (47%) of the fatal burden, and coronary heart disease (12%), lung cancer (6.7%), stroke (5.3%), suicide and self-inflicted injuries (4.9%) and bowel cancer (3.8%) contributed one-third (33%) of the fatal burden (Table 4). Although coronary heart disease was the leading cause of fatal burden for males and females, the YLL for males was nearly double that of females. Chronic liver disease was also a considerable contributor to fatal burden for males, but less so for females.
Table 4
Leading 10 causes of fatal burden (YLL), by sex, 2011
![]()
HEALTH-ADJUSTED LIFE EXPECTANCY (HALE)
HALE reflects the length of time an individual at a specific age can, on average, expect to live in full health; that is, time lived without the health consequences of disease or injury. Life expectancy in Australia for males born in 2011 was 79.9 years and for females it was 84.3 years. HALE of Australians at birth was 70.9 years for males and 74.4 years for females. That is, a boy born in 2011 could expect to live 89% of his life in full health while a girl could expect to live 88% of her life in full health.8
HEALTH LOSS VARIED ACROSS AUSTRALIA
Health loss was notably different across Australia, with the disparity reflecting a complex interaction of demographic, socioeconomic and environmental factors. Very remote areas of Australia experienced 1.7 times the rate of health loss of major cities; and the socioeconomic group with the greatest disadvantage had the highest rate of burden, at 1.5 times the rate of the least disadvantaged group. Indigenous Australians experienced health loss at a rate that was 2.3 times that of non-Indigenous Australians; with health loss from chronic disease accounting for 70% of the gap in disease burden between Indigenous and non-Indigenous Australians.9
LARGE PROPORTION OF HEALTH LOSS IN AUSTRALIA WAS PREVENTABLE
Risk factors are factors which represent a greater chance of developing or dying from a health condition. At least 31% of the burden in 2011 was preventable, being due to the modifiable risk factors included in the study. The risk factors causing the most health loss were tobacco use (9.0%), overweight and obesity (5.5%), alcohol use (5.1%), physical inactivity (5.0%) and high blood pressure (4.9%). The joint effect of thirteen dietary risk factors, including ‘Diet low in fruit’ and ‘Diet high in processed meat,’ was responsible for 7.2% of the burden. The risk factors combined contributed greatly to the burden for endocrine disorders (96%), cardiovascular diseases (69%), cancer (44%), kidney and urinary diseases (42%) and injuries (30%). These results are taken from analyses that used consistent methods for all risk factors,2 however, some estimates have since been updated.1
FUTURE ABDS WORK
Burden of disease estimates evolve with improved data and information. It is important to continue to enhance methods to produce improved estimates. Findings from the next ABDS, for the reference year 2015, will be published in 2019. This update will include important changes such as estimation of HALE in conjunction with the other estimates, a more comprehensive list of diseases, and risk factors of particular relevance to Australia. Moreover the 2015 study will add an extra time point to provide further information on how the disease burden has changed over time.
Continuing Australian burden of disease estimation and analysis into the future would further enhance the valuable evidence base to support Australian health policy, planning and investment decisions.
 XML Download