Journal List > J Korean Med Sci > v.34(Suppl 1) > 1119202

Ock, Park, Park, Oh, Yoon, Cho, and Jo: Disability Weights Measurement for 289 Causes of Disease Considering Disease Severity in Korea

Abstract

Background

For the Korean Burden of Disease (KBD) 2015 study, we have amended disability weights for causes of disease adapting the methodology of the KBD disability weight 2012 study.

Methods

We conducted a self-administered web-based survey in Korea using ranking five causes of disease. A total of 605 physicians and medical college students who were attending in third or fourth grade of a regular course performed the survey. We converted the ranked data into paired comparison data and ran a probit regression. The predicted probabilities for each cause of disease were calculated from the coefficient estimates of the probit regression. ‘Being dead (1)’ and ‘Full health (0)’ were utilized as anchor points to rescale the predicted probability on a scale from 0 to 1.

Results

As a result, disability weights for a total of 289 causes of disease were estimated. In particular, we calculated the disability weights of 60 causes of disease considering severity level. These results show that prejudice about the severity of cause of disease itself can affect the estimation of disability weight, when estimating the disability weight for causes of disease without consideration of severity. Furthermore, we have shown that disability weights can be estimated based on a ranking method which can maximize efficiency of data collection.

Conclusion

Disability weights from this study can be used to estimate disability adjusted life year and healthy life expectancy. Furthermore, we expected that the use of the ranking method will increase gradually in disability weight studies.

Graphical Abstract

jkms-34-e60-abf001

INTRODUCTION

Summary measures of population health (SMPH) are a combination of a fatal health condition that can lead to death and a health condition of a non-fatal health condition.1 SMPH, also referred to as a composite indicator, is distinguished by indicators of health gap or life year and indicators of life expectancy.23 The indictors of health gap are again divided into the disability adjusted life year (DALY) which is utilized in the global burden of disease (GBD) study4 and the quality adjusted life year (QALY) which is mainly used as the outcome index of the cost-utility analysis.5 Furthermore, indicators of life expectancy are also classified into the healthy life expectancy (HALE) which is utilized in the GBD study4 and the quality adjusted life expectancy (QALE) using health-related quality of life.6
Among the SMPH, DALY and HALE are used to estimate the GBD, but there have been also many studies on DALY and HALE in Korea.78910 In order to calculate DALY and HALE, disability weight is an essential factor. The disability weight is a measure of the level of disability of particular health state and diseases, and its value lies between 0 (full health, no disability) and 1 (disability level in a state such as death).11 That is, the disability weight plays a bridging role between mortality and morbidity when estimating DALY and HALE. Therefore, it is necessary to be able to estimate the disability weight appropriately and reliably.12 If the disability weight of a specific disease is overestimated, the burden of the disease may be overestimated. Conversely, if the disability weight is underestimated, there is a possibility of underestimating the burden of disease.
Since 1996, many studies have been conducted to estimate disability weights in many countries.11131415 Most recently, disability weights for the GBD 2013 study was performed using paired comparison as a main valuation method and disability weights for 235 health states were estimated adding the results of European disability weight study.1314 In the case of Korea, two disability weights studies for the Korean Burden of Disease (KBD) 2012 were conducted most recently.1115 In the first study, a total of 496 physician and medical students participated in self-administered web-based surveys and a total of 228 disability weights of disease causes for calculating the incidence-based DALY were estimated.11 In the second study, a total of 2,728 and 3,188 general public participated in the household and web-based survey, respectively, and a total of 258 disability weights of health states for calculating the prevalence-based DALY were estimated.15
However, disability weights calculated in the past may not be valid at this time because of the emergence of new diseases or health states, changes in disease characteristics, development of treatment methods, and changes in social perspectives on disability.12 Therefore, it is necessary to continually evaluate the validity of disability weights and to revise disability weights. In particular, there is an increasing need to calculate the more valid burden of diseases reflecting the severity level of diseases and attempts are being made to calculate the disability weight reflecting the severity level of health states.915 However, there was no attempt to calculate the disability weights for disease causes reflecting the severity level of diseases.
For the KBD 2015 study, we have amended disability weights for causes of disease adapting the methodology of the KBD disability weight 2012 study. In particular, we attempted to further refine the severity level of diseases, such as cancer and diabetes, and to determine their disability weights.

METHODS

Study design and participants

We conducted a self-administered web-based survey in Korea, adapting the methodology of a preceding disability weights measurement study.11 The survey was conducted from November 2016 to March 2017. In this study, we recruited study participants who could be expected to have enough knowledge about causes of disease. Specifically, physicians and medical students who were attending in the third or fourth grade of a regular course participated in the survey. We recruited participants through promotion of the survey in the lectures of medical colleges and an announcement at medical conferences, seminars and meetings.

Valuation method and causes of disease

Each participant responded to his or her age, gender, specialty, and position at the beginning of the survey. Next, the participant evaluated the causes of diseases using a ranking method. That is, the participants ranked causes of disease in order of good health in the ranking method, considering mental and physical problems. Because the survey was conducted for the medical professionals, the descriptions of causes of disease were not developed and the response was obtained by presenting the causes of disease itself to the survey participants. We used a method ranking five causes of disease, which proved to be effective in previous study.16
The five causes of disease were randomly selected among the 289 causes of disease. Among the 289 causes of disease, 211 causes of disease were taken from the previous disability weights measurement study without subdividing severity level.11 For 60 causes of disease, the degree of severity was further subdivided. For example, gastric cancer was classified into four stages: gastric cancer stage I, gastric cancer stage II, gastric cancer stage III, gastric cancer IV. Osteoarthritis was subdivided into three stages: osteoarthritis (mild), osteoarthritis (moderate), osteoarthritis (severe). Diabetes mellitus was classified into two stages: diabetes mellitus without complications and diabetes mellitus with complications. Furthermore, 16 causes of disease were included in the list for the verification of the disability weight model of multimorbidity. For example, two or more causes of disease, such as patients with diabetes mellitus and osteoarthritis, were included in the list. The remaining two causes of disease were ‘full health’ and ‘being dead.’ These were included for use as an anchor points in the analysis.
Each participant performed a total of 20 ranking methods. In order to obtain a sufficient number of comparisons between ‘full health’ or ‘being dead’ and other causes of disease, ‘full health’ should be included in question 1 and 11, whereas ‘being dead’ should be included in question 5, 10, 15, and 20.

Analysis

Initially, we conducted descriptive analyses for determining the characteristics of socio-demographic factors of the participants. Before the disability weight analyses, illogical response that ‘full health’ was not listed as the healthiest condition were excluded from the results. Then, we converted the ranked data into paired comparison data.16 For example, if the orders of causes of disease were “C1 > C2 > C3 > C4 > C5,” they were converted as follows: “C1 > C2,” “C1 > C3,” “C1 > C4,” “C1 > C5,” “C2 > C3,” “C2 > C4,” “C2 > C5,” “C3 > C4,” “C3 > C5,” and “C4 > C5.” After conversion, we ran a probit regression according to the analytic methodology of previous studies.1115 The stated preference between the two causes of disease in the paired comparison data were regarded as the dependent variable. The 289 causes of disease were treated as independent variables and created as dummy variables with ‘being dead’ as the reference. The predicted probabilities for each cause of disease were calculated from the coefficient estimates of the probit regression. ‘Being dead (1)’ and ‘Full health (0)’ were utilized as anchor points to rescale the predicted probability of each cause of disease on a scale from 0 to 1. Using the 95% confidence interval (CI) of the predicted probabilities, the 95% CIs of disability weight for causes of disease were estimated.
The calculated disability weights from this study were compared to those calculated in a preceding disability weights measurement study.11 Stata 13.1 software (StataCorp, College Station, TX, USA) was used for all statistical analyses. P values less than 0.05 were regarded statistically significant in this study.

Ethics statement

This study was approved by the Institutional Review Board of the Asan Medical Center (IRB No. 2016-1271). Each participant was informed about the purpose of the survey and only those individuals who provided informed consent joined this survey.

RESULTS

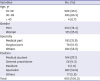
A total of 605 participants performed the survey. Table 1 shows the details of the participants' socio-demographic characteristics. The participants in the 30s were predominant and the men participants outnumbered women participants in the survey. The specialists accounted for about 60% of the total survey participants, and the medical part specialists were more than the surgical part specialists.
Table 1

Characteristics of the study participants by type of survey

jkms-34-e60-i001
Variables No. (%)
Age, yr
19–29 206 (34.1)
30–39 395 (65.3)
≤ 40 4 (0.7)
Gender
Men 450 (74.4)
Women 155 (25.6)
Specialty
Medical part 193 (31.9)
Surgical part 78 (12.9)
Others 334 (55.2)
Position
Medical student 164 (27.1)
General practitioner 56 (9.3)
Resident 6 (1.0)
Specialist 362 (59.8)
Others 17 (2.8)
Total 605 (100.0)
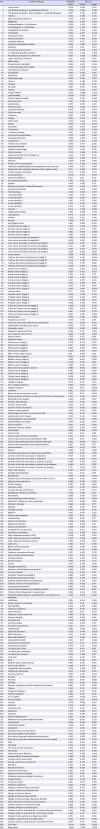
Of the 1,210 questions that included ‘full health,’ eight (0.7%) were illogical responses for which the ‘full health’ was not listed as the best health status. All of these illogical responses occurred in question 11. Table 2 shows the disability weights and their 95% CIs for 289 causes of disease. The cause of disease with highest disability weight was ‘trachea, bronchus and lung cancers (stage 4) (0.906),’ followed by ‘kidney cancer (stage 4) (0.902)’ and ‘brain and nervous system cancers (0.888).’ The cause of disease with lowest disability weight was ‘acne vulgaris (0.049),’ followed by ‘dental caries (0.065)’ and ‘allergic rhinitis (0.087).’ More than half of the causes of disease (n = 166, 57.4%) had disability weight values of less than 0.5 (Fig. 1). Furthermore, disability weights for about 70% of causes of disease (n = 201, 69.6%) were located between 0.2 and 0.7.
Table 2

Disability weights for 289 causes of disease

jkms-34-e60-i002
No. Cause of disease Disability weight 95% CI
Lower Upper
1 Tuberculosis 0.519 0.462 0.575
2 HIV disease resulting in mycobacterial infection 0.746 0.694 0.792
3 HIV disease resulting in other specified or unspecified diseases 0.787 0.740 0.828
4 Cholera 0.355 0.298 0.415
5 Other salmonella infections 0.279 0.229 0.334
6 Shigellosis 0.248 0.198 0.303
7 Enteropathogenic E. coli infection 0.290 0.236 0.347
8 Enterotoxigenic E. coli infection 0.267 0.216 0.323
9 Campylobacter enteritis 0.268 0.218 0.324
10 Amoebiasis 0.380 0.321 0.440
11 Cryptosporidiosis 0.518 0.459 0.577
12 Rotaviral enteritis 0.188 0.146 0.236
13 Intestinal infection 0.270 0.217 0.327
14 Typhoid and paratyphoid fevers 0.382 0.322 0.445
15 Influenza 0.149 0.112 0.194
16 Pneumococcal pneumonia 0.427 0.369 0.486
17 H. influenzae type B pneumonia 0.407 0.348 0.468
18 Respiratory syncytial virus pneumonia 0.367 0.309 0.428
19 Upper respiratory infections 0.131 0.096 0.173
20 Otitis media 0.176 0.134 0.224
21 Pneumococcal meningitis 0.590 0.532 0.645
22 H. influenzae type B meningitis 0.557 0.498 0.614
23 Meningococcal infection 0.530 0.470 0.588
24 Encephalitis 0.687 0.632 0.737
25 Diphtheria 0.340 0.284 0.398
26 Whooping cough 0.253 0.203 0.307
27 Tetanus 0.525 0.466 0.583
28 Measles 0.254 0.203 0.312
29 Varicella 0.241 0.193 0.293
30 Malaria 0.438 0.381 0.497
31 Chagas disease 0.547 0.489 0.604
32 Leishmaniasis 0.408 0.350 0.467
33 African trypanosomiasis 0.432 0.376 0.490
34 Schistosomiasis 0.381 0.323 0.442
35 Cysticercosis 0.372 0.316 0.431
36 Echinococcosis 0.412 0.354 0.471
37 Lymphatic filariasis 0.418 0.359 0.479
38 Onchocerciasis 0.319 0.264 0.378
39 Trachoma 0.437 0.376 0.498
40 Dengue 0.395 0.337 0.455
41 Yellow fever 0.504 0.444 0.563
42 Rabies 0.655 0.598 0.709
43 Ascariasis 0.231 0.183 0.284
44 Trichuriasis 0.253 0.202 0.309
45 Hookworm disease 0.241 0.193 0.295
46 Food-borne trematodiases 0.275 0.224 0.330
47 Tsutsugamushi fever 0.386 0.329 0.445
48 Typhus fever 0.390 0.332 0.449
49 Hantaan virus disease 0.472 0.411 0.532
50 Intestinal helminth 0.267 0.217 0.321
51 Maternal hemorrhage 0.514 0.453 0.575
52 Maternal sepsis 0.749 0.699 0.795
53 Hypertensive disorders of pregnancy 0.455 0.395 0.516
54 Obstructed labor 0.462 0.404 0.521
55 Abortion 0.300 0.245 0.359
56 Preterm birth complications 0.517 0.456 0.576
57 Neonatal encephalopathy (birth asphyxia and birth trauma) 0.858 0.815 0.893
58 Sepsis and other infectious disorders of the newborn baby 0.711 0.658 0.759
59 Protein-energy malnutrition 0.414 0.356 0.474
60 Iodine deficiency 0.200 0.155 0.250
61 Vitamin A deficiency 0.153 0.115 0.197
62 Iron-deficiency anemia 0.170 0.131 0.216
63 Syphilis 0.452 0.393 0.511
64 Sexually transmitted chlamydial diseases 0.253 0.205 0.307
65 Gonococcal infection 0.307 0.255 0.364
66 Trichomoniasis 0.316 0.259 0.377
67 Herpes genitalia 0.286 0.231 0.345
68 Acute hepatitis A 0.364 0.307 0.424
69 Acute hepatitis B 0.431 0.372 0.491
70 Acute hepatitis C 0.501 0.441 0.561
71 Acute hepatitis E 0.467 0.407 0.526
72 Leprosy 0.613 0.558 0.665
73 Legionnaires' disease 0.345 0.288 0.405
74 Leptospirosis 0.415 0.355 0.475
75 Rubella 0.359 0.301 0.418
76 Mumps 0.202 0.157 0.253
77 Esophageal cancer 0.841 0.802 0.875
78 Stomach cancer (stage 1) 0.462 0.403 0.520
79 Stomach cancer (stage 2) 0.669 0.614 0.720
80 Stomach cancer (stage 3) 0.823 0.780 0.860
81 Stomach cancer (stage 4) 0.880 0.840 0.912
82 Liver cancer secondary to hepatitis B 0.796 0.749 0.837
83 Liver cancer secondary to hepatitis C 0.802 0.755 0.842
84 Liver cancer secondary to alcohol use (stage 1) 0.603 0.541 0.661
85 Liver cancer secondary to alcohol use (stage 2) 0.718 0.666 0.766
86 Liver cancer secondary to alcohol use (stage 3) 0.785 0.737 0.827
87 Liver cancer secondary to alcohol use (stage 4) 0.876 0.838 0.907
88 Larynx cancer 0.824 0.784 0.859
89 Trachea, bronchus and lung cancers (stage 1) 0.600 0.542 0.656
90 Trachea, bronchus and lung cancers (stage 2) 0.738 0.686 0.785
91 Trachea, bronchus and lung cancers (stage 3) 0.758 0.710 0.801
92 Trachea, bronchus and lung cancers (stage 4) 0.906 0.873 0.932
93 Breast cancer (stage 1) 0.439 0.379 0.500
94 Breast cancer (stage 2) 0.597 0.535 0.657
95 Breast cancer (stage 3) 0.724 0.671 0.771
96 Breast cancer (stage 4) 0.864 0.826 0.895
97 Cervical cancer (stage 1) 0.431 0.372 0.491
98 Cervical cancer (stage 2) 0.553 0.493 0.611
99 Cervical cancer (stage 3) 0.813 0.767 0.851
100 Cervical cancer (stage 4) 0.855 0.815 0.889
101 Uterine cancer 0.711 0.661 0.757
102 Prostate cancer (stage 1) 0.458 0.399 0.518
103 Prostate cancer (stage 2) 0.613 0.552 0.672
104 Prostate cancer (stage 3) 0.742 0.692 0.787
105 Prostate cancer (stage 4) 0.838 0.795 0.874
106 Colon and rectum cancers (stage 1) 0.496 0.436 0.556
107 Colon and rectum cancers (stage 2) 0.689 0.631 0.742
108 Colon and rectum cancers (stage 3) 0.841 0.798 0.878
109 Colon and rectum cancers (stage 4) 0.870 0.833 0.900
110 Mouth cancer 0.870 0.828 0.905
111 Nasopharynx cancer 0.766 0.716 0.811
112 Cancer of other part of pharynx and oropharynx 0.811 0.764 0.851
113 Gallbladder and biliary tract cancer 0.800 0.752 0.843
114 Pancreatic cancer 0.879 0.843 0.909
115 Malignant melanoma of skin 0.786 0.737 0.829
116 Non-melanoma skin cancer 0.649 0.593 0.702
117 Ovarian cancer 0.776 0.727 0.821
118 Testicular cancer 0.692 0.637 0.744
119 Kidney cancer (stage 1) 0.570 0.509 0.627
120 Kidney cancer (stage 2) 0.731 0.678 0.778
121 Kidney cancer (stage 3) 0.809 0.762 0.849
122 Kidney cancer (stage 4) 0.902 0.870 0.927
123 Other urinary organ cancers 0.711 0.656 0.761
124 Bladder cancer (stage 1) 0.500 0.441 0.558
125 Bladder cancer (stage 2) 0.623 0.567 0.676
126 Bladder cancer (stage 3) 0.769 0.720 0.812
127 Bladder cancer (stage 4) 0.869 0.830 0.901
128 Brain and nervous system cancers 0.888 0.852 0.918
129 Thyroid cancer (stage 1) 0.301 0.248 0.359
130 Thyroid cancer (stage 2) 0.484 0.425 0.543
131 Thyroid cancer (stage 3) 0.639 0.583 0.691
132 Thyroid cancer (stage 4) 0.779 0.730 0.822
133 Hodgkin's disease 0.670 0.612 0.725
134 Non-Hodgkin lymphoma 0.689 0.636 0.737
135 Multiple myeloma 0.764 0.714 0.808
136 Leukemia 0.812 0.765 0.854
137 Bone and connective tissue cancer 0.765 0.717 0.809
138 Benign neoplasm of brain and other parts of central nervous system 0.505 0.442 0.567
139 Rheumatic heart disease 0.600 0.542 0.657
140 Ischemic heart disease 0.534 0.475 0.592
141 Ischemic stroke (mild) 0.540 0.477 0.601
142 Ischemic stroke (moderate) 0.787 0.740 0.828
143 Ischemic stroke (severe) 0.840 0.799 0.875
144 Hemorrhagic and other non-ischemic stroke 0.785 0.738 0.825
145 Hypertensive heart disease 0.502 0.444 0.560
146 Cardiomyopathy and myocarditis 0.717 0.661 0.768
147 Atrial fibrillation and flutter 0.584 0.526 0.641
148 Aortic aneurysm 0.647 0.591 0.700
149 Peripheral vascular disease 0.430 0.368 0.492
150 Endocarditis 0.646 0.589 0.700
151 Hermorrhoid 0.139 0.103 0.182
152 Varicose veins of lower extremities 0.173 0.132 0.219
153 Chronic obstructive pulmonary disease (mild) 0.408 0.351 0.466
154 Chronic obstructive pulmonary disease (moderate) 0.703 0.648 0.754
155 Chronic obstructive pulmonary disease (severe) 0.722 0.668 0.771
156 Pneumoconiosis 0.669 0.614 0.721
157 Asthma 0.396 0.337 0.458
158 Interstitial lung disease and pulmonary sarcoidosis 0.678 0.623 0.729
159 Cirrhosis of the liver secondary to hepatitis B 0.707 0.655 0.755
160 Cirrhosis of the liver secondary to hepatitis C 0.706 0.653 0.754
161 Cirrhosis of the liver secondary to alcohol use (mild) 0.484 0.424 0.543
162 Cirrhosis of the liver secondary to alcohol use (moderate) 0.668 0.612 0.722
163 Cirrhosis of the liver secondary to alcohol use (severe) 0.717 0.664 0.765
164 Peptic ulcer disease 0.260 0.207 0.319
165 Gastritis and duodenitis 0.144 0.107 0.187
166 Appendicitis 0.245 0.196 0.300
167 Paralytic ileus and intestinal obstruction without hernia 0.388 0.332 0.446
168 Inguinal or femoral hernia 0.269 0.220 0.322
169 Crohn's disease 0.597 0.538 0.653
170 Ulcerative colitis 0.545 0.485 0.604
171 Vascular disorders of intestine 0.515 0.455 0.573
172 Gallbladder and bile duct disease 0.448 0.386 0.511
173 Pancreatitis 0.498 0.436 0.559
174 Gastroesophageal reflux disease 0.163 0.123 0.209
175 Alzheimer's disease and other dementias 0.736 0.685 0.782
176 Parkinson's disease 0.660 0.606 0.711
177 Epilepsy 0.581 0.523 0.637
178 Multiple sclerosis 0.693 0.640 0.742
179 Migraine 0.190 0.148 0.237
180 Tension-type headache 0.163 0.121 0.212
181 Schizophrenia 0.666 0.612 0.717
182 Alcohol use disorders 0.350 0.295 0.407
183 Opioid use disorders 0.457 0.398 0.517
184 Cocaine use disorders 0.459 0.401 0.518
185 Amphetamine use disorders 0.473 0.413 0.534
186 Cannabis use disorders 0.355 0.299 0.413
187 Major depressive disorder (mild) 0.279 0.229 0.333
188 Major depressive disorder (moderate) 0.528 0.469 0.586
189 Major depressive disorder (severe) 0.569 0.509 0.627
190 Dysthymia 0.188 0.145 0.238
191 Bipolar affective disorder 0.483 0.424 0.542
192 Panic disorder 0.391 0.335 0.448
193 Obsessive-compulsive disorder 0.321 0.266 0.378
194 Post-traumatic stress disorder 0.415 0.357 0.474
195 Anorexia nervosa 0.420 0.363 0.478
196 Bulimia nervosa 0.392 0.334 0.451
197 Autism 0.510 0.449 0.570
198 Asperger's syndrome 0.408 0.349 0.469
199 Attention-deficit hyperactivity disorder 0.249 0.200 0.302
200 Conduct disorder 0.275 0.224 0.331
201 Idiopathic intellectual disability 0.483 0.422 0.543
202 Borderline personality disorder 0.397 0.340 0.455
203 Diabetes mellitus without complications 0.334 0.279 0.391
204 Diabetes mellitus with complications 0.663 0.605 0.717
205 Acute glomerulonephritis 0.420 0.362 0.480
206 Chronic kidney disease due to diabetes mellitus 0.674 0.617 0.727
207 Chronic kidney disease due to hypertension 0.594 0.534 0.652
208 Tubulointerstitial nephritis, pyelonephritis, and urinary tract infections 0.359 0.302 0.418
209 Urolithiasis 0.294 0.242 0.350
210 Benign prostatic hyperplasia 0.207 0.161 0.259
211 Men infertility 0.332 0.279 0.389
212 Urinary incontinence 0.287 0.233 0.345
213 Uterine fibroids 0.223 0.177 0.274
214 Polycystic ovarian syndrome 0.399 0.342 0.458
215 Women infertility 0.362 0.306 0.421
216 Endometriosis 0.349 0.292 0.408
217 Genital prolapse 0.404 0.338 0.471
218 Premenstrual syndrome 0.136 0.101 0.179
219 Thalassemias 0.485 0.425 0.545
220 Sickle cell disorders 0.552 0.494 0.609
221 G6PD deficiency 0.519 0.458 0.580
222 Rheumatoid arthritis 0.451 0.392 0.510
223 Osteoarthritis (mild) 0.216 0.171 0.268
224 Osteoarthritis (moderate) 0.415 0.357 0.474
225 Osteoarthritis (severe) 0.575 0.515 0.633
226 Low back pain (mild) 0.138 0.101 0.181
227 Low back pain (moderate) 0.310 0.257 0.368
228 Low back pain (severe) 0.456 0.396 0.517
229 Neck pain 0.133 0.097 0.177
230 Gout 0.390 0.332 0.451
231 Systemic lupus erythematosus 0.594 0.533 0.651
232 Neural tube defects 0.782 0.734 0.825
233 Congenital heart anomalies 0.679 0.622 0.731
234 Cleft lip and cleft palate 0.313 0.258 0.372
235 Down's syndrome 0.590 0.533 0.645
236 Eczema 0.135 0.098 0.179
237 Psoriasis 0.235 0.187 0.288
238 Cellulitis 0.273 0.222 0.329
239 Abscess, impetigo, and other bacterial skin diseases 0.267 0.215 0.324
240 Scabies 0.194 0.150 0.245
241 Fungal skin diseases 0.260 0.210 0.316
242 Viral skin diseases 0.166 0.126 0.212
243 Acne vulgaris 0.049 0.029 0.078
244 Alopecia areata 0.154 0.114 0.200
245 Pruritus 0.100 0.069 0.140
246 Urticaria 0.106 0.074 0.147
247 Decubitus ulcer 0.479 0.421 0.536
248 Glaucoma 0.449 0.388 0.510
249 Cataracts 0.324 0.267 0.383
250 Macular degeneration 0.457 0.396 0.518
251 Refraction and accommodation disorders 0.206 0.162 0.257
252 Dental caries 0.065 0.042 0.097
253 Periodontal disease 0.206 0.161 0.257
254 Edentulism 0.471 0.410 0.531
255 Pedestrian injury by road vehicle 0.470 0.410 0.530
256 Road injury (pedal cycle vehicle) 0.315 0.262 0.371
257 Road injury (motorized vehicle with two wheels) 0.495 0.435 0.555
258 Road injury (motorized vehicle with three or more wheels) 0.597 0.538 0.653
259 Falls 0.165 0.126 0.212
260 Drowning 0.514 0.454 0.573
261 Fire, heat and hot substances 0.362 0.304 0.423
262 Poisonings 0.475 0.415 0.536
263 Mechanical forces (firearm) 0.547 0.485 0.608
264 Adverse effects of medical treatment 0.362 0.306 0.420
265 Animal contact (venomous) 0.363 0.304 0.424
266 Animal contact (non-venomous) 0.132 0.095 0.176
267 Self-harm 0.516 0.455 0.577
268 Assault by firearm 0.488 0.429 0.548
269 Assault by sharp object 0.260 0.212 0.312
270 Exposure to forces of nature 0.235 0.188 0.287
271 Collective violence and legal intervention 0.432 0.373 0.492
272 Allergic rhinitis 0.087 0.059 0.123
273 Atopic dermatitis 0.231 0.182 0.285
274 Metabolic syndrome 0.304 0.250 0.361
275 Allergic rhinitis and atopic dermatitis 0.166 0.124 0.215
276 Diabetes mellitus and osteoarthritis 0.495 0.436 0.553
277 Allergic rhinitis and asthma 0.187 0.145 0.236
278 Allergic rhinitis and osteoarthritis 0.192 0.147 0.244
279 Allergic rhinitis and major depressive disorder 0.394 0.336 0.453
280 Major depressive disorder and osteoarthritis 0.478 0.418 0.539
281 Diabetes mellitus and ischemic stroke 0.629 0.570 0.685
282 Diabetes mellitus and tuberculosis 0.478 0.418 0.539
283 Diabetes mellitus, osteoarthritis, and major depressive disorder 0.543 0.484 0.601
284 Diabetes mellitus, osteoarthritis, and ischemic stroke 0.667 0.611 0.719
285 Allergic rhinitis, asthma, and atopic dermatitis 0.172 0.131 0.219
286 Diabetes, osteoarthritis, and tuberculosis 0.574 0.514 0.632
287 Diabetes mellitus, osteoarthritis, rheumatoid arthritis 0.494 0.431 0.556
288 Full heath 0.000 0.000 0.000
289 Being dead 1.000 1.000 1.000
CI = confidence interval, E. coli = Escherichia coli.
Fig. 1

Distribution of disability weights.

jkms-34-e60-g001
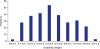
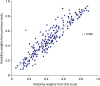
Fig. 2 shows the correlation of disability weights between the disability weights for the overlapping causes of disease from this study and a previous study.11 The Pearson correlation coefficient was 0.930. Among 211 overlapping causes of disease, the disability weights for 47 causes of disease from this study, such as ‘tuberculosis’ and ‘decubitus ulcer,’ were determined to be higher than that from the previous study; whereas, the disability weights for 163 causes of disease from this study, such as ‘schizophrenia’ and ‘epilepsy,’ were estimated to be lower than that from the previous study. The cause of disease with largest difference in disability weight between the two studies was ‘falls (0.448)’, followed by ‘down's syndrome (0.318)’ and ‘asperger's syndrome (0.277).’ Supplementary Table 1 shows comparisons between the disability weights for overlapping causes of disease from this study and the previous study.11
Fig. 2

Correlation of disability weights between this study and a previous study.

jkms-34-e60-g002
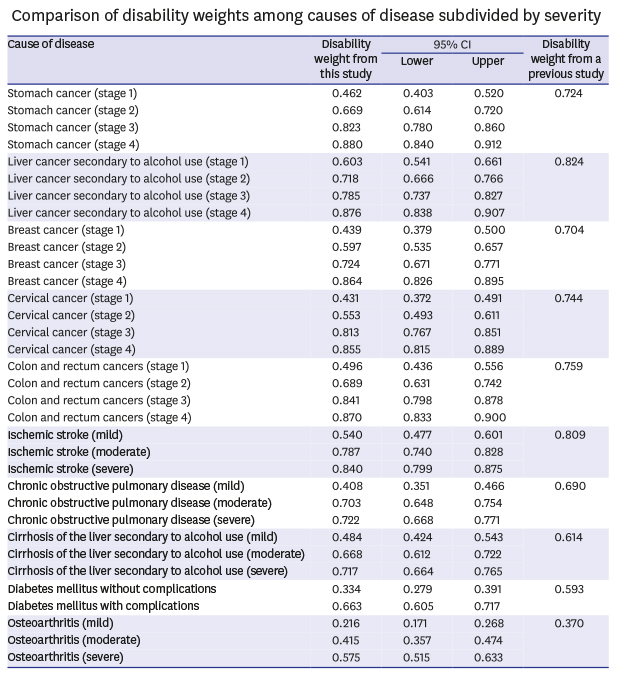
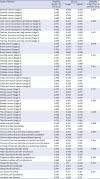
The results of comparing the disability weights of 60 causes of disease that are more subdivided into severity are shown in the Table 3. In the case of ‘liver cancer secondary to alcohol use,’ the disability weights by stage were 0.603 (stage 1), 0.718 (stage 2), 0.785 (stage 3), and 0.876 (stage 4). The disability weight of ‘liver cancer secondary to alcohol use’ in the previous study was 0.824, located between the stage 3 and 4. On the other hand, in the case of ‘thyroid cancer,’ the disability weights by stage were 0.301 (stage 1), 0.484 (stage 2), 0.639 (stage 3), and 0.779 (stage 4). The disability weight of ‘thyroid cancer’ in the previous study was 0.466, located between the stage 1 and 2. Furthermore, the disability weight of ‘diabetes mellitus without complications’ was 0.334, but the disability weight of ‘diabetes mellitus with complications’ was 0.663, with a difference of 0.329.
Table 3

Comparison of disability weights among causes of disease subdivided by severity

jkms-34-e60-i003
Cause of disease Disability weight from this study 95% CI Disability weight from a previous study
Lower Upper
Stomach cancer (stage 1) 0.462 0.403 0.520 0.724
Stomach cancer (stage 2) 0.669 0.614 0.720
Stomach cancer (stage 3) 0.823 0.780 0.860
Stomach cancer (stage 4) 0.880 0.840 0.912
Liver cancer secondary to alcohol use (stage 1) 0.603 0.541 0.661 0.824
Liver cancer secondary to alcohol use (stage 2) 0.718 0.666 0.766
Liver cancer secondary to alcohol use (stage 3) 0.785 0.737 0.827
Liver cancer secondary to alcohol use (stage 4) 0.876 0.838 0.907
Trachea, bronchus and lung cancers (stage 1) 0.600 0.542 0.656 0.917
Trachea, bronchus and lung cancers (stage 2) 0.738 0.686 0.785
Trachea, bronchus and lung cancers (stage 3) 0.758 0.710 0.801
Trachea, bronchus and lung cancers (stage 4) 0.906 0.873 0.932
Breast cancer (stage 1) 0.439 0.379 0.500 0.704
Breast cancer (stage 2) 0.597 0.535 0.657
Breast cancer (stage 3) 0.724 0.671 0.771
Breast cancer (stage 4) 0.864 0.826 0.895
Cervical cancer (stage 1) 0.431 0.372 0.491 0.744
Cervical cancer (stage 2) 0.553 0.493 0.611
Cervical cancer (stage 3) 0.813 0.767 0.851
Cervical cancer (stage 4) 0.855 0.815 0.889
Prostate cancer (stage 1) 0.458 0.399 0.518 0.701
Prostate cancer (stage 2) 0.613 0.552 0.672
Prostate cancer (stage 3) 0.742 0.692 0.787
Prostate cancer (stage 4) 0.838 0.795 0.874
Colon and rectum cancers (stage 1) 0.496 0.436 0.556 0.759
Colon and rectum cancers (stage 2) 0.689 0.631 0.742
Colon and rectum cancers (stage 3) 0.841 0.798 0.878
Colon and rectum cancers (stage 4) 0.870 0.833 0.900
Kidney cancer (stage 1) 0.570 0.509 0.627 0.777
Kidney cancer (stage 2) 0.731 0.678 0.778
Kidney cancer (stage 3) 0.809 0.762 0.849
Kidney cancer (stage 4) 0.902 0.870 0.927
Bladder cancer (stage 1) 0.500 0.441 0.558 0.792
Bladder cancer (stage 2) 0.623 0.567 0.676
Bladder cancer (stage 3) 0.769 0.720 0.812
Bladder cancer (stage 4) 0.869 0.830 0.901
Thyroid cancer (stage 1) 0.301 0.248 0.359 0.466
Thyroid cancer (stage 2) 0.484 0.425 0.543
Thyroid cancer (stage 3) 0.639 0.583 0.691
Thyroid cancer (stage 4) 0.779 0.730 0.822
Ischemic stroke (mild) 0.540 0.477 0.601 0.809
Ischemic stroke (moderate) 0.787 0.740 0.828
Ischemic stroke (severe) 0.840 0.799 0.875
Chronic obstructive pulmonary disease (mild) 0.408 0.351 0.466 0.690
Chronic obstructive pulmonary disease (moderate) 0.703 0.648 0.754
Chronic obstructive pulmonary disease (severe) 0.722 0.668 0.771
Cirrhosis of the liver secondary to alcohol use (mild) 0.484 0.424 0.543 0.614
Cirrhosis of the liver secondary to alcohol use (moderate) 0.668 0.612 0.722
Cirrhosis of the liver secondary to alcohol use (severe) 0.717 0.664 0.765
Major depressive disorder (mild) 0.279 0.229 0.333 0.606
Major depressive disorder (moderate) 0.528 0.469 0.586
Major depressive disorder (severe) 0.569 0.509 0.627
Diabetes mellitus without complications 0.334 0.279 0.391 0.593
Diabetes mellitus with complications 0.663 0.605 0.717
Osteoarthritis (mild) 0.216 0.171 0.268 0.370
Osteoarthritis (moderate) 0.415 0.357 0.474
Osteoarthritis (severe) 0.575 0.515 0.633
Low back pain (mild) 0.138 0.101 0.181 0.315
Low back pain (moderate) 0.310 0.257 0.368
Low back pain (severe) 0.456 0.396 0.517
CI = confidence interval.

DISCUSSION

In this study, we have amended 289 disability weights for causes of disease adapting the methodology of the KBD disability weight 2012 study.11 In particular, we divided the severity of major causes of diseases unlike KBD disability weight 2012 study and estimated their disability weights. A significant number of physicians and medical students participated in the disability weight survey to collect professional and objective opinions on the preferences of the causes of diseases. Furthermore, we maximized the efficiency of the collecting data by using a method ranking five causes of disease that has not yet been attempted in disability weight studies.
In the meantime, paired comparison has been used as a key value evaluation method in the latest international and domestic disability weight studies.11131415 In this study, however, the ranking method was used as a valuation method, and we determined that the ranking method could be used to calculate the disability weight. Paired comparison has a disadvantage in that the amount of information that can be obtained from a single question is limited, so that the number of items in the survey or the sample size must be increased, if the number of health states or causes of disease to be compared is large.1217 Although the utilization of the ranking method is still low, it can provide more information than the paired comparison. Based on the experience of this study, we expected that the use of the ranking method will increase gradually.
Another difference from previous studies is that we estimated disability weights considering the severity of the causes of disease. We calculated the disability weights of 60 causes of disease considering severity level and compared them with the disability weights in the previous study.11 These results show that prejudice about the severity of cause of disease itself can affect the estimation of disability weight, when estimating the disability weight of cause disease without consideration of severity. For example, disability weight of ‘liver cancer secondary to alcohol use’ by stage were 0.603 (stage 1), 0.718 (stage 2), 0.785 (stage 3), and 0.876 (stage 4). The disability weight of ‘liver cancer secondary to alcohol use’ in the previous study was 0.824, located between the stage 3 and 4 (11). On the other hand, disability weight of ‘thyroid cancer’ by stage were 0.301 (stage 1), 0.484 (stage 2), 0.639 (stage 3), and 0.779 (stage 4). The disability weight of ‘thyroid cancer’ in the previous study was 0.466, located between the stage 1 and 2.11 These results suggest that it is necessary to calculate the disability weight of causes of disease by reflecting the severity in order to calculate the valid DALY in cases of the large severity difference in the cause of disease or the burden of disease is large. However, in this case, epidemiological data according to severity should be also collected to estimate valid DALY.1819
When conducting a disability weight study, we typically estimate disability weights for dozens to hundreds of health states or causes of disease, and the calculated disability weight has a value of a limited scale of 0 to 1. Thus, a disability weight for any health state or cause of disease may seem counterintuitive when compared to other health state or cause of disease's disability weight, and the absolute magnitude of the disability weight may not seem plausible. This will be the same in this study. However, since there is no golden standard for disability weights, it is not easy to assess the validity of disability weights.1217
In this study, the following indirect methods were used to evaluate and enhance the validity of the disability weights. First, we examined whether disability weights were reversed in diseases with different levels of severity. For example, when the severity of an ischemic stroke is classified as mild, moderate, or severe, the disability weight of the mild ischemic stroke should be the lowest, and the disability weight of the severe ischemic stroke should be the highest. No such reversal was found in this study. We also tried to compare the disability weights of the present study with the disability weights calculated in a previous study.11 As a result, it was confirmed that there was a fairly high correlation between disability weights from the two studies. Finally, we tried to increase the number of survey participants and to include various specialist among survey participants. Compared to the size of other studies' samples,17 a significant number of medical professionals have participated in this disability weights survey.
In the recent disability weighting study, the general public is used rather than the healthcare professionals as a participant in the questionnaire.131415 Considering that the reason for estimating the disability weight is to measure the burden of disease and one of the main reasons for measuring the burden of disease is to determine the priority of resource allocation, it is persuasive to calculate disability weights reflecting the preferences of the general public.122021 However, it is not easy to precisely get preferences for health states or causes of disease among the general public who do not have a lot of medical knowledge.1222 It is therefore still worthwhile to utilize healthcare professionals in disability weights studies who are expected to be able to objectively compare and evaluate causes of disease with a wealth of knowledge of various health states and causes of diseases.11 It is expected that comparing and integrating the results of the disability weights studies for healthcare professionals, patients, and the general public will become increasingly important.
One limitation of this study is that it could not perform the verification of the disability weight model of multimorbidity properly. We included 16 causes of disease, such as diabetes mellitus with osteoarthritis, in the list of causes of disease and tried to preliminarily evaluate the validity of multiplicative model, additive model, and maximum model for disability weights in multimorbidity.2223 However, it seems that the meaning of having a complex disease in the survey participants is not enough. As a result, there were some cases in which the disability weight did not increase despite the increased number of cause of disease. For example, the disability weights of ‘allergic rhinitis’ and ‘atopic dermatitis’ were 0.087 and 0.231, respectively, but the disability weight was estimated to be 0.166 for both of these causes of disease. In order to validate the disability weight model in multimorbidity, further studies are needed considering the level of understanding of participants.
Another limitation is that physicians and medical students participating in the survey may not represent the preference for disease among all medical professionals. However, we tried to increase the number of survey participants and to include various specialist among survey participants. Therefore, it is expected that the disability weight derived from this study will not be significantly different from the judgment of the degree of disability of all medical professionals. Future disability weight studies need to involve more medical professionals with various specialties in the survey.
In conclusion, we have estimated 289 disability weights for causes of disease adapting the methodology of the KBD disability weight 2012 study. The disability weights estimated based on the severity can be used to estimate the more accurate burden of diseases. Furthermore, the disability weights from this study can be utilized to estimate health life expectancy, especially HALE, in Korea.

ACKNOWLEDGMENTS

The authors would like to thank Gallup Korea for help in conducting survey. The authors also are grateful to the survey participants.

Notes

Funding This study was supported by a grant from the Korean Health Technology R&D Project, Ministry of Health & Welfare, Republic of Korea (HI13C0729).

Disclosure The authors have no potential conflicts of interest to disclose.

Author Contributions

  • Conceptualization: Ock M, Park B, Park H, Oh IH, Yoon SJ, Cho B, Jo MW.

  • Data curation: Ock M, Park B, Park H, Oh IH, Yoon SJ, Cho B, Jo MW.

  • Formal analysis: Ock M, Jo MW.

  • Methodology: Ock M, Jo MW.

  • Validation: Ock M, Park B, Park H, Oh IH, Cho B, Jo MW.

  • Writing - original draft: Ock M, Park B, Park H, Oh IH, Yoon SJ, Cho B, Jo MW.

  • Writing - review & editing: Ock M.

References

1. Murray CJ, Salomon JA, Mathers C. A critical examination of summary measures of population health. Bull World Health Organ. 2000; 78(8):981–994.
pmid pmc
2. Hyder AA, Puvanachandra P, Morrow RH. Measuring the health of populations: explaining composite indicators. J Public Health Res. 2012; 1(3):222–228.
crossref
3. Oh IH, Yoon SJ, Kim EJ. The burden of disease in Korea. J Korean Med Assoc. 2011; 54(6):646–652.
crossref
4. Vos T, Abajobir AA, Abate KH, Abbafati C, Abbas KM, Abd-Allah F, et al. Global, regional, and national incidence, prevalence, and years lived with disability for 328 diseases and injuries for 195 countries, 1990–2016: a systematic analysis for the Global Burden of Disease Study 2016. Lancet. 2017; 390(10100):1211–1259.
pmid pmc
5. Ock M, Han JW, Lee JY, Kim SH, Jo MW. Estimating quality-adjusted life-year loss due to noncommunicable diseases in Korean adults through to the year 2040. Value Health. 2015; 18(1):61–66.
crossref pmid
6. Jo MW, Seo W, Lim SY, Ock M. The trends in health life expectancy in Korea according to age, gender, education level, and subregion: using quality-adjusted life expectancy method. J Korean Med Sci. 2019; 34:Suppl 1. e88.
crossref
7. Yoon J, Oh IH, Seo H, Kim EJ, Gong YH, Ock M, et al. Disability-adjusted life years for 313 disease and injuries: the 2012 Korean Burden of Disease Study. J Korean Med Sci. 2016; 31:Suppl 2. S146–S157.
8. Lee JY, Ock M, Kim SH, Go DS, Kim HJ, Jo MW. Health-adjusted life expectancy (HALE) in Korea: 2005–2011. J Korean Med Sci. 2016; 31:Suppl 2. S139–S145.
crossref
9. Gong YH, Yoon SJ, Jo MW, Kim A, Kim YA, Yoon J, et al. The burden of cancer in Korea during 2012: findings from a prevalence-based approach. J Korean Med Sci. 2016; 31:Suppl 2. S168–S177.
crossref
10. Lee WK, Lim D, Park H. Disability-adjusted life years (DALYs) for injuries using death certificates and hospital discharge survey by the Korean burden of disease study 2012. J Korean Med Sci. 2016; 31:Suppl 2. S200–S207.
crossref
11. Ock M, Lee JY, Oh IH, Park H, Yoon SJ, Jo MW. Disability weights measurement for 228 causes of disease in the Korean burden of disease study 2012. J Korean Med Sci. 2016; 31:Suppl 2. S129–S138.
crossref
12. Ock M, Ko S, Lee HJ, Jo MW. Review of issues for disability weight studies. Health Policy Manag. 2016; 26(4):352–358.
crossref
13. Salomon JA, Haagsma JA, Davis A, de Noordhout CM, Polinder S, Havelaar AH, et al. Disability weights for the Global Burden of Disease 2013 study. Lancet Glob Health. 2015; 3(11):e712–e723.
crossref
14. Haagsma JA, Maertens de Noordhout C, Polinder S, Vos T, Havelaar AH, Cassini A, et al. Assessing disability weights based on the responses of 30,660 people from four European countries. Popul Health Metr. 2015; 13(1):10.
crossref pmid pmc
15. Ock M, Ahn J, Yoon SJ, Jo MW. Estimation of disability weights in the general population of South Korea using a paired comparison. PLoS One. 2016; 11(9):e0162478.
crossref
16. Ock M, Yi N, Ahn J, Jo MW. How many alternatives can be ranked? A comparison of the paired comparison and ranking methods. Value Health. 2016; 19(5):655–660.
crossref
17. Haagsma JA, Polinder S, Cassini A, Colzani E, Havelaar AH. Review of disability weight studies: comparison of methodological choices and values. Popul Health Metr. 2014; 12(1):20.
crossref pmid pmc
18. Ock M, Jo MW, Gong YH, Lee HJ, Lee J, Sim CS. Estimating the severity distribution of disease in South Korea using EQ-5D-3L: a cross-sectional study. BMC Public Health. 2016; 16(1):234.
crossref pmid pmc
19. Burstein R, Fleming T, Haagsma J, Salomon JA, Vos T, Murray CJ. Estimating distributions of health state severity for the global burden of disease study. Popul Health Metr. 2015; 13(1):31.
crossref pmid pmc
20. Dolan P, Olsen JA, Menzel P, Richardson J. An inquiry into the different perspectives that can be used when eliciting preferences in health. Health Econ. 2003; 12(7):545–551.
crossref pmid
21. Salomon JA, Vos T, Hogan DR, Gagnon M, Naghavi M, Mokdad A, et al. Common values in assessing health outcomes from disease and injury: disability weights measurement study for the Global Burden of Disease Study 2010. Lancet. 2012; 380(9859):2129–2143.
pmid
22. Haagsma JA, van Beeck EF, Polinder S, Toet H, Panneman M, Bonsel GJ. The effect of comorbidity on health-related quality of life for injury patients in the first year following injury: comparison of three comorbidity adjustment approaches. Popul Health Metr. 2011; 9(1):10.
crossref
23. Hilderink HB, Plasmans MH, Snijders BE, Boshuizen HC, Poos MJ, van Gool CH. Accounting for multimorbidity can affect the estimation of the Burden of Disease: a comparison of approaches. Arch Public Health. 2016; 74(1):37.
crossref pmid pmc

SUPPLEMENTARY MATERIAL

Supplementary Table 1

Comparison of disability weights for overlapping causes of disease between this study and a previous study
TOOLS
ORCID iDs

Minsu Ock
https://orcid.org/0000-0001-9949-9224

Bomi Park
https://orcid.org/0000-0001-5834-9975

Hyesook Park
https://orcid.org/0000-0002-9359-6522

In-Hwan Oh
https://orcid.org/0000-0002-5450-9887

Seok-Jun Yoon
https://orcid.org/0000-0003-3297-0071

Bogeum Cho
https://orcid.org/0000-0003-4342-3436

Min-Woo Jo
https://orcid.org/0000-0002-4574-1318

Similar articles