

 PDF
PDF ePub
ePub Citation
 Print
Print


INTRODUCTION
Proving the presence of allergen-specific immunoglobulin E (sIgE) is essential for identification of culprit allergens.1 Traditionally, skin prick test (SPT) has been used as a reliable method to identify the presence of sIgE.2 However, SPT is not a quantitative test and is difficult to compare results among patients. Serologic sIgE measurement has advantages over SPT in these aspects, and it has been considered an effective alternative to SPT as well as radio-allergosorbent test, another recommended method for sIgE detecton.34 However, serologic sIgE measurement has certain disadvantages. The tests are usually based on total allergen extracts for the detection of sIgE, making it difficult to distinguish true sensitization from cross-reactivity of other allergens.5 For example, cross-reactive carbohydrate determinants that are antigen structures shared by allergenic components from taxonomically distant allergens give false positive results.6 Total allergen extracts also contain clinically irrelevant allergens such as easily denatured food allergens. To standardize total extracts is also a challenge, and inadequate standardization can cause insufficient concentration of clinically relevant major allergens in total extracts.7 These disadvantages can lead not only to false positives but also to false negative results. Therefore, labor-intensive oral food challenge (OFC) tests are required for accurate diagnosis of food allergies.8 However, food challenge test can result in side reactions such as anaphylaxis. Additionally, placebo-control is difficult during food challenge tests.
Recently, with biomolecular technological advances, identification of sIgEs to the major clinically relevant allergen components has become possible.910 Component-resolved diagnostics (CRD) is a better approach to the treatment of allergic patients as it facilitates the discrimination of clinically significant sIgE from irrelevant sIgE. CRD is also very helpful in selecting appropriate allergens when performing immunotherapy to polysensitize patients.11 Furthermore, it can help predict the prognosis of allergic patients.5
ImmunoCAP® (Thermo Fisher Scientific, Uppsala, Sweden), a gold standard method for quantitative sIgE measurement, is widely used to detect sIgE for allergenic components.12 However, because ImmunoCAP® is a singleplex assay, it is difficult to detect multiple allergens simultaneously and the cost per allergen is higher than that when using the multiplex assay. To solve this problem, the PROTIA™ Allergy-Q 64 Atopy® (Proteometech, Seoul, Korea) was developed by upgrading the PROTIA™ Allergy-Q, which is a multiplex sIgE measurement assay for total crude allergens.13 The PROTIA™ Allergy-Q 64 Atopy® is based on the enzyme immunoassay technique that uses nitrocellulose membrane as the solid-phase for allergen immobilization. It can detect sIgEs for 10 major allergen components (group 1 house dust mite [HDM], group 2 HDM allergens, Bet v 1, Fel d 1, Que a 1, α-lactalbumin, β-lactoglobulin, casein, ω-5 gliadin and α-Gal) in addition to 49 total crude allergen extracts.
This study aimed to validate the CRD concept of PROTIA™ Allergy-Q 64 Atopy® in comparison with ImmunoCAP®. This was the first study to validate the sIgE measurement ability of PROTIA™ Allergy-Q 64 Atopy®.
MATERIALS AND METHODS
Study participants
One hundred twenty-five Korean allergic patients who visited the Allergy and Asthma Center of Severance Hospital for the diagnosis and treatment of their allergic diseases were enrolled in this study. The enrolled patients were clinically diagnosed with allergic rhinitis or food allergy and did not have other chronic diseases such as autoimmune disease, cancer and chronic infections, or other immune-related disease. Blood samples were collected from all patients to perform diagnostic tests using the PROTIA™ Allergy-Q 64 Atopy® and the ImmunoCAP®. Severance Hospital Ethical Review Board approved this study (No. 4-2017-1258) and informed consent was waived.
Serum preparation and allergen selection
Five milliliters of whole blood was collected in a vacuum tube (Vacuette®; Greiner Bio-One GmbH, Kremsmünster, Austria) for serum separation. Serum was separated by centrifugation at 3,000 rpm for 5 minutes, then supernatant was aliquoted into several round bottom tubes (5-mL BD Falcon™ tubes; BD Bioscience Discovery Labware, Bedford, MA, USA), and stored at −76°C until use.
For detection of sIgE, Dermatophagoides farinae (Der f) 1 and Der f 2 were measured using the PROTIA™ Allergy-Q 64 atopy®, while Dermatophagoides pteronyssinus (Der p) 1 and Der p 2 were measured using the ImmunoCAP®.Other allergen components (Bet v 1, Fel d 1, Que a 1, α-lactalbumin, β-lactoglobulin, casein, ω-5 gliadin and α-Gal) were measured by both assays.
In vitro allergen sIgE measurements
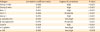
Both PROTIA™ Allergy-Q 64 Atopy® and the ImmunoCAP® were operated according to the manufacturers' instructions. The sIgEs for allergenic components that were adequate for clinical diagnosis were measured in each serum. Demographic data according to the allergenic components is shown in Table 1. The results of ImmunoCAP® were not provided to the person measuring sIgE using the PROTIA™ Allergy-Q 64 Atopy®. The sIgE detection limit of PROTIA™ Allergy-Q 64 Atopy® was 0.15 kUA/L, and that of ImmunoCAP® was 0.10 kUA/L. However, the sIgE classification of the 2 assays was identical (class 0, negative: below 0.35 kUA/L; class 1, 0.35–0.7 kUA/L; class 2, 0.7–3.5 kUA/L; class 3, 3.5–17.5 kUA/L; class 4, 17.5–50 kUA/L; class 5, 50–100 kUA/L; and class 6, above 100 kUA/L). The sIgE values ≥ 0.35 kUA/L were regarded as positive.
Table 1
Demographic characteristics of the study subjects according to allergen

![]()
Statistical analysis
Positive sIgE detection by the 2 assays was compared by χ2 test, and the degree of correlation was expressed as Cohen's kappa value (κ). Cohen's kappa values were categorized as almost perfect (0.8–1.0), substantial (0.6–0.8), moderate (0.4–0.6), fair (0.2–0.4) or poor correlations (below 0.2).14 Pearson correlation coefficient was used to make quantitative comparison, and the degree of correlation was expressed as a Pearson correlation coefficient value (r). Correlation coefficient values were categorized as very high positive (0.9–1.0), high positive (0.7–0.9), moderate positive (0.5–0.7), low positive (0.3–0.5), or negligible correlations (0.0–0.3).15 To evaluate the class consistency between the 2 assays (intra-class comparison), measured sIgE values were classified as mentioned above. Classes of each sIgE were compared by Spearman's rank correlation coefficient, and degree of correlation was expressed as Spearman's rho value (ρ). Spearman's rho values were categorized as very high positive correlation (0.9–1.0), high positive (0.7–0.9), moderate positive (0.5–0.7), low positive (0.3–0.5) or negligible (below 0.3).15 SPSS 23.0 (SPSS Inc., Chicago, IL, USA) was used to analyze the results.
RESULTS
Qualitative comparison between the 2 assays
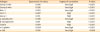
Comparing the positive results obtained using the PROTIA™ Allergy-Q 64 Atopy® and the ImmunoCAP®, at least 88% agreement rates (for β-lactoglobulin and casein) were seen between the 2 assays (Table 2). Group 1 HDM, α-Gal showed 100% agreement. In Cohen's kappa analysis, group 1 HDM allergens (κ = 1), group 2 HDM allergens (κ = 0.890), Bet v 1 (κ = 0.949), α-lactalbumin (κ = 0.915), ω-5 gliadin (κ = 0.865) and α-Gal (κ = 1) showed almost perfect correlation between the 2 assay results. Fel d 1 (κ = 0.795), Que a 1 (κ = 0.682), casein (κ = 0.694) and β-lactoglobulin (κ = 0.719) showed substantial correlation.
Table 2
Qualitative comparison of ImmunoCAP® and PROTIA™ Allergy-Q 64 Atopy®

Values are presented as number (%). For detection of sIgE to group 1, 2 mite allergens, Der p 1 and Der p 2 were measured by ImmunoCAP®, Der f 1 and Der f 2 by PROTIA™ Allergy-Q 64 atopy. The κ = Cohen's kappa coefficient, Cohen's kappa values were categorized as almost perfect (0.8–1.0), substantial (0.6–0.8), moderate (0.4–0.6), fair (0.2–0.4) or poor correlations (below 0.2).
Der p, Dermatophagoides pteronyssinus; Der f, Dermatophagoides farina; sIgE, specific immunoglobulin E.
*P < 0.05, †P < 0.001.
![]()
Quantitative comparison between the 2 assays
Quantitative comparison between the results obtained from the 2 assays showed significant correlation (Table 3). All 10 allergens showed more than moderate positive correlation (r > 0.640). Very high correlations were observed in cases of α-lactalbumin (r = 0.962), ω-5 gliadin (r = 0.926) and α-Gal (r = 0.926). High positive correlations were seen with group 1 HDM allergens (r = 0.899), group 2 HDM allergens (r = 0.817), Bet v 1 (r = 0.855), Que a 1 (r = 0.870) and casein (r = 0.808). Moderate positive correlation was observed with Fel d 1 (r=0.686) and β-lactoglobulin (r = 0.640).
Table 3
Quantitative comparison of ImmunoCAP® and PROTIA™ Allergy-Q 64 Atopy®
Pearson correlation coefficient was used to compare detection of sIgE between the PROTIA™ Allergy-Q 64 Atopy® with the ImmunoCAP®. The r = Pearson correlation coefficient value. Pearson correlation coefficient values were categorized as very high positive (0.9–1.0), high positive (0.7–0.9), moderate positive (0.5–0.7), low positive (0.3–0.5) or negligiblecorrelations (0.0–0.3).
![]()
Intra-class comparison between the 2 assays
While examining the class consistency in intra-class comparison, the 2 assays showed more than high intra-class correlation for all the 10 allergens (Table 4, Figure). Very high positive intra-class correlations were observed with group 1 HDM allergens (ρ = 0.976), group 2 HDM major allergens (ρ = 0.932), Bet v 1 (ρ = 0.953), α-lactalbumin (ρ = 0.926), ω-5 gliadin (ρ = 0.904) and α-Gal (ρ = 0.935). High intra-class correlations were seen with Fel d 1 (ρ = 0.897), Que a 1 (ρ = 0.743), β-lactoglobulin (ρ = 0.821) and casein (ρ = 0.879).
Table 4
Intra-class comparison of ImmunoCAP® and PROTIA™ Allergy-Q 64 Atopy®
Spearman's correlation coefficient was used to evaluate the class consistency between the PROTIA™ Allergy-Q 64 Atopy® and the ImmunoCAP®. Spearman's rho values were categorized as very high positive (0.9–1.0), high positive (0.7–0.9), moderate positive (0.5–0.7), positive (0.3–0.5) or negligible correlations (below 0.3).
![]()
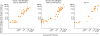 | FigureIntra-class comparison of ImmunoCAP® with PROTIATM Allergy-Q 64 Atopy®. Measured sIgEs were classified as class 0: below 0.35 kUA/L, class 1: 0.35-0.7 kUA/L, class 2: 0.7-3.5 kUA/L, class 3: 3.5-17.5 kUA/L, class 4: 17.5-50 kUA/L, class 5: 50-100 kUA/L and class 6: above 100 kUA/L. Statistical values for intra-class comparison are shown in Table 4. Der p, Dermatophagoides pteronyssinus; Der f, Dermatophagoides farina.
|
DISCUSSION
PROTIA™ Allergy-Q 64 Atopy® is a newly developed first CRD-based multiplex sIgE detection assay in Korea. The current study aimed to validate the IgE detection ability of the PROTIA™ Allergy-Q 64 Atopy® for 10 important inhalant and food allergen components in comparison with the commonly used singleplex ImmunoCAP® assay. Our observations indicated that the PROTIA™ Allergy-Q 64 Atopy® is effective in detection of sIgE to 10 allergen components (Der f 1, Der f 2, Bet v 1, Fel d 1, Que a 1, α-lactalbumin, β-lactoglobulin, casein, ω-5 gliadin and α-Gal).
Ten allergen components thought to be most important were selected to be measured in PROTIA™ Allergy-Q 64 Atopy®. HDMs are the one of the most common causes of respiratory allergy.16 Among them, Der f was reported as the dominant species in Korea.1718 Therefore, Der f 1 and Der f 2 were selected in PROTIA™ Allergy-Q 64 Atopy®. Birch and oak are the most common cause of pollinosis in Korea.1920 Because Bet v 1 is the major allergen of birch pollen, and Que a 1 is the major allergen of oak pollen, these are important for diagnosing seasonal respiratory allergy. In addition to this, Bet v 1 and Que a 1 belong to the pathogenesis-related protein class 10 (PR-10) family. The PR-10 family is common cause of oral allergy syndrome.21 Due to the instability of the causative allergen of oral allergy syndrome, it can be destroyed during the production of commercial food extracts. Thus, SPT using these extracts may show false negative results.22 Therefore, sIgEs for Bet v1 and Que a 1 can help clinicians diagnose oral allergy syndrome.23 Unlike the allergen components of dog, Fel d 1, the major allergen of cat, is known to be a useful allergen component for diagnosis.24 In addition, considering that pet allergy has been increasing worldwide, Fel d 1 is one of the important allergen components.25 The α-gal syndrome, allergy to red meat, is generally characterized by urticaria, angioedema, anaphylaxis, and gastrointestinal symptoms occurring 3–6 hours after ingesting red meat including beef, pork or lamb.26 SPT and sIgE for crude meat extracts such as beef, pork or lamb are known to be not valuable for the differential diagnosis of α-gal syndrome.27 Contrarily, sIgE for α-gal is known to have diagnostic value in α -gal syndrome.28 PROTIA™ Allergy-Q 64 Atopy® detects IgE for α-gal using bovine thyroglobulin (bTG). In a recent study, the specificity of IgE for α-gal (bTG) to diagnose red meat allergy was 92.3%.29 Cow's milk allergy is one of the most common food allergies in children.3031 There are 2 main proteins in cow's milk that can cause food allergy. Casein fraction accounts for 80% of milk protein and whey fraction accounts for 20%. Casein fraction (Bos d 8) consists of αS1-casein, αS2-casein, β-casein and κ-casein. PROTIA™ Allergy-Q 64 Atopy® can detect sIgE for Bos d 8. Whey fraction consists of α-lactalbumin, β-lactoglobulin, immunoglobulins, bovine serum albumin and traces of lactoferrin.31 Of these, α-lactalbumin and β-lactoglobulin are the most important allergens of the whey fraction. CRD-based diagnosis of milk allergy showed similar positive predictive value (PPV) and better negative predictive value (NPV) compared with total crude allergen-based diagnosis.32 Furthermore, according to the casein sIgE level, persistent milk allergy or milk tolerance, and allergic reaction to baked milk might be predicted.333435 Nevertheless, casein sIgE level cannot replace OFC test completely.3436 However, it might reduce unnecessary OFC in many cases.
In this study, all allergens showed good agreement rates for detection by both the assays. However, slight differences were observed in agreement rates according to the allergenic components. This may be due to some differences in the 3-dimensional (3D) structure of the allergens used to detect IgE in the PROTIA™ Allergy-Q 64 Atopy® and ImmunoCAP®.37 Many recombinant proteins having a sequence identical to its natural form have structures that differ from the native ones,38 and sIgE reactivity is influenced by the differences in the 3D structure of the molecule.39
In recent years, the diagnostic approach to detect allergic disease using CRD is being applied in clinical practice. Although ImmunoCAP® can detect sIgE to allergenic components, it provides only singleplex sIgE measurements. However, ImmunoCAP ISAC®, the currently available CRD-based multiplex sIgE measurement,40 can detect 112 molecular allergen components from 51 allergen sources. Although it has the advantage of high number of sIgE measurements, it requires considerable expertise in interpretation of the results obtained. In contrast, PROTIA™ Allergy-Q 64 Atopy® can detect 10 important major inhalant and food allergen components. Therefore, it is relatively easy to interpret the result and more feasible compared with ImmunoCAP ISAC®. Moreover, while the ImmunoCAP ISAC® measures sIgE only semi-quantitatively, the PROTIA™ Allergy-Q 64 Atopy® allows quantitative measurements of sIgE.
In Korea, multiplex sIgE measurement system is popular instead of singleplex, likely due to the reimbursement policy of the Korean Health Insurance Program, which only permits 6 singleplex sIgE measurements. Only in exceptional cases, for examples, children under 6 years old, 12 measurements have been permitted. Therefore, the multiplex sIgE system that can detect dozens of traditional sIgEs has been prescribed approximately 5 times more than the ImmunoCAP® for the last 5 years (2013–2017).41 Considering this real situation in Korea, PROTIA™ Allergy-Q 64 Atopy®, could be a useful CRD assay for Korean allergic patients.
The current study has some limitations. First, the HDM allergenic components were different between the 2 assays (PROTIA™ Allergy-Q 64 Atopy®, Der f 1 and Der f 2; ImmunoCAP®, Der p 1 and Der p 2). This is because ImmunoCAP® cannot detect allergen components of (Der f 1 and Der f 2). However, Der f 1 and Der p 1 share 81% of sequence identity, and Der f 2 and Der p 2 share 87% sequence identity,4243 Therefore, there is considerable cross reactivity within the group. Because of this, the comparison between Der f 1 with Der p 1 or Der f 2 with Der p 2 has clinical implications. Second, both assays have different detection limits (PROTIA™ Allergy-Q 64 Atopy®, 0.15 kUA/L; ImmunoCAP®, 0.10 kUA/L). However, in a clinical setting, sIgE levels below 0.35 kUA/L is not considered to be meaningful. Therefore, these differences in the detection limits have little clinical significance. Third, PROTIA™ Allergy-Q 64 Atopy® does not detect other important major allergenic components, such as components of peanut, hazelnut, wheat, soy and fruits. Therefore, there is a need for further improvement to increase the numbers of detectable allergenic components.44 Fourth, diagnosis of enrolled patients was not confirmed by provocation test. Therefore, sensitivity, specificity, PPV and NPV could not be calculated. However, comparison with ImmunoCAP®, the gold standard for quantitative sIgE measurement can provide sufficient clinical meaning. Therefore, despite the limitations, the results of this study are still valid.
In conclusion, this study showed that PROTIA™ Allergy-Q 64 Atopy® shows high agreement with the ImmunoCAP® assay in detecting molecular allergen components. PROTIA™ Allergy-Q 64 Atopy®, a multiplex assay for detecting sIgE based on molecular allergens, may be a reliable and cost-effective alternative to component resolved diagnosis of allergic patients.
 XML Download