Abstract
Objective
Methods
Results
References
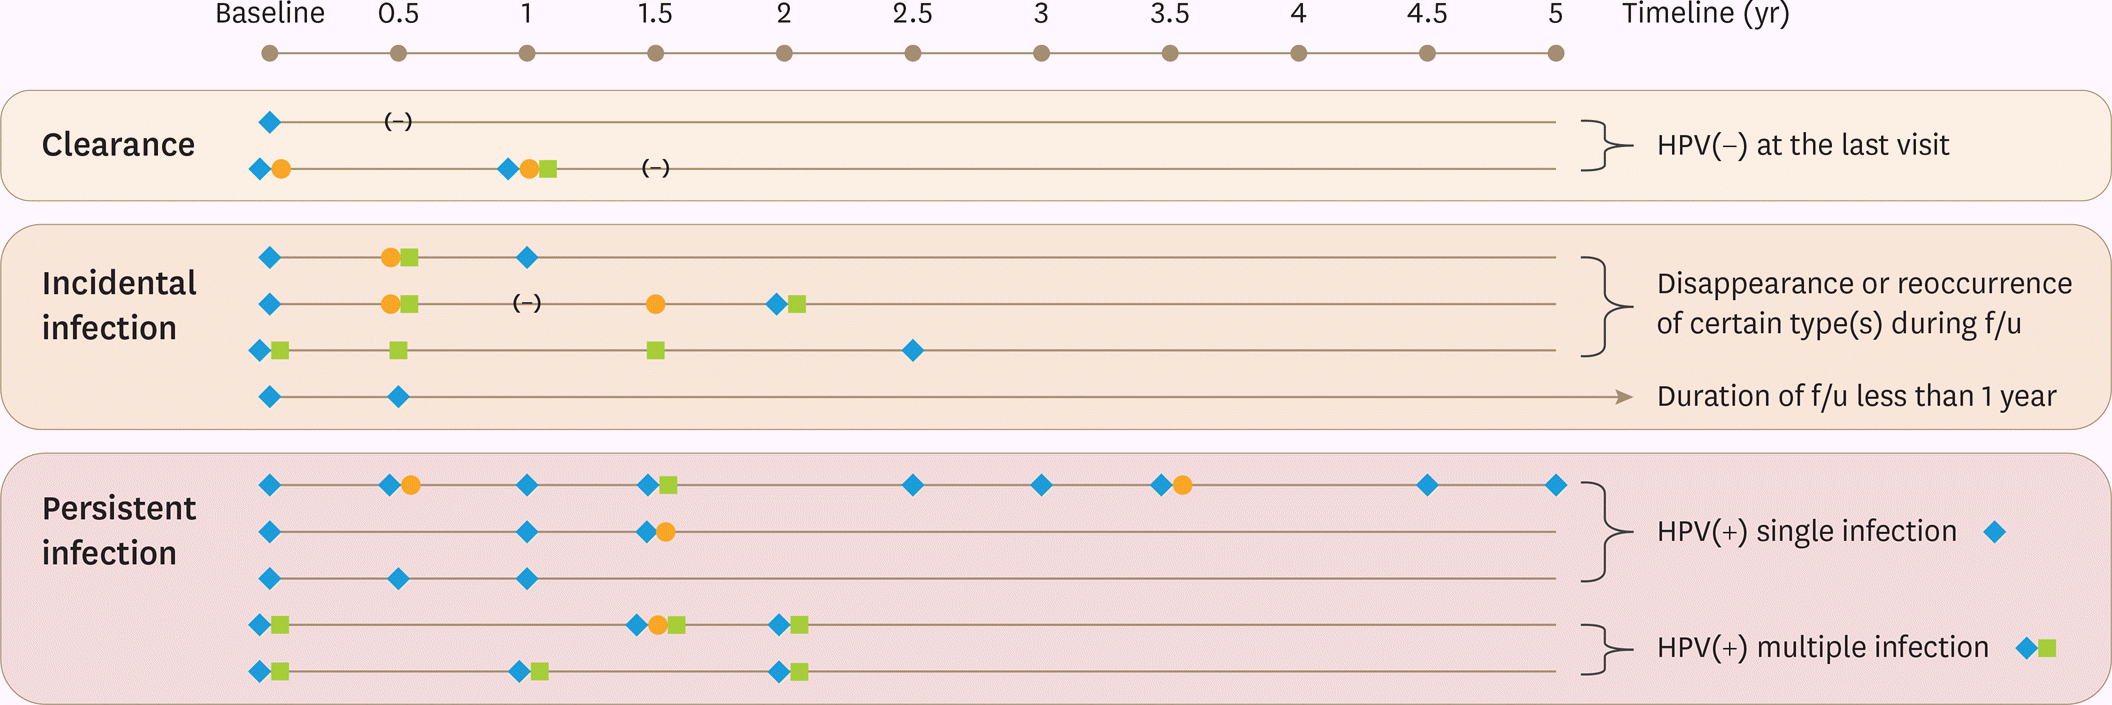
 | Fig. 1.Examples of infection patterns and their definitions. The symbols (eg. diamond, square, or circle) stand for different HPV genotype detected at the time of visit, and the notation of (−) stands for being negative without detecting any of HPV genotype. HPV, human papillomavirus. |
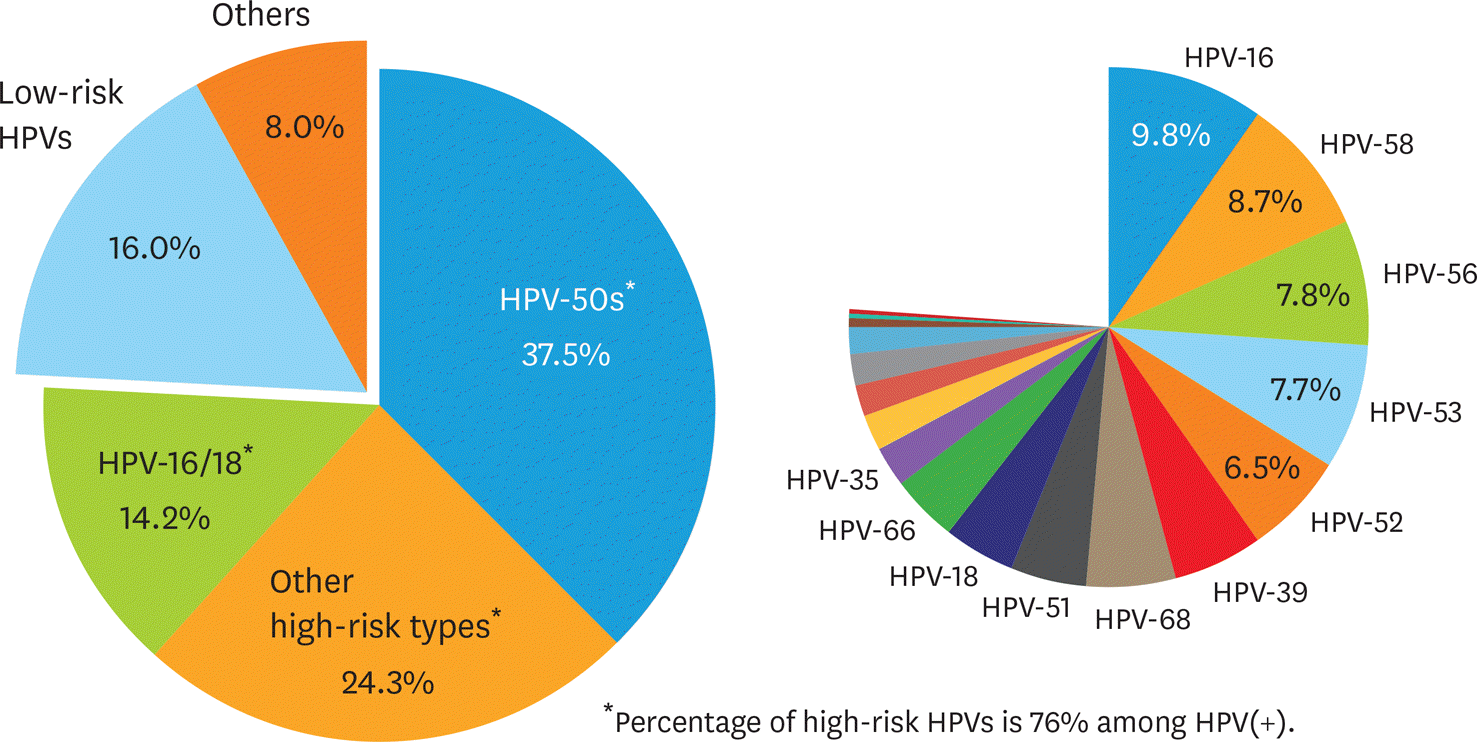
 | Fig. 2.Distribution of HPVs among ASCUS or LSIL cases. ASCUS, atypical squamous cells of undetermined significance; HPV, human papillomavirus; LSIL, low-grade squamous intraepithelial lesion. * Detailed percentages of high-risk HPVs: HPV-16 (9.8%), HPV-58 (8.7%), HPV-56 (7.8%), HPV-53 (7.7%), HPV-52 (6.5%), HPV-39 (5.6%), HPV-68 (5.3%), HPV-51 (4.9%), HPV-18 (4.4%), HPV-66 (4.1%), HPV-35 (2.5%), HPV-31 (2.3%), HPV-33 (2.0%), HPV-59 (2.0%), HPV-45 (1.5%), HPV-82 (0.6%), HPV-69 (0.3%), HPV-26 (0.2%), and HPV-73 (0.1%). |
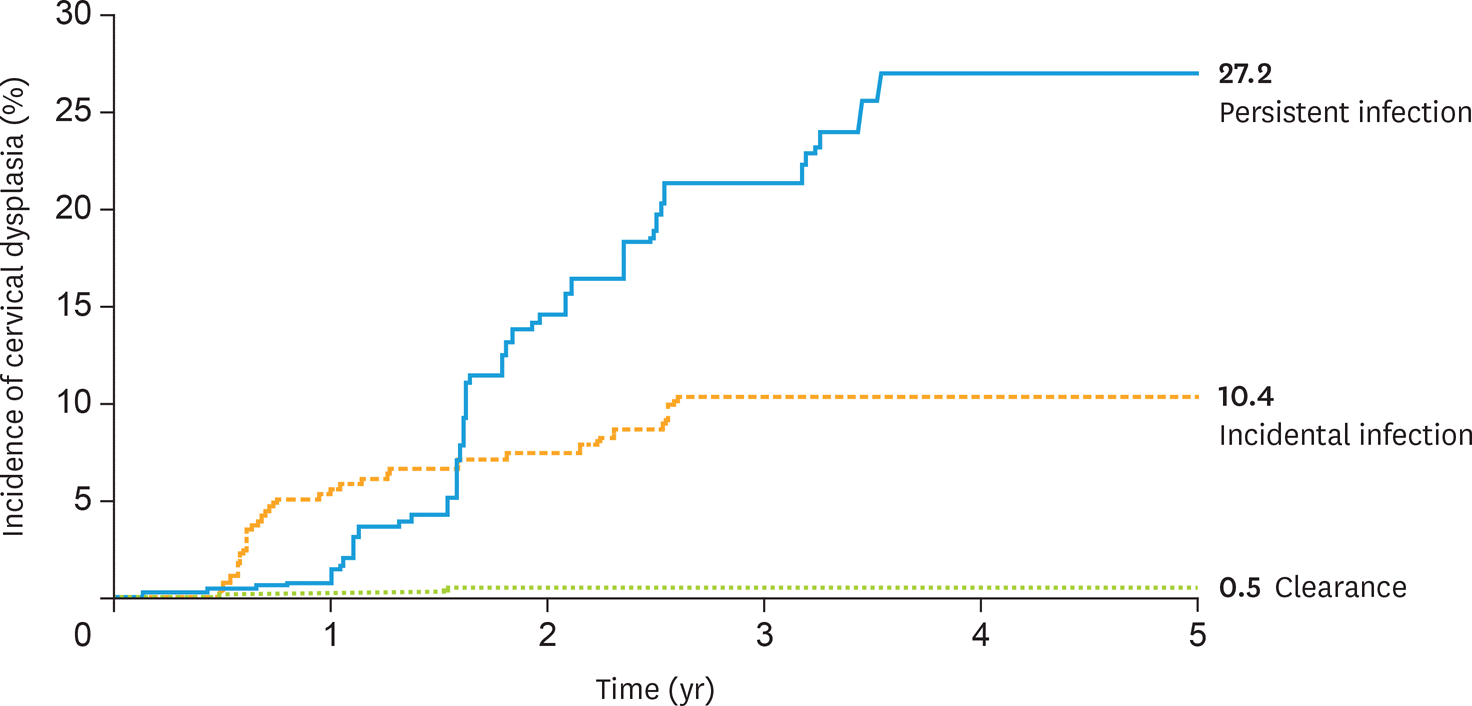
 | Fig. 3.Cumulative incidence of cervical dysplasia based on HPV infection patterns during follow-up in the Korea HPV cohort, 2010–2017. HPV, human papillomavirus. |
Table 1.
| Variables | All (n=1,027) | Persistent infection (n=144) | Incidental infection (n=474) | Clearance (n=409) | p-value* |
|---|---|---|---|---|---|
| Follow-up (yr) | 3.06±1.54 | 3.01±1.37 | 2.63±1.56 | 3.58±1.41 | <0.001 |
| Age (yr) | 40.57±9.64 | 42.93±9.90 | 40.58±9.96 | 39.73±9.04 | 0.003 |
| Age group | 0.001 | ||||
| 20–29 | 167 (16.26) | 18 (12.50) | 86 (18.14) | 63 (15.40) | |
| 30–39 | 297 (28.92) | 33 (22.92) | 122 (25.74) | 142 (34.72) | |
| 40–49 | 350 (34.08) | 51 (35.42) | 159 (33.54) | 140 (34.23) | |
| ≥50† | 213 (20.74) | 42 (29.17) | 107 (22.57) | 64 (15.65) | |
| BMI | 21.77±2.81 | 21.97±2.82 | 21.75±2.76 | 21.72±2.85 | 0.637 |
| Marital status | 0.024 | ||||
| Co-habitation | 650 (63.35) | 102 (71.33) | 277 (58.44) | 271 (66.26) | |
| Separation | 123 (11.99) | 14 (9.79) | 68 (14.35) | 41 (10.02) | |
| Single | 253 (24.66) | 27 (18.88) | 129 (27.22) | 97 (23.72) | |
| Education | 0.184 | ||||
| ≤highschool level | 408 (39.73) | 66 (45.83) | 190 (40.08) | 152 (37.16) | |
| ≥college level | 619 (60.27) | 78 (54.17) | 284 (59.92) | 257 (62.84) | |
| Job | 0.356 | ||||
| Manager/head | 250 (24.34) | 32 (22.22) | 118 (24.89) | 100 (24.45) | |
| Professionals | 186 (18.11) | 28 (19.44) | 78 (16.46) | 80 (19.56) | |
| Business/service | 211 (20.55) | 24 (16.67) | 108 (22.78) | 79 (19.32) | |
| Housekeeping | 331 (32.23) | 53 (36.81) | 142 (29.96) | 136 (33.25) | |
| Unemployed/student | 49 (4.77) | 7 (4.86) | 28 (5.91) | 14 (3.42) | |
| Monthly income ($) | 0.219 | ||||
| <2,000 | 133 (12.95) | 20 (13.89) | 64 (13.50) | 49 (11.98) | |
| 2,000–5,000 | 448 (43.62) | 66 (45.83) | 208 (43.88) | 174 (42.54) | |
| ≥5,000 | 382 (37.20) | 50 (34.72) | 164 (34.60) | 168 (41.08) | |
| Don't know | 64 (6.23) | 8 (5.56) | 38 (8.02) | 18 (4.40) | |
| Smoking‡ | 0.310 | ||||
| No | 881 (85.78) | 128 (88.89) | 399 (84.18) | 354 (86.55) | |
| Yes | 146 (14.22) | 16 (11.11) | 75 (15.82) | 55 (13.45) | |
| Drinking | 0.041 | ||||
| No | 244 (23.73) | 41 (28.47) | 103 (21.73) | 100 (24.51) | |
| Not currently (yes) | 64 (6.24) | 5 (3.47) | 24 (5.06) | 35 (8.58) | |
| Currently (yes) | 718 (69.98) | 98 (68.06) | 347 (73.21) | 273 (66.91) | |
| Regular exercise | |||||
| No | 583 (56.77) | 75 (52.08) | 262 (55.27) | 246 (60.15) | |
| Yes | 444 (43.23) | 69 (47.92) | 212 (44.73) | 163 (39.85) | |
| Pregnancy | 0.437 | ||||
| No | 224 (21.81) | 27 (18.75) | 111 (23.42) | 86 (21.03) | |
| Yes | 803 (78.19) | 117 (81.25) | 363 (76.58) | 323 (78.97) | |
| No. of offspring(s) | 0.094 | ||||
| None | 93 (11.58) | 15 (12.82) | 43 (11.85) | 35 (10.84) | |
| 1 | 188 (23.41) | 18 (15.38) | 77 (21.21) | 93 (28.79) | |
| 2 | 429 (53.42) | 68 (58.12) | 198 (54.55) | 163 (50.46) | |
| 3+ | 93 (11.58) | 16 (13.68) | 45 (12.40) | 32 (9.91) | |
| Menopause | 0.001 | ||||
| No | 851 (82.94) | 106 (73.61) | 390 (82.28) | 355 (87.01) | |
| Yes | 175 (17.06) | 38 (26.39) | 84 (17.72) | 53 (12.99) | |
| Contraceptive use | 0.908 | ||||
| No | 633 (61.64) | 91 (63.19) | 292 (61.60) | 250 (61.12) | |
| Yes | 394 (38.36) | 53 (36.81) | 182 (38.40) | 159 (38.88) | |
| Oral contraceptive use | 0.011 | ||||
| No | 861 (83.84) | 127 (88.19) | 380 (80.17) | 354 (86.55) | |
| Yes | 166 (16.16) | 17 (11.81) | 94 (19.83) | 55 (13.45) | |
| Cumulative No. of sex partner(s) | 0.049 | ||||
| 1 | 407 (39.71) | 68 (47.22) | 173 (36.58) | 166 (40.69) | |
| 2–3 | 368 (35.90) | 44 (30.56) | 164 (34.67) | 160 (39.22) | |
| 4–5 | 157 (15.32) | 22 (15.28) | 80 (16.91) | 55 (13.48) | |
| 6+ | 61 (5.95) | 7 (4.86) | 38 (8.03) | 16 (3.92) | |
| No response | 32 (3.12) | 3 (2.08) | 18 (3.81) | 11 (2.70) | |
| HPV vaccination | 0.651 | ||||
| No | 752 (73.22) | 110 (76.39) | 345 (72.78) | 297 (72.62) | |
| Yes | 275 (26.78) | 34 (23.61) | 129 (27.22) | 112 (27.38) | |
| No. of HPV vaccination | 0.568 | ||||
| 1 | 53 (5.16) | 8 (5.56) | 20 (4.22) | 25 (6.11) | |
| 2 | 40 (3.89) | 7 (4.86) | 20 (4.22) | 13 (3.18) | |
| 3 | 182 (17.72) | 19 (13.19) | 89 (18.78) | 74 (18.09) |
Data are presented as the mean±standard deviation for continuous variables and number (percentage) for categorical variables. BMI, body mass index; HPV, human papillomavirus.
Table 2.
| Covariates* | HPV infection patterns (No. per 1,000 person-years) | ||
|---|---|---|---|
| Persistent infection (n=30) | Incidental infection (n=39) | ) Clearance (n=2) | |
| Incidence of cervical dysplasia | 76.2 | 31.2 | 1.4 |
| Age group (yr) | |||
| 20–29 | 75.4 | 21.9 | 4.8 |
| 30–39 | 46.3 | 29.9 | 2.0 |
| 40–49 | 76.6 | 50.9 | 0 |
| ≥50 | 62.2 | 13.1 | 0 |
| Marital status | |||
| Co-habitation | 65.9 | 38.1 | 0 |
| Separation | 93.3 | 24.6 | 0 |
| Single | 61.9 | 20.8 | 6.1 |
| Drinking experience | |||
| Currently (yes) | 78.1 | 25.8 | 0 |
| Not currently (yes) | 0 | 111.5 | 0 |
| No | 56.5 | 35.2 | 5.7 |
| Menopause | |||
| Yes | 56.4 | 17.0 | 0 |
| No | 74.4 | 34.6 | 1.6 |
| Oral contraceptive use | |||
| Yes | 141.1 | 11.3 | 0 |
| No | 61.4 | 34.2 | 1.6 |
| Cumulative number of sex partner(s) | |||
| 1 | 59.0 | 43.5 | 0 |
| 2–3 | 81.4 | 25.2 | 1.8 |
| 4–5 | 74.2 | 18.9 | 5.4 |
| 6+ | 0 | 21.3 | 0 |
Table 3.
| HPV infection patterns* | Subjects | CIN 2+ | Crude | Adjusted‡ | ||
|---|---|---|---|---|---|---|
| HR | 95% CI | HR | 95% CI | |||
| Clearance | 409 | 2 | 1.0 | |||
| Incidental infection† | 474 | 39 | 21.5 | 5.1–88.9 | 24.1 | 5.7–100.2 |
| Low-risk HPV detected at last visit | 100 | 3 | 1.7 | 0.1–18.6 | 1.7 | 0.1–19.3 |
| High-risk HPV detected at last visit | 238 | 35 | 40.9 | 9.8–169.8 | 47.2 | 11.2–197.6 |
| Single infection | 196 | 27 | 38.1 | 9.1–160.3 | 44.6 | 10.5–188.5 |
| Multiple infection | 42 | 8 | 54.1 | 11.4–254.7 | 61.1 | 12.6–294.8 |
| High/low-risk HPV detected at last visit (mixed) | 136 | 1 | 8.2 | 1.3–49.1 | 1.8 | 0.2–19.3 |
| Persistent infection | 144 | 30 | 47.0 | 11.2–196.8 | 51.6 | 12.2–217.5 |
| Persistent with high-risk HPV | 126 | 29 | 51.8 | 12.3–217.1 | 57.1 | 13.5–240.8 |
| Single infection | 77 | 17 | 49.1 | 11.3–212.6 | 52.9 | 12.0–232.1 |
| Multiple infection | 49 | 12 | 56.2 | 12.5–251.0 | 63.5 | 14.1–285.3 |
| HPV type 16/18 | 31 | 10 | 74.2 | 16.2–338.8 | 83.0 | 17.6–390.1 |
| Single infection | 17 | 6 | 80.9 | 16.3–400.8 | 77.2 | 14.6–405.8 |
| Multiple infection | 14 | 4 | 66.1 | 12.1–360.9 | 95.1 | 16.8–536.9 |
| HPV type 50s | 60 | 10 | 38.4 | 8.4–175.2 | 42.3 | 9.1–195.0 |
| Single infection | 40 | 7 | 40.7 | 8.4–195.7 | 44.8 | 9.1–218.5 |
| Multiple infection | 20 | 3 | 34.0 | 5.6–203.4 | 36.7 | 6.0–223.3 |
| Other types | 35 | 9 | 54.8 | 11.8–253.7 | 61.6 | 13.2–287.1 |
| Single infection | 20 | 4 | 40.2 | 7.3–219.6 | 49.2 | 8.8–274.0 |
| Multiple infection | 15 | 5 | 77.3 | 14.9–398.5 | 77.2 | 14.8–401.9 |
| Persistent with low-risk HPV | 18 | 1 | 12.5 | 1.1–137.5 | 13.0 | 1.1–144.9 |
CI, confidence interval; CIN, cervical intraepithelial neoplasia; CIN 2+, more severe than cervical intraepithelial neoplasia 2; HPV, human papillomavirus; HR, hazard ratio.
† Low-risk HPV including 9 HPV types including HPV-6, HPV-11, HPV-40, HPV-42, HPV-43, HPV-44, HPV-54, HPV-61, and HPV-70 and high-risk HPV including 19 HPV types including HPV-16, HPV-18, HPV-26, HPV-31, HPV-33, HPV-35, HPV-39, HPV-45, HPV-51, HPV-52, HPV-53, HPV-56, HPV-58, HPV-59, HPV-66, HPV-68, HPV-69, HPV-73, and HPV-82;


 PDF
PDF Citation
 Print
Print


 XML Download