

 PDF
PDF ePub
ePub Citation
 Print
Print


INTRODUCTION
The severity of chronic obstructive pulmonary disease (COPD) is measured in terms of spirometry airflow measures or pulmonary function test (PFT) results. The ratio of forced expiratory volume in one second (FEV1) to forced vital capacity (FVC) is between 70% and 80% in normal healthy adults. Values less than 70% of the predicted value are associated with respiratory dysfunction, such as that in COPD. In patients with COPD, predicted FEV1/FVC < 70% and FEV1 ≥ 80% denotes mild COPD; predicted FEV1 < 80% denotes moderate COPD; predicted FEV1 < 50% denotes severe COPD; and predicted FEV1 < 30% or < 50% with chronic respiratory failure denotes very severe COPD (1). As disease severity increases, the patient's quality of life decreases and exacerbation may occur. Although PFT results are routinely used as the gold standard for the diagnosis of COPD, there are several limitations of this technique. Not all patients can perform PFT because of general weakness or respiratory problems. In addition, non-pulmonary conditions, such as congestive heart failure or neuromuscular disorders, may also affect PFT results (23).
Quantitative computed tomography (CT) parameters, including lung attenuation areas, have been suggested as predictive markers of pulmonary function in patients with COPD (45). Models that predict pulmonary function using quantitative CT parameters may be helpful in patients with COPD who cannot undergo PFT. However, a recent study has shown that PFT results are not linearly correlated with CT lung attenuation areas in patients with COPD (6). In this study, it was found that airflow obstruction (FEV1/vital capacity) is better correlated with CT attenuation values in patients with milder parenchymal destruction, whereas the percentage of predicted diffusing capacity of the lungs for carbon monoxide (DLCO) is better correlated with CT attenuation values in patients with severe parenchymal destruction. This might be attributed to the heterogeneous nature of COPD accompanied by airway impairment and emphysema, which may contribute to CT lung attenuation. While the previous study correlated PFT data with CT lung attenuation values, in this study, we investigated whether CT parameters, including parenchymal attenuation parameters (inspiratory mean lung density [MLD], CT air-trapping index [ATI] to represent the ratio of MLD at full expiration and inspiration, and emphysema index [EI]) and airway parameters (lumen diameter, wall thickness, wall area percentage [WA%] and the square root of wall area of a hypothetical airway with an internal perimeter of 10 mm [Pi10]), can be used to predict PFT results. We also examined nonlinear correlations among CT parameters according to disease severity. The aim was to determine whether CT parameters can be used as predictors of PFT indices in COPD patients.
MATERIALS AND METHODS
Patients
Between June 2005 and October 2013, we enrolled 381 patients who were diagnosed with COPD in the Korean Obstructive Lung Disease Cohort Study (7). This prospective study was approved by the Institutional Review Board of Asan Medical Center (approval number: 2005-0345) and of the other 16 participating hospitals. Informed consent was obtained from all patients who participated in the study. COPD was diagnosed based on the Global Initiative for Chronic Obstructive Lung Disease (GOLD) criteria. All patients had airflow limitation that was not fully reversible (predicted post-bronchodilator FEV1/FVC < 70%) and a smoking history of > 10 pack-years. We excluded 11 patients with parenchymal sequelae from previous infections, such as old pulmonary tuberculosis, that could affect the quantitative CT measurements. A total of 370 consecutive patients (male:female = 361:9; GOLD I, n = 117; GOLD II, n = 139; GOLD III, n = 98; and GOLD IV, n = 16) were included in the final analysis. Since GOLD I and II are considered as early stages of COPD and a previous study showed that symptoms of chronic bronchitis are related to a poor prognosis in these stages (8), patients with GOLD I and II COPD were grouped into one group for evaluation of CT parameters that reflect the characteristics of chronic bronchitis. In addition, GOLD III and IV were combined into one group because of the small number of patients with GOLD stage IV (n = 16). In short, the patients were divided into two groups according to COPD severity, as categorized by the GOLD staging system-Group 1 (GOLD I and II, n = 256) and Group 2 (GOLD III and IV, n = 114)-for multiple linear regression analysis to identify the quantitative CT parameters that can be used as predictors of PFT indices.
Pulmonary Function Test and Clinical Parameters
The patients underwent PFTs within 1 week of CT examination. We used a mass-flow sensor and multi-gas analyzer (V6200 Autobox Body Plethysmograph; SensorMedics, Yorba Linda, CA, USA). PFTs included pre- and post-bronchodilator spirometry, measurement of lung volumes, and measurement of DLCO using the single-breath method, as described by the American Thoracic Society-European Respiratory Society guidelines (91011). Spirometric values were presented as a percentage of the measured to the predicted value. In addition to PFT indices, clinical parameters were also evaluated, including body mass index (BMI), exercise capacity as measured using the six-minute walk test, and pre- and post-exercise oxygen saturation measured by pulse oximetry.
CT Techniques and Quantitative Parameters
We performed volumetric chest CT scans at full inspiration and expiration for all patients using 16- or 64-multidetector CT scanners (Somatom Sensation 16 or Definition AS, Siemens Healthineers, Erlangen, Germany; Philips Brilliance 40 or 64, Philips Medical System, Best, the Netherlands). Prior to each CT scan, we instructed all patients on how to perform a full inspiration or full expiration during CT examination and provided them repeated opportunities to practice. Scan parameters were as follows: tube voltage, 120 or 140 kV; tube current, 100–135 effective mA with dose modulation; slice thickness and reconstruction intervals, 0.6–0.8 mm. All images were analyzed using automatic segmentation software (Aview, Coreline Soft, Seoul, Korea). We measured whole lung volume at inspiration and expiration, EI (i.e., the percentage of lung area with CT attenuation values < −950 HU in the whole lung at inspiration), ATI, airway luminal diameter, wall thickness, WA%, and standardized airway wall thickness (Pi10). The median number (interquartile range) of segmented bronchi in all patients was 82 (56–124). We used the integral-based half-band method to measure peripheral airway dimensions (12). All quantitative parameters were measured using software operated by radiological technicians with 2-5 years of experience in image analysis and post-processing.
Data Analysis
Clinical characteristics, including PFT indices, and quantitative CT parameters were compared according to GOLD criteria using ANOVA. We evaluated the correlations among CT parameters, six-minute walk test results, and spirometry data, including FEV1/FVC, FEV1 and DLCO, using the Pearson correlation method. To identify the quantitative CT parameters that can be used as predictors of PFT indices, we performed a multiple linear regression analysis with step-wise selection method. Quantitative CT parameters, including EI, inspiratory MLD, airway wall thickness, and Pi10, and BMI were used as independent variables in the multiple regression analyses to avoid multicollinearity. PFT indices, including FEV1/FVC and FEV1, were used as dependent variables. Analyses were performed for the entire study sample and for the subgroups (i.e., Groups 1 and 2). P values < 0.05 indicated statistical significance. Statistical analyses were performed using commercial software ver. 21 (IBM Corp., Armonk, NY, USA).
RESULTS
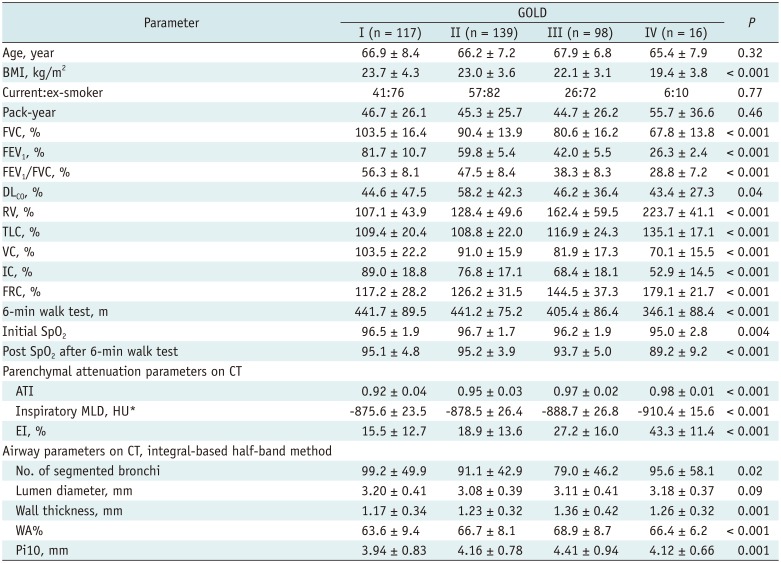
Clinical data, including age, BMI, smoking status, pack-year history, and PFT results, are shown in Table 1 for all patients stratified by GOLD stages. The BMI decreased with increase in GOLD stage (p < 0.001). No between-group difference was observed in age or smoking status. As the GOLD stage increased, the PFT values and mean six-minute walk test results gradually deteriorated (p < 0.001). Parenchymal attenuation parameters were also significantly worse for patients with higher GOLD stages. The airway wall thickness and Pi10 in patients with GOLD III and IV were greater than those in patients with GOLD I and II (p = 0.001). The airway wall thickness and Pi10 in patients with GOLD III were greater than those in patients with GOLD IV; however, the number of GOLD IV patients was only 16, and the differences were not statistically significant (p = 0.23 and p = 0.24, respectively).
Correlation between CT Parameters and PFT Results
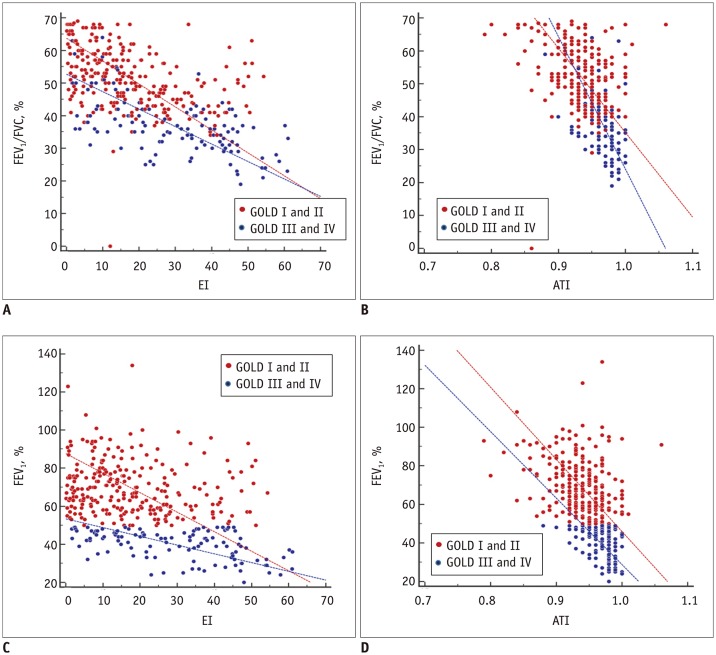
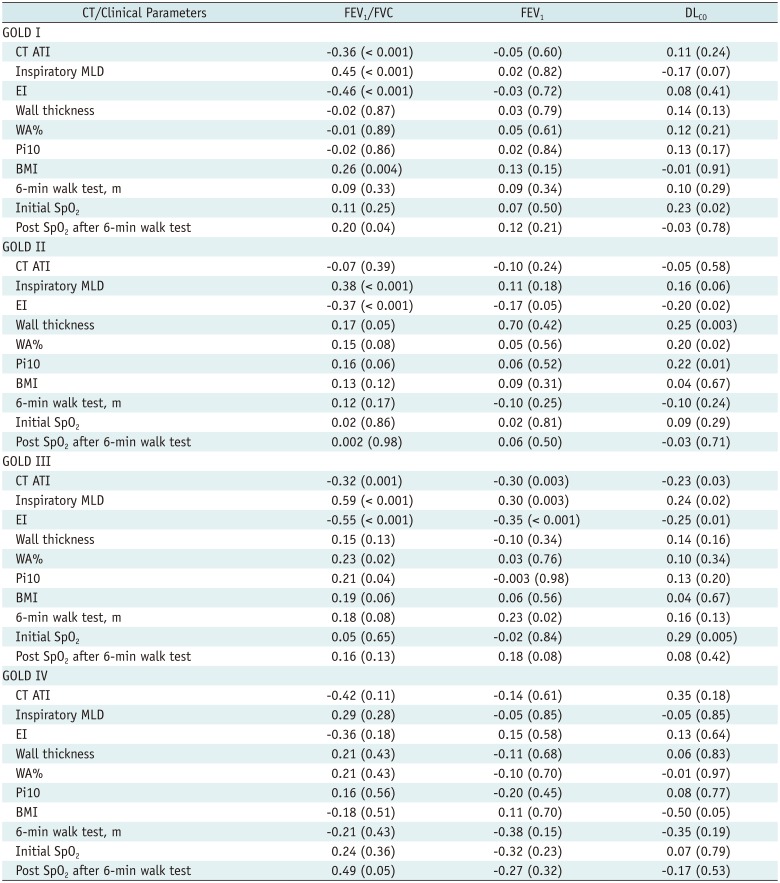
The correlations between quantitative CT parameters and PFT indices (FEV1/FVC, FEV1, and DLCO) are presented in Table 2. Inspiratory MLD and EI showed significant, mild-to-moderate correlation with FEV1/FVC and FEV1 in patients with GOLD I, II, and III. Pi10 demonstrated mild correlation with FEV1/FVC in patients with GOLD II and III, but with marginal significance. Figure 1 illustrates the relationships between parenchymal attenuation parameters and FEV1/FVC or FEV1. DLCO showed mild correlations with CT parenchymal attenuation parameters in all subgroups.
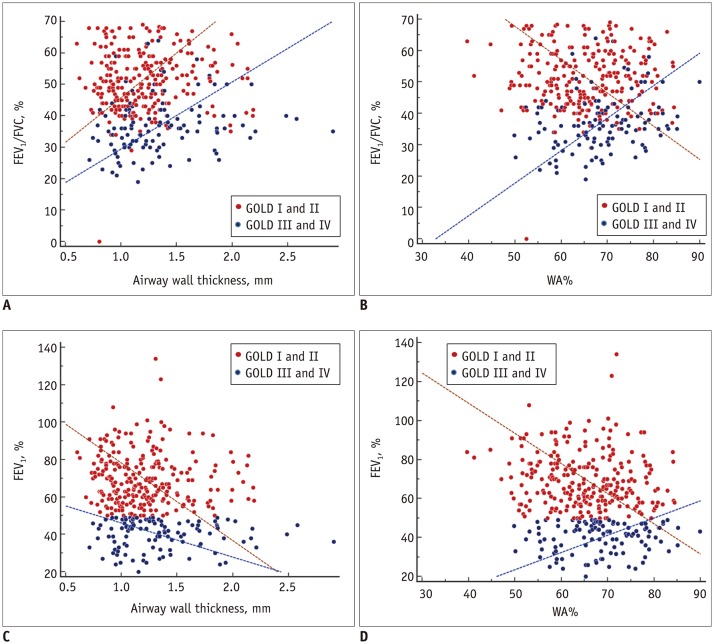
Airway parameters on CT were weakly correlated with PFT results. Pi10 showed a mild correlation with FEV1/FVC in patients with GOLD II and III. The relationships between PFT indices and airway parameters are shown in Figure 2; these were nonlinearly correlated, depending on COPD severity. Scatter plots to demonstrate the distributions of the four GOLD stages are included in Supplementary Figures 1 and 2 in the online-only Data Supplement.
Quantitative CT Parameters
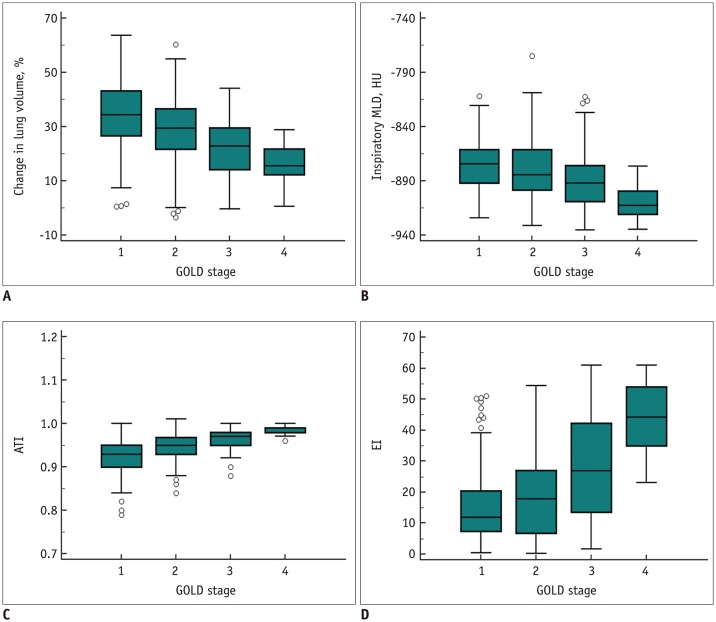
Table 1 shows the quantitative CT parameters for all study participants. CT ATI and inspiratory MLD deteriorated significantly with increasing GOLD stage (p < 0.001). Similarly, EI was higher in patients with GOLD III and IV, indicating more severe emphysema (p < 0.001). The trends of changes in lung volume ([inspiratory volume − expiratory volume] / inspiratory volume × 100), inspiratory MLD, ATI, and EI according to GOLD stages are presented in Figure 3. With the increase in GOLD stage, changes in lung volume, inspiratory MLD, and ATI decreased, whereas EI increased. Among airway parameters, wall thickness, WA%, and Pi10 were highest in patients with GOLD III (p < 0.05).
Multiple Regression Analysis
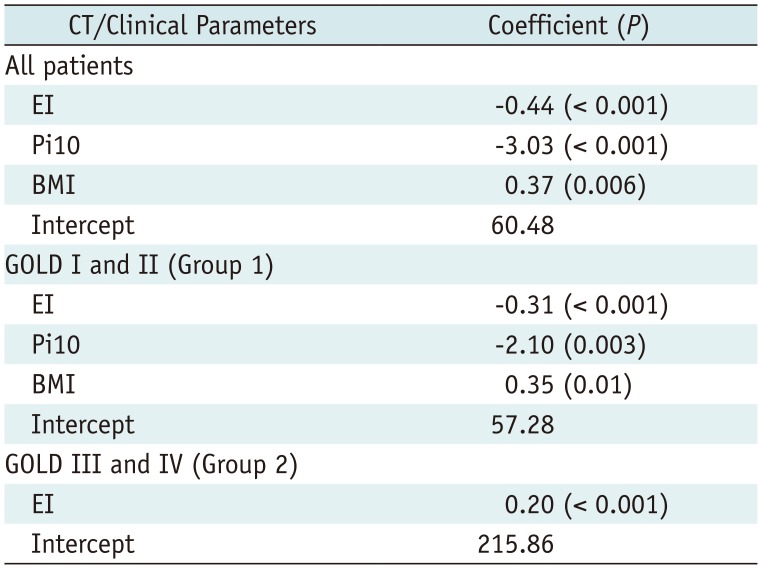
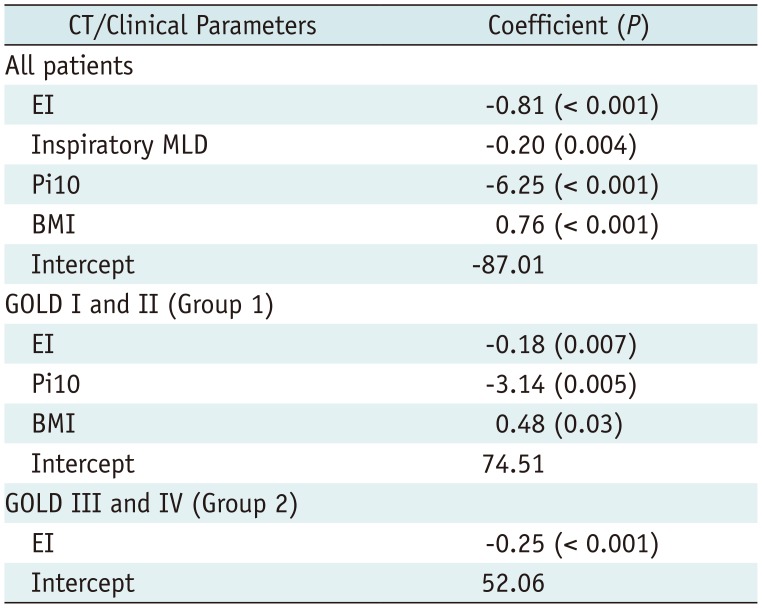
Tables 3 and 4 show the results of multiple linear regression analysis of CT parameters for predicting FEV1/FVC or FEV1 in the entire study sample and in the subgroups. The stepwise algorithm indicated that both parenchymal attenuation and airway parameters, including EI, Pi10, and BMI, were predictive of FEV1/FVC (R2 = 0.38, p < 0.001) in the entire study sample. Similarly, EI, Pi10, and BMI were identified as predictors of FEV1/FVC (R2 = 0.22, p < 0.001) in Group 1 patients. However, only a parenchymal attenuation parameter, EI, was identified as a predictor of FEV1/FVC (R2 = 0.37, p < 0.001) in Group 2 patients. Similar results were obtained for FEV1. CT parenchymal attenuation parameters (EI and inspiratory MLD in the entire study sample and EI in Group 1) and an airway parameter (Pi10) were identified as predictors of FEV1 in the entire study sample and in Group 1 (R2 = 0.28, p < 0.001 and R2 = 0.06, p < 0.001, respectively); however, only a parenchymal attenuation parameter, EI, was identified as a predictor of FEV1 in Group 2 (R2 = 0.25, p < 0.001).
DISCUSSION
The CT parameters were not linearly correlated with the PFT indices, stratified according to disease severity. CT parameters, including EI, inspiratory MLD, and Pi10, as well as BMI can be used to predict FEV1/FVC and FEV1. The relationships between the airway parameters and PFT indices were not linear but changed depending on COPD severity (GOLD I and II versus GOLD III and IV). In the multiple linear regression analysis, airway parameters and parenchymal attenuation parameters were identified as predictors of FEV1/FVC or FEV1 in Group 1. However, airway parameters did not predict FEV1/FVC or FEV1 in Group 2. Pi10 showed a weak but significant positive correlation with FEV1/FVC in GOLD II and III patients, indicating that bronchial wall thickness increased with improvement in pulmonary function. This might be explained by the dominant emphysema components that mask the impact of diminished airway dysfunction in severe COPD (GOLD III and IV). This result was consistent with the idea that COPD is a heterogeneous disease that combines airway inflammation and parenchymal destruction manifesting as emphysema (613).
COPD severity is not entirely defined according to expiratory airflow limitations and GOLD stages (1415). Airflow limitation is weakly correlated with patients' symptoms, including breathlessness, exercise capacity, health status, combined co-morbidities, and exacerbation (14). Even though the severity of emphysema on CT increases with the increase in GOLD stage (5), patients with identical GOLD stages may demonstrate different findings on CT (1617). A large multicenter study (COPDGene) evaluating the accuracy of GOLD stages in diagnosing airflow obstruction as demonstrated on CT showed that FEV1/FVC and FEV1 do not reflect the severity of quantitative CT parameters accurately (18). Similarly, the heterogeneous nature of COPD cannot be explained by quantitative CT parameters alone. However, accurate quantitative measurements of the extent of emphysema and airway wall changes on CT could help characterize lung impairment in patients with COPD.
Smoking is considered to be a factor affecting airway wall thickening prior to the development of apparent COPD. In a previous study, long-term cigarette smoking was shown to be associated with increases in wall thickness of sub-segmental airways and current smoking was associated with narrower airway lumen diameters (19). In our study, airway wall thickness and Pi10 were greater in patients with GOLD III and IV than in those with GOLD I and II. Since many patients were enrolled in the study at the beginning of treatment, before smoking cessation, it is possible that the airway manifestation of COPD could not be accurately measured due to the smoking-related bronchial wall thickening. Nevertheless, airway parameters on CT were weakly correlated with FEV1/FVC and FEV1 in our study, which is in line with previous reports (5). By including airway and parenchymal attenuation parameters on CT in a multiple regression model, we achieved slightly higher statistical power to predict FEV1 and FEV1/FVC. The effect of airway parameters on FEV1 and FEV/FVC was greater in patients with mild COPD (Group 1, GOLD I and II). Patients with more severe disease demonstrated a diminished impact of airway inflammation on airflow limitation. Further studies are needed to evaluate the relationships between PFT indices and airway parameters on CT according to the severity of COPD.
Assessments of COPD progression have focused on changes over serial PFTs (20). Although PFTs measure disease progression and declining lung function in patients with COPD, the serial morphological changes on CT that are associated with COPD progression are poorly understood (21). In a previous study, Galbán et al. (22) suggested that functional small airway disease (fSAD) precedes emphysema. The study measured COPD severity using a parametric response map (PRM), which is a voxel-based CT image post-processing method (22). Although further validation of PRM in a longitudinal cohort study is needed, it is a promising technology that may improve our understanding of COPD progression. In the study by Galbán et al. (22), the extent fSAD identified by PRM (PRMfSAD) was the main contributing factor to airflow obstruction in patients with GOLD stages I and II COPD. Patients with GOLD stages III and IV COPD appeared to be affected by both fSAD and emphysema; however, the extent of emphysema increasing to > 20%, whereas PRMfSAD plateaued at approximately 40–50% of the lung volume. In our study, airway parameters on CT were identified as predictors of PFT indices only for GOLD I and II patients, whereas parenchymal attenuation parameters were found to be predictive of PFT indices in GOLD III and IV patients, a result that could be explained by the associations between airway parameters and fSAD. These findings were consistent with the pathology and CT results presented by Hogg's group, i.e., that the narrowing and disappearance of small conducting airways precedes the development of emphysematous destruction, with increased peripheral airway resistance in COPD (23).
There are several limitations to this study. First, although we used spirometry parameters, such as FEV1/FVC and FEV1, they do not indicate COPD severity completely. However, clinically, COPD is defined by these two parameters; therefore, we used them in this study. This study included a small patient cohort that was not ethnically diverse; this cohort would likely be insufficient to account for the heterogeneous nature of COPD. Moreover, although CT protocols are designed to minimize interpatient differences, CT scanners vary between centers, which may have affected our results (24). Furthermore, even though we fixed a standard voltage for the CT scan, the voltages of CT scans were varied based on CT values of scanned organs and this may have affected the CT parameters used in this study. Lastly, the effects of CT parameters on PFT indices are too small to be clinically useful. Although CT parameters have shown good correlation with PFT indices and the quantitative CT values may be used to predict pulmonary function, the quantification process is time-consuming and the predicted pulmonary function may not accurately reflect the actual pulmonary function. Therefore, the clinical utility of CT quantification to predict pulmonary function in patients with COPD is limited, although it may be helpful in understanding the mechanism of COPD.
In conclusion, we demonstrated nonlinear relationships between PFT indices and quantitative CT parameters that vary according to COPD severity. In particular, CT airway parameters and parenchymal attenuation parameters were significant predictors of FEV1/FVC and FEV1 in patients with mild COPD (GOLD stages I and II), whereas only parenchymal attenuation parameters were significant predictors in patients with severe COPD (GOLD stages III and IV). DLCO showed mild correlations with CT parenchymal attenuation parameters, and the correlations were more significant in patients with severe COPD (GOLD stages III and IV). Quantitative CT parameters vary according to COPD severity and can be used to predict pulmonary function in COPD patients.
 XML Download