

 PDF
PDF ePub
ePub Citation
 Print
Print


INTRODUCTION
MATERIALS AND METHODS
Literature Search Strategy
Inclusion Criteria
1) Population: patients with histologically proven HNSCC who underwent definitive CCRT or radiation therapy.
2) Index test: imaging with MRI including DWI with provision of pre-treatment ADC value or change in the pre-treatment and early intra-treatment or post-treatment ADC values.
3) Reference standard: the reference standards of the treatment outcome as determined by histologic confirmation or clinical/imaging follow-up, or a combination of these.
4) Outcomes: results of locoregional failure after definitive CCRT or radiation therapy, reported in sufficient detail.
5) Study design: all observational studies (retrospective or prospective).
Exclusion Criteria
Data Extraction
1) Study characteristics: authors, year of publication, hospital or medical school, years of patient recruitment, sample size, and study design.
2) Demographic and clinical characteristics of patients: mean age, nodule size, and patient reference standards.
3) Imaging characteristics: timing of imaging, machine manufacturer and model, magnetic field strength, sequence, slice thickness, gap, and total acquisition time for DWI.
4) Interpretation: number of reviewers, experience, presence of consensus data.
5) True positives and negatives and false positives and negatives for the prediction of treatment response according to ADC value. In cases of incomplete 2 × 2 tables, the corresponding author was contacted, and data required to generate 2 × 2 tables was requested.
Quality Assessment
Data Analysis
RESULTS
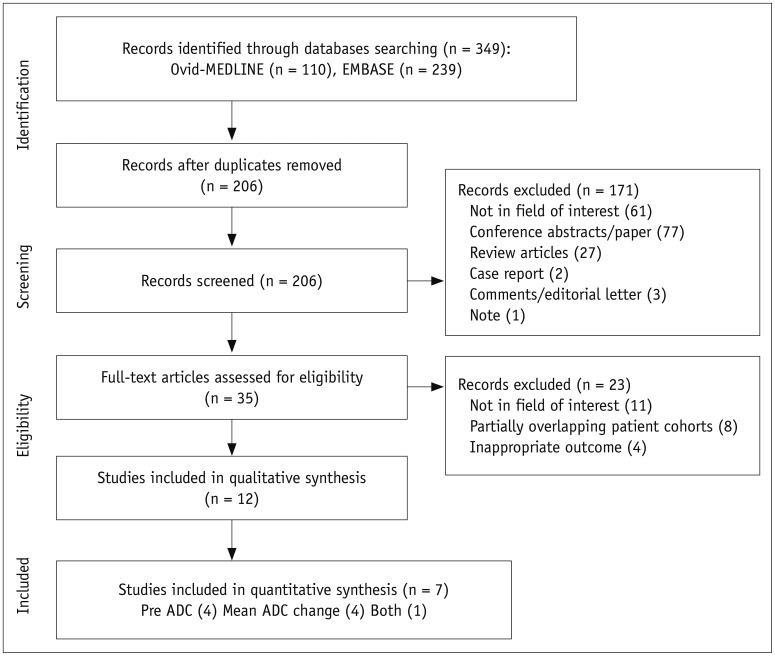
Literature Search
Characteristics of the Included Studies
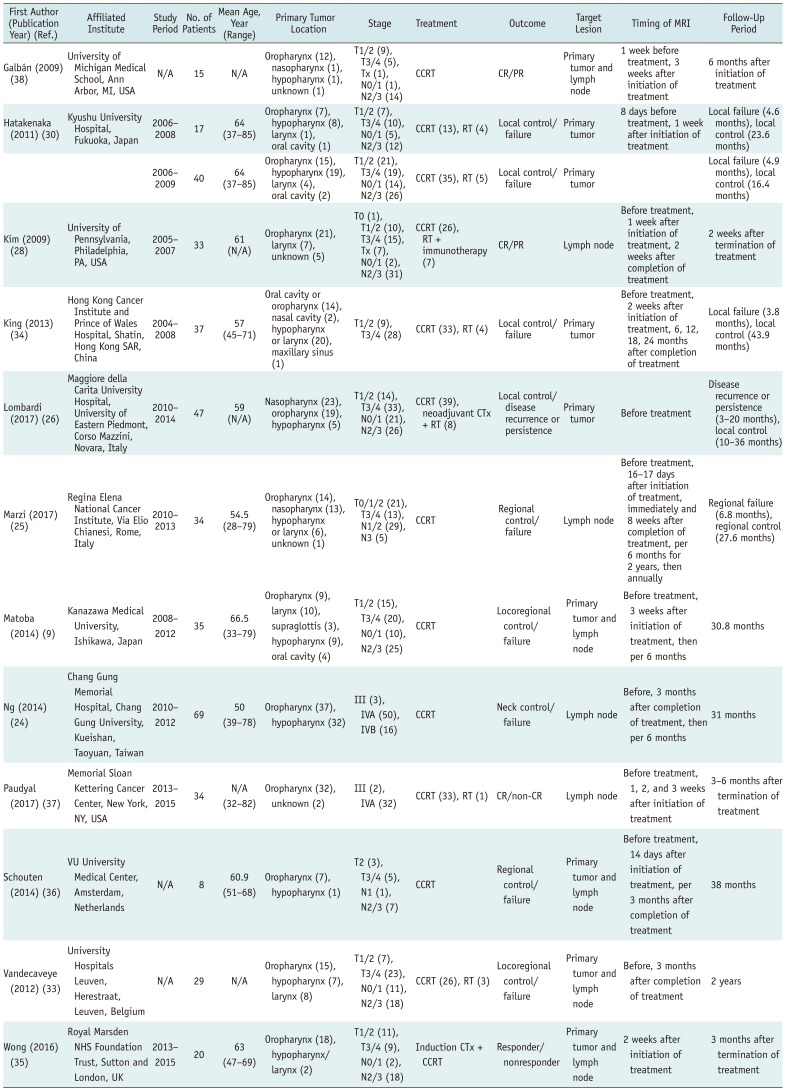
Table 1
Characteristics of Included Studies
| First Author (Publication Year) (Ref.) | Affiliated Institute | Study Period | No. of Patients | Mean Age, Year (Range) | Primary Tumor Location | Stage | Treatment | Outcome | Target Lesion | Timing of MRI | Follow-Up Period |
|---|---|---|---|---|---|---|---|---|---|---|---|
| Galbán (2009) (38) | University of Michigan Medical School, Ann Arbor, MI, USA | N/A | 15 | N/A | Oropharynx (12), nasopharynx (1), hypopharynx (1), unknown (1) | T1/2 (9), T3/4 (5), Tx (1), N0/1 (1), N2/3 (14) | CCRT | CR/PR | Primary tumor and lymph node | 1 week before treatment, 3 weeks after initiation of treatment | 6 months after initiation of treatment |
| Hatakenaka (2011) (30) | Kyushu University Hospital, Fukuoka, Japan | 2006–2008 | 17 | 64 (37–85) | Oropharynx (7), hypopharynx (8), larynx (1), oral cavity (1) | T1/2 (7), T3/4 (10), N0/1 (5), N2/3 (12) | CCRT (13), RT (4) | Local control/failure | Primary tumor | 8 days before treatment, 1 week after initiation of treatment | Local failure (4.6 months), local control (23.6 months) |
| 2006–2009 | 40 | 64 (37–85) | Oropharynx (15), hypopharynx (19), larynx (4), oral cavity (2) | T1/2 (21), T3/4 (19), N0/1 (14), N2/3 (26) | CCRT (35), RT (5) | Local control/failure | Primary tumor | Local failure (4.9 months), local control (16.4 months) | |||
| Kim (2009) (28) | University of Pennsylvania, Philadelphia, PA, USA | 2005–2007 | 33 | 61 (N/A) | Oropharynx (21), larynx (7), unknown (5) | T0 (1), T1/2 (10), T3/4 (15), Tx (7), N0/1 (2), N2/3 (31) | CCRT (26), RT + immunotherapy (7) | CR/PR | Lymph node | Before treatment, 1 week after initiation of treatment, 2 weeks after completion of treatment | 2 weeks after termination of treatment |
| King (2013) (34) | Hong Kong Cancer Institute and Prince of Wales Hospital, Shatin, Hong Kong SAR, China | 2004–2008 | 37 | 57 (45–71) | Oral cavity or oropharynx (14), nasal cavity (2), hypopharynx or larynx (20), maxillary sinus (1) | T1/2 (9), T3/4 (28) | CCRT (33), RT (4) | Local control/failure | Primary tumor | Before treatment, 2 weeks after initiation of treatment, 6, 12, 18, 24 months after completion of treatment | Local failure (3.8 months), local control (43.9 months) |
| Lombardi (2017) (26) | Maggiore della Carita University Hospital, University of Eastern Piedmont, Corso Mazzini, Novara, Italy | 2010–2014 | 47 | 59 (N/A) | Nasopharynx (23), oropharynx (19), hypopharynx (5) | T1/2 (14), T3/4 (33), N0/1 (21), N2/3 (26) | CCRT (39), neoadjuvant CTx + RT (8) | Local control/disease recurrence or persistence | Primary tumor | Before treatment | Disease recurrence or persistence (3–20 months), local control (10–36 months) |
| Marzi (2017) (25) | Regina Elena National Cancer Institute, Via Elio Chianesi, Rome, Italy | 2010–2013 | 34 | 54.5 (28–79) | Oropharynx (14), nasopharynx (13), hypopharynx or larynx (6), unknown (1) | T0/1/2 (21), T3/4 (13), N1/2 (29), N3 (5) | CCRT | Regional control/failure | Lymph node | Before treatment, 16–17 days after initiation of treatment, immediately and 8 weeks after completion of treatment, per 6 months for 2 years, then annually | Regional failure (6.8 months), regional control (27.6 months) |
| Matoba (2014) (9) | Kanazawa Medical University, Ishikawa, Japan | 2008–2012 | 35 | 66.5 (33–79) | Oropharynx (9), larynx (10), supraglottis (3), hypopharynx (9), oral cavity (4) | T1/2 (15), T3/4 (20), N0/1 (10), N2/3 (25) | CCRT | Locoregional control/failure | Primary tumor and lymph node | Before treatment, 3 weeks after initiation of treatment, then per 6 months | 30.8 months |
| Ng (2014) (24) | Chang Gung Memorial Hospital, Chang Gung University, Kueishan, Taoyuan, Taiwan | 2010–2012 | 69 | 50 (39–78) | Oropharynx (37), hypopharynx (32) | III (3), IVA (50), IVB (16) | CCRT | Neck control/failure | Lymph node | Before, 3 months after completion of treatment, then per 6 months | 31 months |
| Ng (2014) (24) | Chang Gung Memorial Hospital, Chang Gung University, Kueishan, Taoyuan, Taiwan | 2010–2012 | 69 | 50 (39–78) | Oropharynx (37), hypopharynx (32) | III (3), IVA (50), IVB (16) | CCRT | Neck control/failure | Lymph node | Before, 3 months after completion of treatment, then per 6 months | 31 months |
| Paudyal (2017) (37) | Memorial Sloan Kettering Cancer Center, New York, NY, USA | 2013–2015 | 34 | N/A (32–82) | Oropharynx (32), unknown (2) | III (2), IVA (32) | CCRT (33), RT (1) | CR/non-CR | Lymph node | Before treatment, 1, 2, and 3 weeks after initiation of treatment | 3–6 months after termination of treatment |
| Schouten (2014) (36) | VU University Medical Center, Amsterdam, Netherlands | N/A | 8 | 60.9 (51–68) | Oropharynx (7), hypopharynx (1) | T2 (3), T3/4 (5), N1 (1), N2/3 (7) | CCRT | Regional control/ failure | Primary tumor and lymph node | Before treatment, 14 days after initiation of treatment, per 3 months after completion of treatment | 38 months |
| Wong (2016) (35) | Royal Marsden NHS Foundation Trust, Sutton and London, UK | 2013–2015 | 20 | 63 (47–69) | Oropharynx (18), hypopharynx/ larynx (2) | T1/2 (11), T3/4 (9), N0/1 (2), N2/3 (18) | Induction CTx + CCRT | Responder/ nonresponder | Primary tumor and lymph node | 2 weeks after initiation of treatment | 3 months after termination of treatment |
![]()
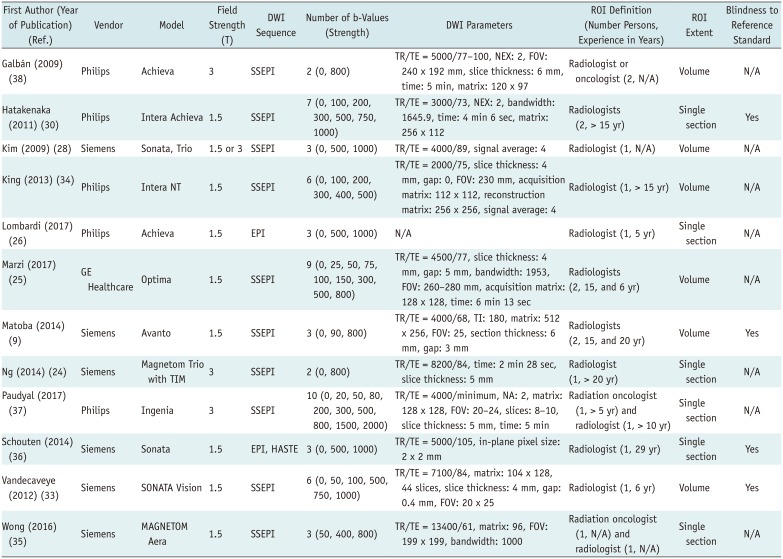
Table 2
Technical Characteristics of Included Studies
| First Author (Year of Publication) (Ref.) | Vendor | Model | Field Strength (T) | DWI Sequence | Number of b-Values (Strength) | DWI Parameters | ROI Definition (Number Persons, Experience in Years) | ROI Extent | Blindness to Reference Standard |
|---|---|---|---|---|---|---|---|---|---|
| Galbán (2009) (38) | Philips | Achieva | 3 | SSEPI | 2 (0, 800) | TR/TE = 5000/77–100, NEX: 2, FOV: 240 x 192 mm, slice thickness: 6 mm, time: 5 min, matrix: 120 x 97 | Radiologist or oncologist (2, N/A) | Volume | N/A |
| Hatakenaka (2011) (30) | Philips | Intera | Achieva 1.5 | SSEPI | 7 (0, 100, 200, 300, 500, 750, 1000) | TR/TE = 3000/73, NEX: 2, bandwidth: 1645.9, time: 4 min 6 sec, matrix: 256 x 112 | Radiologists (2, > 15 yr) | Single section | Yes |
| Kim (2009) (28) | Siemens | Sonata, Trio | 1.5 or 3 | SSEPI | 3 (0, 500, 1000) | TR/TE = 4000/89, signal average: 4 | Radiologist (1, N/A) | Volume | N/A |
| King (2013) (34) | Philips | Intera NT | 1.5 | SSEPI | 6 (0, 100, 200, 300, 400, 500) | TR/TE = 2000/75, slice thickness: 4 mm, gap: 0, FOV: 230 mm, acquisition matrix: 112 x 112, reconstruction matrix: 256 x 256, signal average: 4 | Radiologist (1, > 15 yr) | Volume | N/A |
| Lombardi (2017) (26) | Philips | Achieva | 1.5 | EPI | 3 (0, 500, 1000) | N/A | Radiologist (1, 5 yr) | Single section | N/A |
| Marzi (2017) (25) | GE Healthcare | Optima | 1.5 | SSEPI | 9 (0, 25, 50, 75, 100, 150, 300, 500, 800) | TR/TE = 4500/77, slice thickness: 4 mm, gap: 5 mm, bandwidth: 1953, FOV: 260–280 mm, acquisition matrix: 128 x 128, time: 6 min 13 sec | Radiologists (2, 15, and 6 yr) | Volume | N/A |
| Matoba (2014) (9) | Siemens | Avanto | 1.5 | SSEPI | 3 (0, 90, 800) | TR/TE = 4000/68, TI: 180, matrix: 512 x 256, FOV: 25, section thickness: 6 mm, gap: 3 mm | Radiologists (2, 15, and 20 yr) | Volume | Yes |
| Ng (2014) (24) | Siemens | Magnetom Trio with TIM | 3 | SSEPI | 2 (0, 800) | TR/TE = 8200/84, time: 2 min 28 sec, slice thickness: 5 mm | Radiologist (1, > 20 yr) | Single section | N/A |
| Paudyal (2017) (37) | Philips | Ingenia | 3 | SSEPI | 10 (0, 20, 50, 80, 200, 300, 500, 800, 1500, 2000) | TR/TE = 4000/minimum, NA: 2, matrix: 128 x 128, FOV: 20–24, slices: 8–10, slice thickness: 5 mm, time: 5 min | Radiation oncologist (1, > 5 yr) and radiologist (1, > 10 yr) | Single section | N/A |
| Schouten (2014) (36) | Siemens | Sonata | 1.5 | EPI, HASTE | 3 (0, 500, 1000) | TR/TE = 5000/105, in-plane pixel size: 2 x 2 mm | Radiologist (1, 29 yr) | Single section | Yes |
| Vandecaveye (2012) (33) | Siemens | SONATA | Vision | 1.5 | SSEPI 6 (0, 50, 100, 500, 750, 1000) | TR/TE = 7100/84, matrix: 104 x 128, 44 slices, slice thickness: 4 mm, gap: 0.4 mm, FOV: 20 x 25 | Radiologist (1, 6 yr) | Volume | Yes |
| Wong (2016) (35) | Siemens | MAGNETOM Aera | 1.5 | SSEPI | 3 (50, 400, 800) | TR/TE = 13400/61, matrix: 96, FOV: 199 x 199, bandwidth: 1000 | Radiation oncologist (1, N/A) and radiologist (1, N/A) | Single section | N/A |
DWI = diffusion-weighted imaging, EPI = echo-planar imaging, FOV = field of view, HASTE = HAlf fourier Single-shot Turbo spin-Echo, NA = number of averages, NEX = number of excitations, ROI = region of interest, SSEPI = single-shot spin-echo EPI, T = tesla, TE = echo time, TI = inversion time, TR = repetition time
![]()
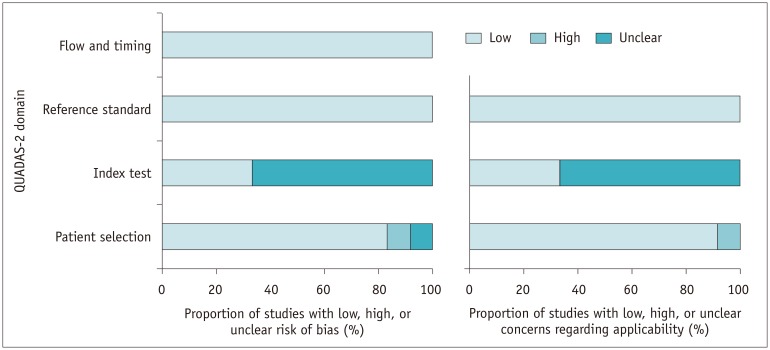
Quality Assessment
Pre-treatment ADC Value for Predicting Locoregional Treatment Response of HNSCC
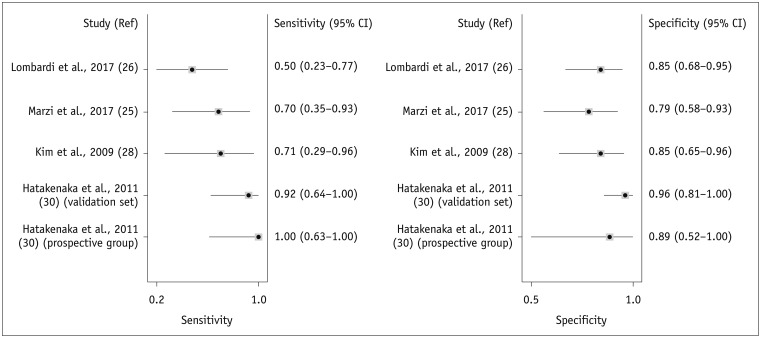 | Fig. 3Forest plots of sensitivity and specificity of pre-treatment ADC for prediction of locoregional recurrence.Horizontal lines indicate 95% CIs of individual studies. CI = confidence interval, Ref = reference
|
Table 3
Summary of Diagnostic Accuracy of Pre-Treatment ADC Value in Predicting Locoregional Failure in HNSCC
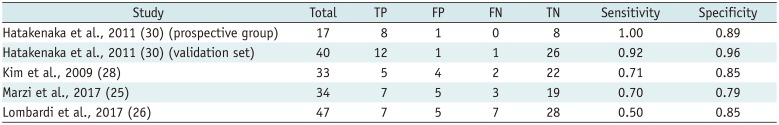
| Study | Total | TP | FP | FN | TN | Sensitivity | Specificity |
|---|---|---|---|---|---|---|---|
| Hatakenaka et al., 2011 (30) (prospective group) | 17 | 8 | 1 | 0 | 8 | 1.00 | 0.89 |
| Hatakenaka et al., 2011 (30) (validation set) | 40 | 12 | 1 | 1 | 26 | 0.92 | 0.96 |
| Kim et al., 2009 (28) | 33 | 5 | 4 | 2 | 22 | 0.71 | 0.85 |
| Marzi et al., 2017 (25) | 34 | 7 | 5 | 3 | 19 | 0.70 | 0.79 |
| Lombardi et al., 2017 (26) | 47 | 7 | 5 | 7 | 28 | 0.50 | 0.85 |
![]()
Change in ADC Value for Predicting Locoregional Failure of HNSCC
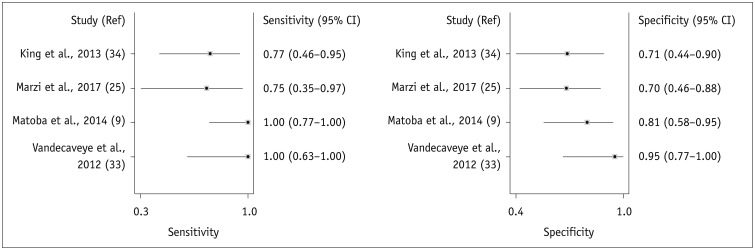 | Fig. 4Forest plots of sensitivity and specificity of change in ADC for prediction of locoregional recurrence.Horizontal lines indicate 95% CIs of individual studies.
|
Table 4
Summary of Diagnostic Accuracy of Change in ADC Value in Predicting Locoregional Failure in HNSCC
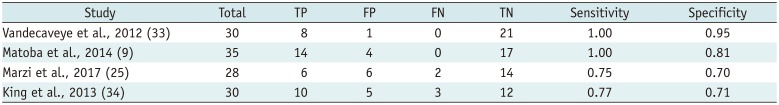
| Study | Total | TP | FP | FN | TN | Sensitivity | Specificity |
|---|---|---|---|---|---|---|---|
| Vandecaveye et al., 2012 (33) | 30 | 8 | 1 | 0 | 21 | 1.00 | 0.95 |
| Matoba et al., 2014 (9) | 35 | 14 | 4 | 0 | 17 | 1.00 | 0.81 |
| Marzi et al., 2017 (25) | 28 | 6 | 6 | 2 | 14 | 0.75 | 0.70 |
| King et al., 2013 (34) | 30 | 10 | 5 | 3 | 12 | 0.77 | 0.71 |
![]()
 XML Download