

 PDF
PDF ePub
ePub Citation
 Print
Print


INTRODUCTION
Radiofrequency (RF) ablation is a localized thermal therapy used to eradicate tumors by heating the tissue. RF ablation plays an increasingly important role in the management of metastasis, including colorectal cancer as well as hepatocellular carcinoma (1). However, extrahepatic tumor seeding has been reported in 0.47–12% of cases of thermal ablation (2345). Several risk factors associated with extrahepatic tumor seeding after RF ablation have been identified, including subcapsular location, poor histological differentiation, tumor biopsy prior to RF ablation, larger tumor size, and direct puncture of the tumor (23678). Subcapsular location of the tumor as a risk factor for extrahepatic tumor seeding has been explained based on increased intratumoral pressure with subsequent rupture of the liver capsule and a higher risk of dissemination of viable tumor cells into the peritoneal cavity by direct puncture of the tumor without traversing the normal parenchyma (29). Several studies have attempted to reduce tumor seeding after RF ablation of subcapsular tumors (10111213). The reported methods to reduce tumor seeding and obtain adequate ablation margins were the no-touch wedge ablation technique and the angled-tip method (101114), which avoid direct puncture of the tumor. Low-power RF ablation has been reported as a power-applying protocol to avoid a rapid increase in intratumoral pressure and steam popping compared to that in high-power RF ablation (1213). Some studies have reported that the efficacy and safety of low-power RF ablation in tumor ablation was comparable to that of high-power RF ablation (1215). However, the role of low-power RF ablation in reducing tumor seeding after ablation of subcapsular tumors has not been clearly demonstrated, since tumor seeding is very rare and generally happens long after RF ablation.
Therefore, the aim of this study was to evaluate the impact of energy and access methods on extrahepatic tumor spreading and the ablation zone in an ex vivo subcapsular tumor mimic model with a risk of extrahepatic tumor spreading.
Go to : 
MATERIALS AND METHODS
Preparation of the Tumor Mimic Model
Four bovine livers were obtained from a slaughterhouse on the same day as RF ablation was performed for the experiments. The livers were cut into 42 blocks of 10 × 10 × 5 cm in size, excluding large vascular structures. Each block of liver tissue with the capsule on one side was packed in a rigid paper case with the bottom and one side left open for the injection of a mixture to create the tumor mimic.
For training in RF ablation, previous researchers developed tumor-mimic models in both ex vivo and in vivo settings (1617). A mixture containing 3% agarose, 3% cellulose, 7% glycerol, and 0.05% methylene blue was used with reference to a previous study (1617). The mixture was prepared by mixing 6 g of agarose, 6 g of cellulose, 14 mL of glycerol, and 100 mg of methylene blue for a total volume of 200 mL with distilled water. To solubilize the mixture, the solution was heated to 95℃ for approximately 5 minutes using a heating mantle. Aliquots of 200 mL were mixed with 180 mL of contrast media (iopamidol, Pamiray 300, Dongkuk Pharmaceutical, Seoul, Korea). The mixture was sealed in airtight tubes and allowed to cool to 22 ± 2℃. After polymerization of the mixture into a solid, gelatin-like material, the tubes were stored at 22 ± 2℃. Before injection, 200 mL of the aliquots was reheated to 65℃ in a heating mantle.
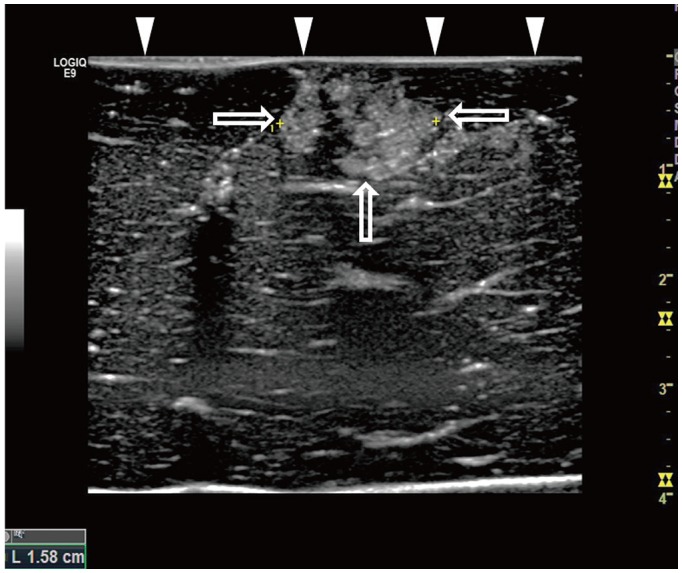
A hyperechoic and spherical tumor mimic measuring approximately 1.5 cm2 in area was created by injecting 2 mL of the mixture into the subcapsular portion of a liver block through an 18 gauge intravenous angiocatheter by placing the catheter tip 5 mm from the liver capsule under ultrasound (US) guidance (Fig. 1). The diameter of each tumor mimic measured on US was recorded.
CT Examination
Computed tomography (CT) scans were obtained for all tumor mimic models before and after RF ablation using a 128-slice multi-detector-row CT scanner (Somatom definition flash, Siemens Healthcare, Forchheim, Germany) with imaging parameters as follows: 128 × 0.6 mm collimation, 1 mm slice thickness, 120 kVp, and 120 mA.
RF Ablation
Liver blocks with a tumor mimic were placed on a non-current plate with a grounding pad fixed to the side of the plate filled with saline. A 200-watt RF generator with an impedance-controlled pulsed current (VIVA RF system; STARmed, Goyang, Korea) was used for all ablations. The starting impedance was controlled by maintaining the distance between the grounding pad and the liver blocks and set at 80–83 Ω (Fig. 2). A 15-gauge monopolar, internally-cooled electrode (Proteus; STARmed) with a 3.0 cm exposed tip was placed in the tumor mimic by freehand technique under US guidance using a 7 MHz linear probe.
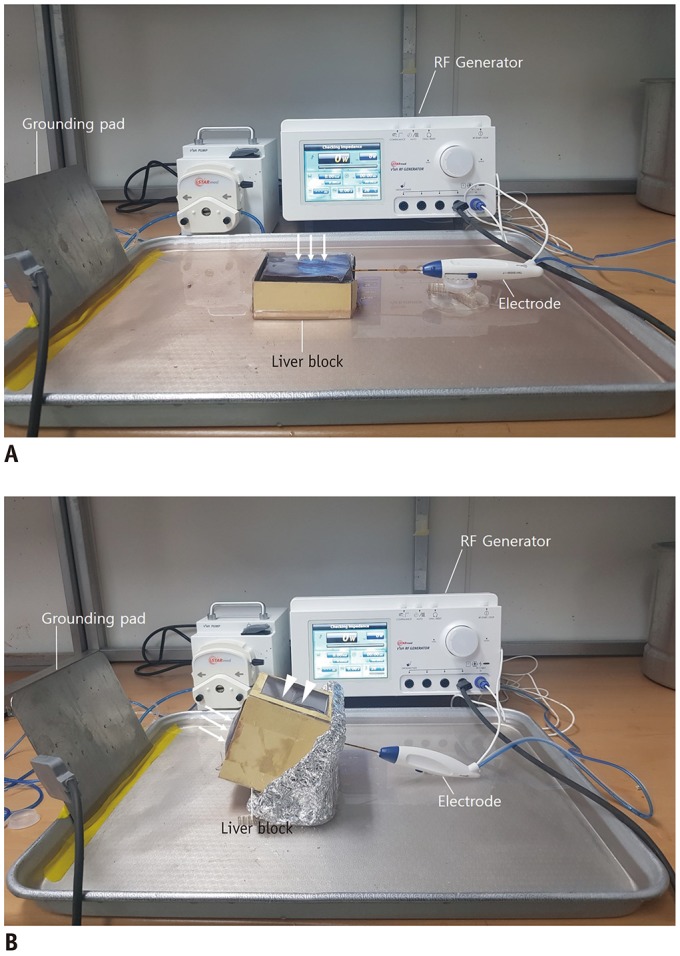 | Fig. 2Photographs of experimental models and RF ablation system.Sectioned bovine liver block with tumor mimic created in subcapsular portion is placed in water plate. (A) Electrode is inserted at lateral surface of liver block and advanced parallel to capsule (arrows). (B) Electrode is inserted at bottom of liver block opposite capsule and advanced through tumor mimic towards capsule (arrows). Lateral side of paper case is open for US guidance (arrowheads). RF = radiofrequency
|
RF Ablation Protocols
RF ablation was performed for 5 minutes following two different protocols with either the parallel or perpendicular access method. In experiment A with parallel access, the electrode was inserted parallel to the liver capsule at 5 mm distance from the capsule through the center of the tumor mimic (Figs. 2A, 3A). In experiment B with perpendicular access, the electrode was inserted towards the capsule through the center of the tumor mimic by placing the electrode tip at a distance of 5 mm from the liver capsule (Figs. 2B, 3B). In group 1 with the low-power protocol, the power of the generator was initially set at 40 watts for 1 minute and then increased to 70 watts in increments of 10 watts every 1 minute. For the remaining 1 minute in the low-power protocol, 70 watts power was maintained under the impedance-control mode (12). In group 2 with the high-power protocol, the power of the generator increased sharply to reach the maximum wattage under the impedance-control mode (18). The low-power protocol with parallel access was applied in 10 tumor mimic models, low-power protocol with perpendicular access in 11 models, high-power protocol with parallel access in 10 models, and high-power protocol with perpendicular access in 11 models. The temperature, power, and impedance were continuously checked. The time of the first roll-off and popping sound was recorded.
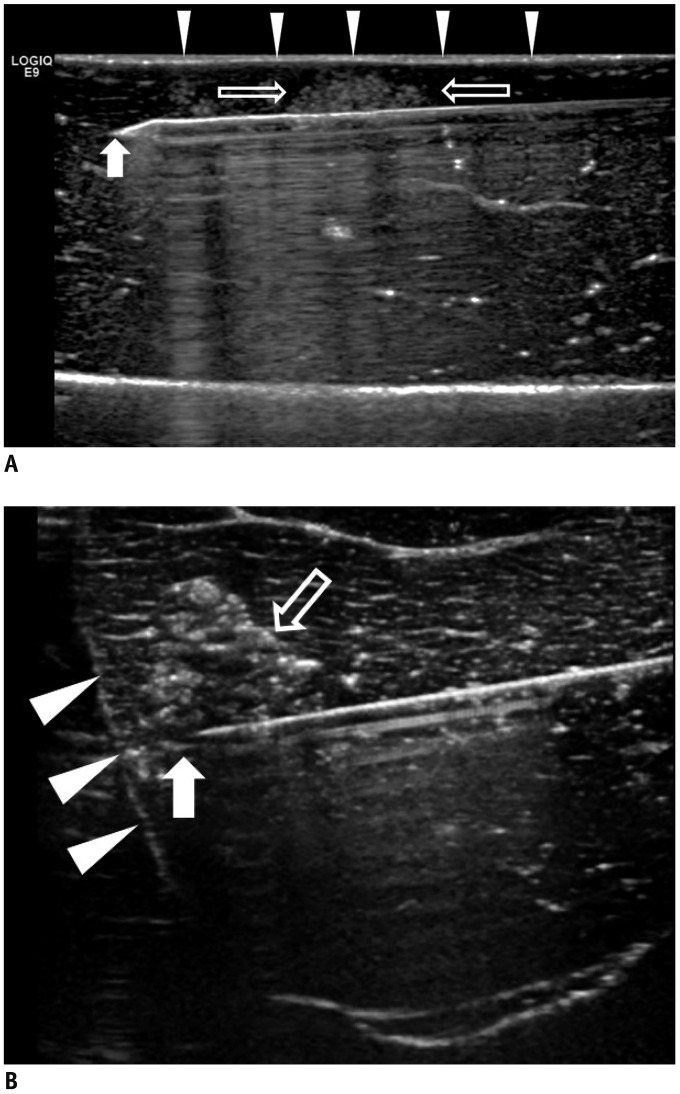 | Fig. 3US of parallel and perpendicular access methods.
A. US image illustrating parallel access method. Electrode (arrow) is placed parallel to liver capsule (arrowheads) through tumor mimic (open arrows). B. US image illustrating perpendicular access method. Tip of electrode (arrow) extends towards liver capsule (arrowheads) through tumor mimic (open arrow).
|
Evaluation of the CT Images and Liver Specimens
The CT images were reviewed by two radiologists without any information about the ablation protocol in consensus for the presence of a contrast leak from the tumor mimics towards the upper surface of the liver blocks. A contrast leak was confirmed when high-attenuation contrast was observed on the capsule on the upper surface of a liver block on the post-ablation images in comparison to the pre-ablation images at the same levels.
The liver specimens were sectioned parallel to the long axis of the electrode insertion tract. The ablation zone size was measured based on two diameters (i.e., the longest diameter and one perpendicular diameter) of the specimens. For perpendicular access, the transverse diameter of the ablation zone just beneath the liver capsule was also measured.
Statistical Analysis
All statistical analyses were performed using commercially available software (SPSS version 21.0; IBM Corp., Armonk, NY, USA). The results are expressed as means ± standard deviation. The following were compared between group 1 and group 2 in each experiment (A and B): the presence of a contrast leak, size of the ablation zone, and timing of the first roll-off and popping. Categorical values were compared by the chi-square test and numerical values were analyzed by the Mann-Whitney U-test. A p value of < 0.05 was defined as significant.
Go to :
RESULTS
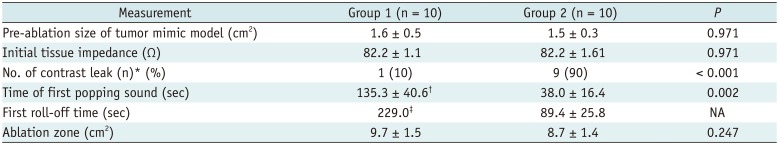
The size of the tumor mimics as measured by US was not significantly different between the groups (1.6 ± 0.5 cm2 in group 1, and 1.5 ± 0.3 cm2 in group 2, p = 0.971). The results of experiment A are summarized in Table 1. In experiment A with parallel access, one contrast leak (1/10, 10%) was identified on CT in group 1 and nine contrast leaks (9/10, 90%) were identified in group 2 (p < 0.001) (Figs. 4, 5). The first roll-off and popping sound occurred with delayed timing in group 1 compared to that in group 2 (229.0 seconds vs. 89.4 ± 25.8 seconds, the first roll-off in group 1 and group 2, respectively; 135.3 ± 40.6 seconds vs. 38.0 ± 16.4 seconds, p = 0.002, popping sound in group 1 and group 2, respectively). The first roll-off occurred after the initial popping sound during all ablations. In group 1, six tumor mimic models did not have popping sounds within 5 minutes and one of the six models without a popping sound had a contrast leak. In group 1, only one tumor mimic model had roll-off within 5 minutes. The area of the ablation zones did not significantly differ between group 1 and group 2 (9.7 ± 1.5 cm2 in group 1 and 8.7 ± 1.4 cm2 in group 2, p = 0.247).
 | Fig. 4RF ablation with low-power protocol and parallel access.
A, B. Pre- and post-RF ablation CT images. Post-RF ablation CT image (B) reveals no visible contrast leak on upper hepatic surface, compared to that observed on pre-RF ablation CT image (A). C. Liver specimen corresponding to CT images. Analysis of specimen revealed no visible contrast leak on surface of liver. CT = computed tomography, RF = radiofrequency
|
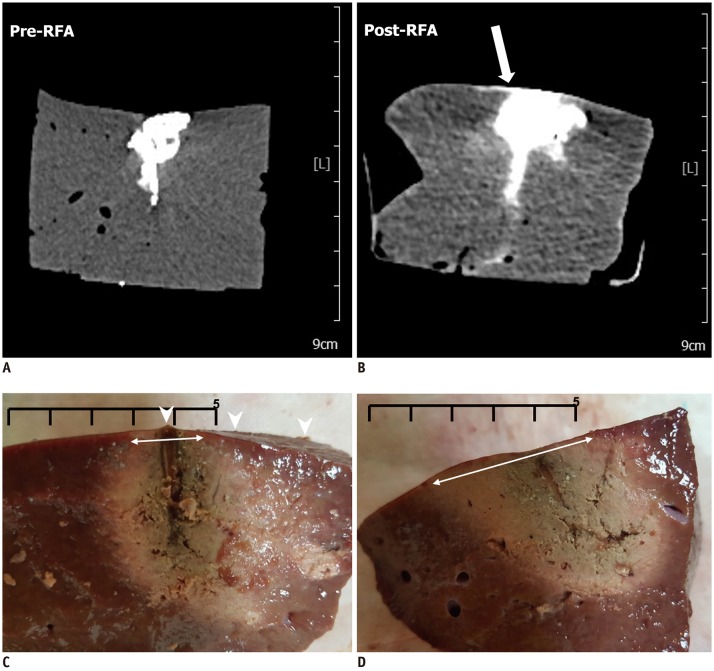
 | Fig. 5RF ablation with high-power protocol and parallel access.
A, B. Pre- and post-RF ablation CT images. Post-RF ablation CT image (B) reveals contrast leak on hepatic surface (arrow) compared to that observed on pre-RF ablation CT image (A). High-density lines (arrowheads) inferior to tumor mimic (open arrows) is track through which tumor mimic material was injected. C. Liver specimen corresponding to CT images. Specimen image illustrates track of contrast leak corresponding to tract on post-RF ablation CT (arrow).
|
Table 1
Comparison of RF Ablation between Two Groups with Parallel Access
Unless otherwise indicated, data are mean ± standard deviation. Group 1 means RF ablation with low RF protocol, Group 2 means RF ablation with high RF protocol. p value could not be obtained since Group 1 had only one case with roll-off. *Values are number of tumor mimic models, with percentage in parentheses, †n = 4, ‡n = 1. NA = not applicable, RF = radiofrequency
![]()
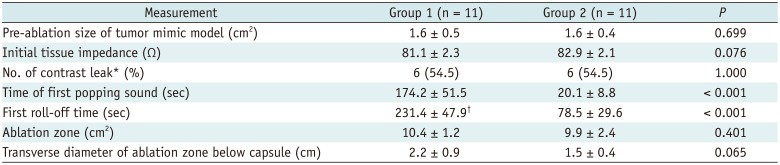
The results of experiment B are summarized in Table 2. In experiment B with perpendicular access, six contrast leaks (6/11, 54.5%) were identified on CT in group 1 and six contrast leaks (6/11, 54.5%) were identified in group 2 (p = 1.00). Similar to that in experiment A, the first roll-off and popping sound occurred with delayed timing in group 1 compared to that in group 2 (231.4 ± 47.9 seconds vs. 78.5 ± 29.6 seconds, p < 0.001, the first roll-off in group 1 and group 2, respectively; 174.2 ± 51.5 seconds vs. 20.1 ± 8.8 seconds, p < 0.001, popping sound in group 1 and group 2, respectively). In group 1, four tumor mimic models did not have roll-off within 5 minutes. The area of the ablation zones did not significantly differ between groups (10.4 ± 1.2 cm2 vs. 9.9 ± 2.4 cm2, p = 0.401). The transverse diameter of the ablation zone measured just beneath the capsule was larger in group 1 than in group 2 and exhibited borderline statistical significance (2.2 ± 0.9 cm in group 1 and 1.5 ± 0.4 cm in group 2, p = 0.065) (Fig. 6).
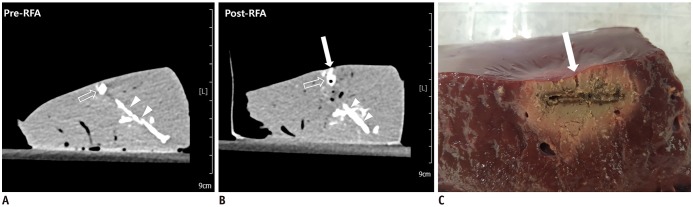
 | Fig. 6RF ablation with high-power protocol and perpendicular access.
A, B. Pre- and post-RF ablation CT images. Post-RF ablation CT image (B) reveals contrast leak on hepatic surface after RF ablation, compared to that observed on pre-RF ablation CT image (A) (arrow). C. Liver specimen corresponding to CT images. Analysis of specimen reveals contrast leak on hepatic surface (arrowheads). D. Another liver specimen with low-power protocol and perpendicular access. Analysis of specimen reveals no contrast leak on hepatic surface, and diameter of ablation zone just beneath capsule is larger than that of specimen shown in (C) (double-headed arrows on C, D) (Scale bar: 5 cm).
|
Table 2
Comparison of RF Ablation between Two Groups with Perpendicular Access
![]()
A comparative analysis of experiments A and B revealed a tendency for the number of contrast leaks to increase in group 1 and a decrease in group 2. However, regardless of the access method, contrast leaks were still more frequent in group 2 than in group 1 (7/21, 33% in group 1 and 15/21, 71% in group 2, p = 0.029). The first roll-off and popping sound were delayed in group 1 compared to that in group 2 in both access methods. Nevertheless, contrast leak was similarly present in both groups with perpendicular access irrespective of the occurrence of the delayed popping sound.
Go to :
DISCUSSION
Extrahepatic tumor spreading is a fatal complication, which leads to reluctance in treating subcapsular tumors with RF ablation. Considering the increase in intratumoral pressure with subsequent rupture of the hepatic capsule as a cause of extrahepatic tumor spreading, the low-power RF ablation protocol with avoidance of steep elevation of intratumoral pressure may be a good strategy for treating subcapsular tumors. A previous study suggested that initiation of a modified RF ablation protocol at 40 watts with an incremental increase of 10 watts every 1 minute could reduce rapid and scattered recurrence in the liver after RF ablation of hepatocellular carcinoma compared to that associated with the conventional high-power protocol (1319). However, the role of the low-power protocol in the reduction of extrahepatic tumor spreading is not known for RF ablation of hepatic subcapsular tumors. It is not easy to prove the advantage of the low-power protocol in a clinical setting, as the incidence of extrahepatic tumor seeding after RF ablation of subcapsular tumors is low and usually happens long after RF ablation. Previous studies reporting a low risk of tumor seeding after RF ablation of subcapsular tumors included superficial subcapsular tumors, which can be ablated with intervening parenchyma to avoid direct puncture of the tumor (1020). A subcapsular tumor in the anterior segment of the liver can generally be approached with parallel access to avoid direct puncture of the tumor. However, an electrode cannot be easily placed with parallel access in the posterior segment of the liver, particularly segment VII. Insertion of the electrode facing the capsule in perpendicular access cannot be avoided. Nevertheless, extrahepatic tumor spreading from RF ablation of subcapsular tumors located in the posterior margin of the hepatic posterior segment is not well known.
We created a novel experimental model capable of demonstrating extrahepatic tumor spreading on CT imaging immediately after RF ablation. Our model may provide clinically significant solutions to the safety issues regarding RF ablation of subcapsular tumors.
The subcapsular tumor mimic model can demonstrate extrahepatic tumor spreading according to the power application or electrode access methods. In this study, the low-power protocol with parallel access resulted in fewer contrast leaks than did perpendicular access or the high-power protocol. Interestingly, an increasing tendency of contrast leaks was observed in the low-power protocol with perpendicular access, which simulated the route of electrode placement for a subcapsular tumor located in the posterior margin of the hepatic posterior segment, compared to that in the low-power protocol with parallel access. The possible explanation behind this observation is that RF energy concentrates first on the tip of an electrode and the capsule facing the tip can be exposed to relatively high temperature and pressure instantaneously, such that the capsule can be easily disrupted even with the low-power protocol and a distance of 5 mm between the tip and the capsule. The tumor mimics can change to a liquid state rapidly using a high initial temperature with the high-power protocol compared to with the low-power protocol, which may increase the rate of contrast leakage with the high-power protocol. However, our study revealed that the rate of contrast leakage with the low-power protocol was equal to that with the high-power protocol in perpendicular access, which would suggest that the injury of the capsule might have played a more important role for contrast leakage than did the fluid content of the tumor mimics. In the case of perpendicular access, the diameter of the ablation zone just beneath the capsule was smaller in the high-power protocol than in the low-power protocol, as the temperature increased rapidly around the tip and heat did not spread far in the high-power protocol due to the creation of charred tissue and frequent roll-off. This phenomenon may lead to an insufficient ablative margin adjacent to the capsule and a higher rate of local tumor progression. Therefore, RF ablation of the subcapsular tumor that is not feasible by parallel access should be performed using the low-power protocol without penetrating the tumor using multiple electrodes following the “no touch technique” to prevent spreading of the extrahepatic tumor and creating an insufficient ablative margin.
The mean ablation area increased slightly when RF ablation was performed following the low-power protocol compared to that when following the high-power protocol, although the increase was not statistically significant. High-power protocols are widely used because a large ablation area can be achieved with a short ablation time (21). However, in impedance-controlled RF ablation, the high-power protocol could induce increases in impedance resulting in repeated impedance spiking and an automatic cool-down cycle (i.e., roll-off), which could decrease the treatment efficiency (1222). Consequently, it is proposed that low-power RF ablation could provide comparable therapeutic effects to those achieved by high-power RF ablation.
The association of the popping phenomenon with tumor dispersion remains controversial (23). Some reports have suggested that steam popping was a sign of an abrupt increase in the intratissue pressure, which could lead to injury of the liver capsule or hepatic vessels (121924). As in the previous study, steam popping occurred at a relatively delayed rate with the low-power protocol compared to that with the high-power protocol (12). However, our study demonstrated the occurrence of contrast leak in the high- and low-power protocols with perpendicular access to a similar extent regardless of the delayed popping sound. Consequently, it is hypothesized that the popping sound may not be related to extrahepatic tumor spreading, such as the rupture of the liver capsule. A prospective study also reported that the popping sound during RF ablation was not associated with an increased risk of early tumor progression or poorer patient survival (23).
There are several limitations to this study. First, as the present study involved an ex vivo setting, it could not reflect in vivo physiology such as the heat-sink effect. In vivo experiments are necessitated to confirm the ex vivo observations of this study. Second, gelatin-like tumor mimics change to a liquid state at the high temperature of RF ablation and the liquid leaks more easily than the solid state to exaggerate the rate of extrahepatic leakage. Therefore, this study observed a higher rate of contrast leak than the reported incidence of extrahepatic seeding of solid tumors. Third, there was no consideration of other risk factors of extrahepatic tumor spreading, such as the histological degree of the tumor.
In summary, the low-power RF ablation protocol with an electrode placed parallel to the liver capsule resulted in a significantly lower rate of contrast leak into the hepatic outer surface during the treatment of a subcapsular tumor than did the high-power protocol. RF ablation with an electrode placed perpendicular to liver capsule resulted in a high rate of contrast leak in both the high- and low-power protocols. The size of the ablation zone with the low-power protocol was similar to that of the high-power protocol.
In conclusion, the low-power protocol with parallel access is proposed to be effective and safe from extrahepatic tumor spreading in RF ablation of solid subcapsular hepatic tumors. Perpendicular placement of an electrode to the capsule carries a risk of extrahepatic tumor spreading regardless of the type of energy-supplying protocol. Therefore, to prevent extrahepatic tumor spreading and secure an adequate ablative margin around the capsule, the low-power protocol with parallel access is strongly advised.
Go to :
 XML Download