

 PDF
PDF ePub
ePub Citation
 Print
Print


INTRODUCTION
Hepatocellular carcinoma (HCC) is the second leading cause of cancer deaths worldwide (1). Hepatic resection is the preferred curative treatment option for early-stage HCCs in patients with good health and well-preserved liver function (23). However, despite recent advances in surgical techniques, the high incidence of recurrence (up to 80%) remains a difficult challenge in the management of these patients (4). Thus, even after curative resection of HCC, patients are recommended to enroll in a surveillance program for the early detection of recurrence. However, because the risk of recurrence is not uniform across all patients with HCCs, attempts have been made to determine risk factors for recurrence that can help identify high-risk patients. This high-risk group would undergo either intensive postoperative surveillance or radical treatment during the initial stages, potentially leading to improved outcomes. Therefore, identification of the risk factors for postoperative recurrence may be a crucial strategy for improving overall survival (OS) after surgical resection in patients with HCC.
For this purpose, various pathologic factors including tumor size; microscopic vascular invasion; satellite nodule; tumor, node, and metastasis stage; and histologic grade have been investigated and firmly established as risk factors of postoperative recurrence (56). However, until now, no risk model capable of predicting HCC recurrence has been established, partly owing to the inability to obtain detailed, quantitative information of this heterogeneous tumor. Therefore, identification of more sophisticated and quantitative prognostic markers of HCC is clinically warranted.
Recently, radiomics has become another critical emerging area in oncology in addition to genomics and proteomics (7). In particular, texture analysis, which is a technique that can quantify the spatial pattern of pixel intensities on cross-sectional imaging, has been successfully applied to various types of cancers for the evaluation of tumor heterogeneity (891011121314). Texture analysis has also been demonstrated to provide more information than visual inspection in an objective and quantitative manner regarding the biological aggressiveness of a tumor (1315). Furthermore, texture analysis in patients with malignant tumors has been demonstrated to provide information regarding not only tumor heterogeneity, but also histologic tumor grade, as well as predictive information regarding tumor recurrence or survival (161718192021). However, until now, few studies have explored the value of computed tomography (CT) texture analysis (CTTA) in predicting disease-free survival (DFS) after surgical resection in patients with HCC (22). Therefore, the purpose of our study was to investigate the usefulness of CTTA in estimating the histologic tumor grade and in predicting DFS after surgical resection in patients with HCC.
MATERIALS AND METHODS
Patients
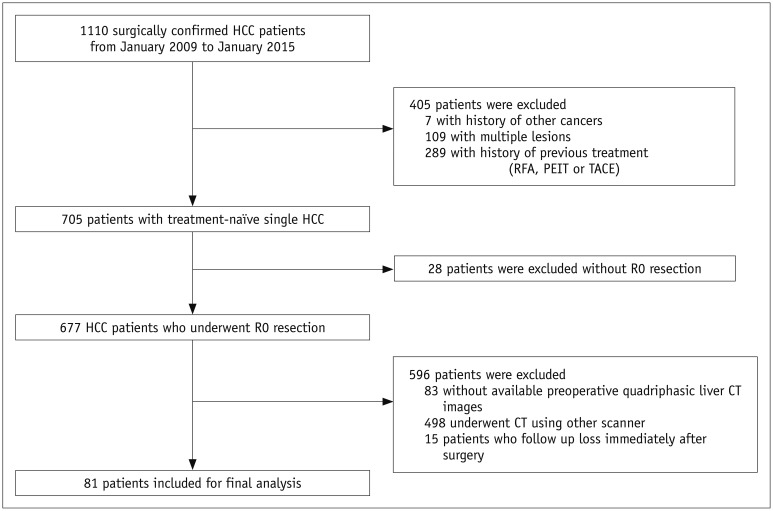
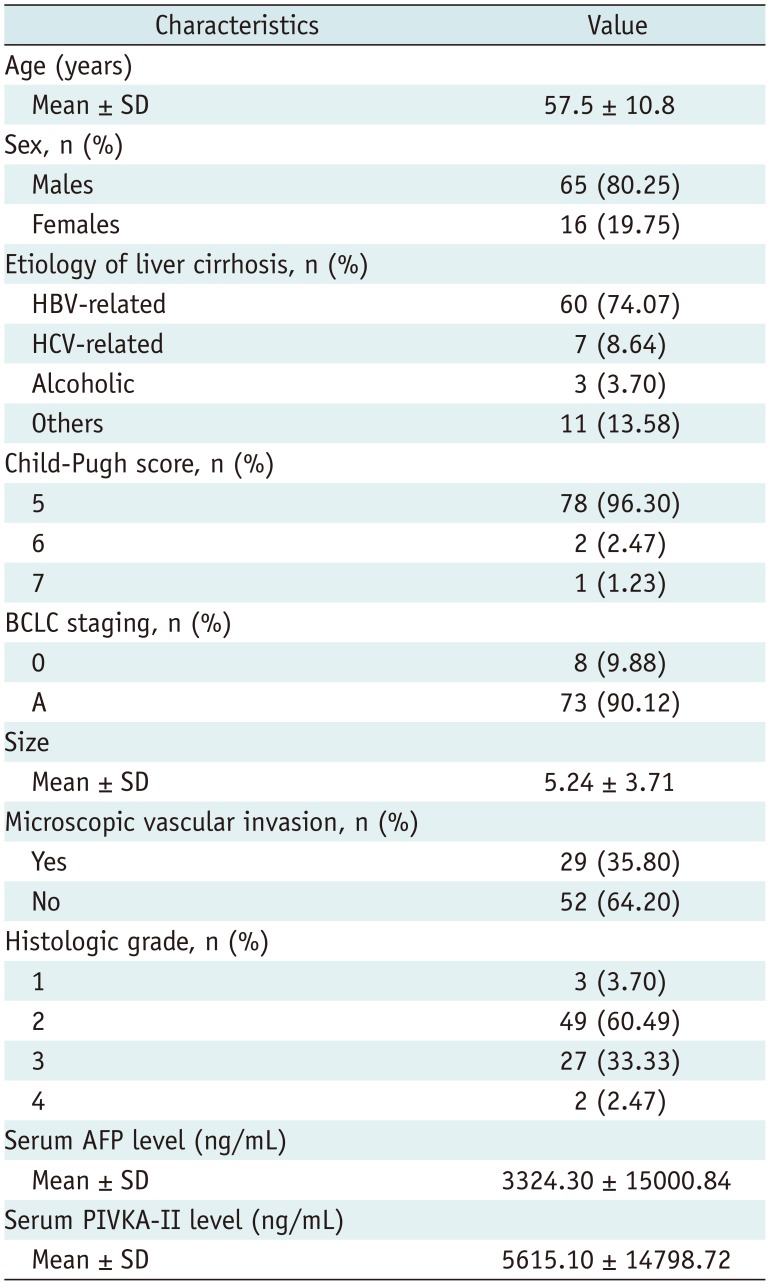
The Institutional Review Board of our institute approved this retrospective study and waived the requirement for informed consent. The study population consisted of patients diagnosed with HCC at a single center from January 2009 to January 2015 (Fig. 1). The inclusion criteria were as follows: 1) Patients with treatment-naïve single HCC; 2) patients who underwent R0 resection; 3) preoperative quadriphasic liver CT images (pre-contrast, arterial, portal-venous, and delayed phase) obtained less than 6 weeks before surgery; 4) follow-up of at least 2 years with no recurrence. The exclusion criteria were as follows: 1) Multiple lesions; 2) previous treatment with radiofrequency ablation (RFA), percutaneous ethanol injection therapy (PEIT), or trans-catheter arterial chemoembolization (TACE); 3) other accompanying cancers other than HCC; 4) CT using a protocol other than liver CT or a CT scanner other than a 64-detector row scanner (Brilliance 64, Philips Medical Systems, Cleveland, OH, USA); and 5) no available CT images reconstructed with filtered back projection. Finally, 81 patients, each with a single HCC and who had undergone quadriphasic contrast-enhanced CT using the same CT scanner comprised the study group (male:female, 65:16; mean age, 57.5 ± 10.8 years; age range 27–79 years).
CT Acquisition
In all study patients, CT examinations had been performed using a 64-detector row scanner (Brilliance 64) with the following scanning parameters: gantry rotation time of 0.5 seconds, 0.625 mm × 64-detector array, pitch of 1.0–1.5, table speed of 46.9 mm/rotation, 150–200 mAs, 120 kVp, and a 512 × 512 matrix. The reconstruction parameters were a 3-mm slice thickness and a 2- or 3-mm reconstruction interval. Arterial, portal-venous, and delayed phase CT images were obtained after administration of 1.5 mL/kg of a nonionic contrast material for 30 seconds (iohexol, Bonorex 350, Central Medical Service, Seoul, Korea; iobitridol, Xenetix 350, Guerbet, Aulnay-Sous-Bois, France) at a rate of 2.5–4.0 mL/s using a power injector. For arterial and portal-venous-phase scanning, 19- and 44-second delays were used after the maximal Hounsfield unit (HU) of the descending aorta reached 100 HU using bolus tracking. Delayed phase images were obtained 180 seconds after the start of contrast administration.
Imaging and Clinico-Pathologic Parameters
Preoperative CT images were retrospectively reviewed by one observer (a second-year resident of the Department of Radiology) under the supervision of an experienced abdominal radiologist (with 27 years of experience) who were blinded to the clinico-pathologic information. Previously reported imaging features for the prediction of HCC recurrence, such as the presence of rim arterial enhancement, peritumoral parenchymal enhancement, and a non-smooth tumor margin, were evaluated for each HCC: 1) Peripheral rim arterial enhancement was defined as the presence of irregular ring-like areas of enhancement with central hypovascular areas on arterial-phase images (23); 2) peritumoral parenchymal enhancement was defined as gross hyper-enhancement outside of the tumor border regardless of shape on arterial-phase images (24); 3) tumor margins were classified as either smooth or non-smooth, with smooth tumor margins defined as a smooth tumor-normal liver interface on all axial, coronal, and sagittal images, and all other cases were considered non-smooth tumor margins (e.g., focal bulging, lobulating, or multinodular types) (25). In addition, the average attenuation of tumors (HU) was measured on arterial and portal-venous-phase images.
Histologic data of HCCs including tumor size, microvascular invasion, satellite nodule, and histological grade were retrieved from the histologic reports. Low-grade tumors corresponded to Edmondson grades I and II, and high-grade tumors corresponded to Edmondson grades III and IV (26). Other demographic and clinical data including age, sex, Child-Pugh score, Barcelona Clinic Liver Cancer stage, serum alpha-fetoprotein, and protein induced by Vitamin K absence or antagonist-II levels were also collected. The demographic, clinical, and pathological information are summarized in Table 1.
Texture Analysis
Arterial and portal-venous-phase liver CT images were assessed by two observers (second-year residents of the Department of Radiology), who were blinded to the clinico-pathologic information, using commercially available TexRAD software (TexRAD Ltd, Cambridge, UK) with the filtration-histogram method (27).
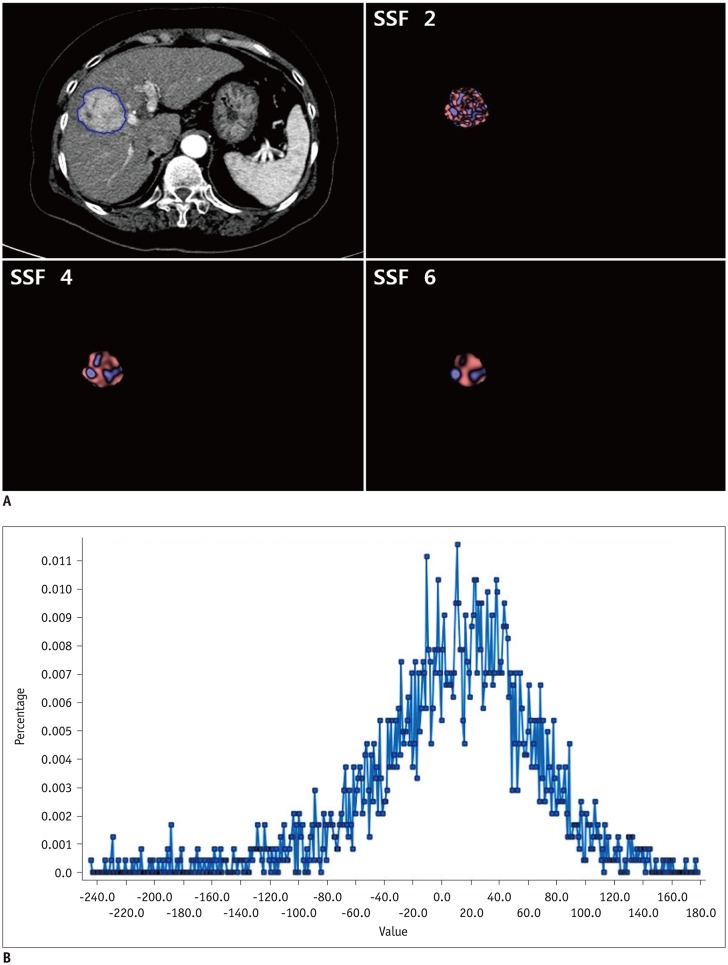
The technique comprised an initial filtration step in which a Laplacian of Gaussian spatial band-pass filter was used to selectively extract features of different sizes and intensity variations, followed by texture quantification (827). The resultant images displayed features at different spatial scales from fine to coarse textures within a region of interest (ROI) drawn around the tumor (Fig. 2A). The scale was selected by tuning the filter parameter, also known as the spatial scaling factor (SSF), between 2.0 and 6.0. Each SSF corresponded to the same number of millimeters of pixels in radius, ranging from fine (SSF 2.0), to medium (SSF 3.0–5.0), to coarse (SSF 6.0) texture maps (928). The ROI was delineated around the tumor outline at the level of the single largest cross-sectional area and further refined by excluding areas of fat, air, dense calcification, or bone; hence, the results included only pixels between 0 and 300 HU within the ROI (19). When the tumor margin was indistinct on arterial-phase images, the ROI was drawn after referencing the tumor margin on portal-venous or delayed phase images. Heterogeneity within this ROI was quantified with and without image filtration by calculating various texture parameters (mean, mean of positive pixels [MPP], entropy, kurtosis, skewness, and standard deviation [SD]) of the pixel distribution histogram (Fig. 2B).
Follow-Up
Patients were followed-up until death or until March 2017 if they were still alive. Tumor recurrence was tracked at an outpatient clinic at least every 3–6 months using either tumor markers or imaging studies such as ultrasonography, CT, or magnetic resonance imaging. The onset of tumor recurrence was designated as the time at which a tumor was detected using one of these imaging techniques. DFS was defined as the time span from the date of surgery to the date of recurrence or the last clinical follow-up.
Statistical Analysis
All data were checked using the Shapiro-Wilk test for normality and the Levene test for equality of variance. The texture features of the largest cross-sectional area of the tumor were compared between groups of different histologic grades using Student's t test and multiple linear regression analysis was performed to determine variables independently associated with histologic grades. For Kaplan-Meier analysis, each parameter was dichotomized based on a cutpoint obtained using the minimum p value approach (29), and the two-fold cross validation approach was used to validate each cutpoint (30). Kaplan-Meier and Cox proportional hazards analyses were performed to determine the relationship between texture features on arterial/portal-venous-phase images and DFS. Interobserver agreement was measured using intraclass correlation coefficients (ICCs) for a randomly selected third of the study patients (27 of 81 patients). All statistical analyses were performed using commercially available software (MedCalc for Windows 17.6, MedCalc, Mariakerke, Belgium; SAS 9.4, SAS Institute Inc., Cary, NC, USA) with a p value of less than 0.05 considered to indicate a significant difference.
RESULTS
Patients
The mean follow-up period ± SD was 35.95 ± 26.14 months and the median follow-up was 32.6 months. Among the 81 study patients, 48 (59.3%) patients had recurrence and 33 (40.7%) patients had no recurrence during the follow-up period. Extrahepatic metastases developed in 5 of the 81 patients (6.2%), 11–50 months after HCC resection (median, 26.0 months). The locations of the initial extrahepatic metastases were the lung (n = 3), bone (n = 1), and adrenal gland (n = 1). Among these patients, four were treated with systemic chemotherapy, and the other with radiation therapy. Intrahepatic local recurrence developed in 4 of the 81 patients (4.9%), 24–46 months after HCC resection (median, 28.7 months) and intrahepatic distant recurrence developed in 39 of the 81 patients (48.2%), 2–66 months after HCC resection (median, 13.3 months). Among these patients, 31 were initially treated with TACE, 8 with RFA, 2 with PEIT, one with liver transplantation, and one with surgical resection to control the recurrent tumor. The median DFS time of the patients was 34.87 months (95% confidence interval, 24.80–66.47). The estimated 1-, 3-, and 5-year DFS rates after surgery were 72.5%, 48.7%, and 41.1%, respectively.
During the follow-up period, 16 of the 81 patients (19.7%) died. The estimated 1-, 3-, and 5-year OS rates after surgery were 72.5%, 48.7%, and 41.1%, respectively.
Texture Analysis
Correlation with the Histologic Grade of HCC
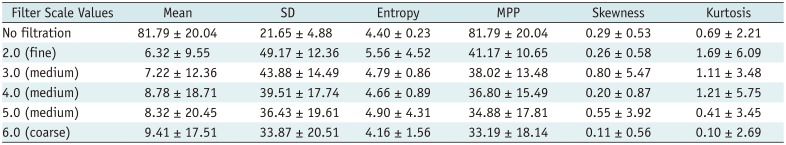
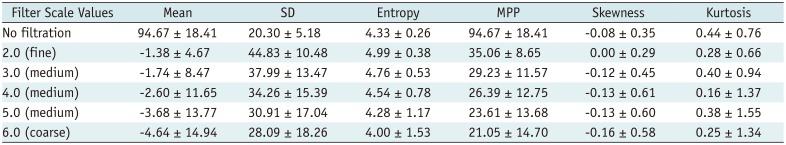
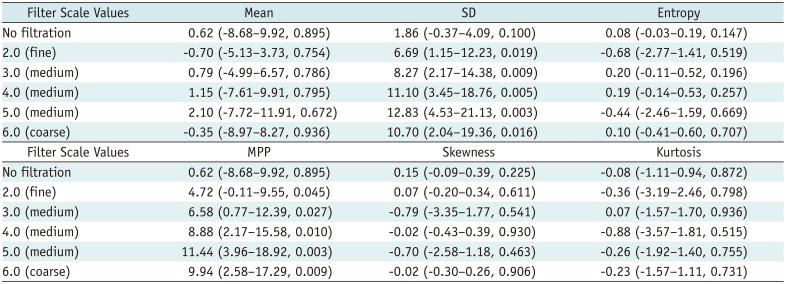
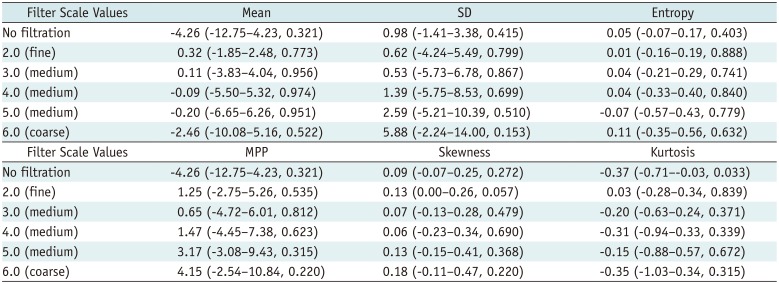
The texture parameters of the pixel distribution histogram on arterial and portal-venous-phase images are summarized in Tables 2 and 3. SD and MPP quantified from fine to coarse texture scales on arterial-phase CT images showed significant positive associations with the histologic grade of the tumors (p < 0.05); high-grade HCCs showed significantly higher MPP and SD than low-grade HCCs at all texture scales on CTTA of arterial-phase CT images (Table 4). However, no significant differences in texture parameters were observed (p > 0.05) between low-grade and high-grade tumors at all filter levels on portal-venous-phase CT images (Table 5). Multiple linear regression analysis revealed that SD and MPP of medium texture scales on arterial-phase images showed an independently significant correlation with the histologic grade of HCC (SD at SSF 4.0, B = 0.009, p = 0.005; MPP at SSF 4.0, B = 0.012, p = 0.013).
Relationship between CTTA and DFS
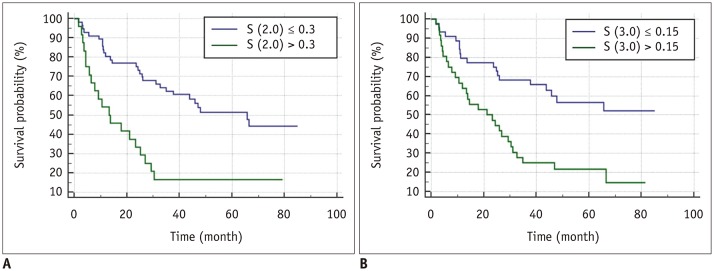
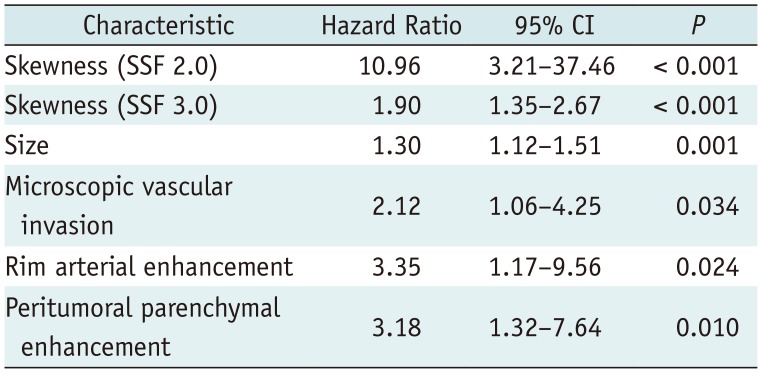
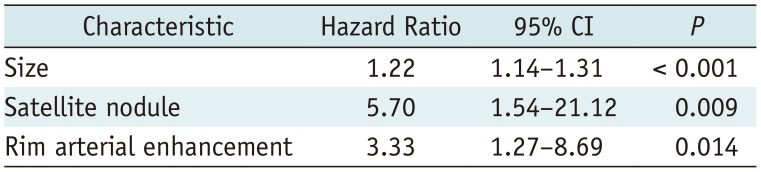
Univariate analysis identified most CT texture parameters across the different filters of fine, medium, and coarse texture scales as significant univariate markers of DFS (Supplementary Tables 1, 2 in the online-only Data Supplement) (Fig. 3). In addition, numerous previously reported imaging and clinico-pathologic features were demonstrated to be significant univariate markers of DFS (Supplementary Table 3 in the online-only Data Supplement). The multivariate analysis, which included all significant univariate markers among the arterial-phase texture parameters and other imaging/clinico-pathological features, identified skewness on arterial-phase images (fine texture scale, SSF 2.0, p < 0.001; medium texture scale, SSF 3.0, p < 0.001), tumor size (p = 0.001), microscopic vascular invasion (p = 0.034), rim arterial enhancement (p = 0.024), and peritumoral parenchymal enhancement (p = 0.010) as independent predictors of DFS (Table 6). Furthermore, the multivariate analysis, which included all significant univariate markers among the portal-venous-phase texture parameters and other imaging/clinico-pathological features, identified that tumor size (p < 0.001), satellite nodule (p = 0.009), and rim arterial enhancement (p = 0.014) were separately independent predictors of DFS (Table 7).
Interobserver Agreement
Most CT texture features across the different filters of fine, medium, and coarse texture scales showed good to excellent interobserver agreement based on the ICCs of the readers (Supplementary Tables 4, 5 in the online-only Data Supplement) (31).
DISCUSSION
Our study demonstrated that SD and MPP quantified from fine to coarse texture scales on arterial-phase CT images showed significant associations with the histologic grade of HCCs after surgical resection. In addition, multivariate analysis identified skewness on arterial-phase CT images (fine and medium texture scales), tumor size, microscopic vascular invasion, rim arterial enhancement, and peritumoral parenchymal enhancement as independent predictors of DFS. Therefore, considering that CTTA is only an additional post-processing tool that analyzes existing CT images without additional radiation exposure to the patient, CTTA features may be used as imaging-based predictive markers of DFS that can reflect the heterogeneity of HCC, which is a well-known feature of malignancy (32). Previous studies have already demonstrated that CTTA parameters may be used as significant predictive markers of survival in other malignant tumors such as non-small cell lung cancer, esophageal cancer, colorectal cancer, renal cell carcinoma, and glioma (1215161733) and our study results are in close agreement with the results of these studies.
In our study, high-grade HCCs showed significantly higher SD and MPP on CTTA of arterial-phase CT images than low-grade HCCs at all texture scales. In CTTA, MPP values only account for pixels greater than 0 and SD values increase with dark or bright objects highlighted by the filter. Therefore, the positive association between the histologic grade of HCCs and MPP/SD reflects the predominance of bright areas on arterial-phase images of tumors with high angiogenesis (27). According to a previous study, when the texture is coarse, heterogeneity is ascribed predominantly to the heterogeneity of the tumor vascular supply, whereas when the texture is fine, texture features also reflect the distribution of the contrast agent between intra- and extravascular extracellular spaces, which may be related to altered permeability (20). Thus, CTTA parameters at various settings may reflect the heterogeneity of tumor vascularity as well as higher permeability. During hepatocarcinogenesis, the normal portal vein and hepatic artery apparently decrease and abnormal intratumoral arterioles develop because of tumor angiogenesis (34). These changes in the blood supply of HCCs create the different patterns of enhancement in the two phases of dynamic contrast-enhanced CT (35363738), which can affect the image texture on contrast-enhanced CT, and CTTA may be able to represent these vascular changes.
We also found that skewness on arterial-phase CT images was an independent predictor of DFS in patients with HCC. More specifically, multivariate analysis identified that skewness greater than 0.3 at SSF 2.0 and skewness greater than 0.15 at SSF 3.0 was associated with poorer DFS. Increased skewness may reflect the average brightness of highlighted objects (blood vessels) (27). Therefore, our results suggest that HCCs with high angiogenesis and variation in vascular permeability may have worse DFS (20). Several studies have demonstrated that in patients with malignant tumors, CTTA could provide predictive information regarding tumor progression or survival. In a study that assessed 57 patients with colorectal cancer, fine texture features of CTTA within the whole tumor were demonstrated to be associated with a poorer 5-year OS rate (20). In addition, other studies focusing on hepatic texture in patients with colorectal cancer have demonstrated that higher heterogeneity of coarse liver texture may be related to the presence of occult malignancies and a poorer prognosis (919). Therefore, our study results suggest that CTTA may provide a useful adjunct to known clinico-pathologic markers, improving the stratification of HCC patients for risk of recurrence, thereby allowing more appropriate modification of surveillance strategies for specific subgroups with a high risk of recurrence.
Notably, our study differed from previously published studies in several aspects. First, we used contrast-enhanced CT images for CTTA rather than unenhanced CT images. Previous studies have shown significant differences in texture features between unenhanced and contrast-enhanced CT images (39). However, we surmised that the pathological changes of HCC could be more clearly depicted on contrast-enhanced CT rather than unenhanced CT images. Second, we included both arterial-phase and portal-venous-phase images for CTTA, whereas most previous studies have used only portal-venous-phase images. As mentioned, considering that HCCs have different patterns of enhancement in the two phases of dynamic contrast-enhanced liver CT, CTTA of both arterial-phase and portal-venous-phase images may be more appropriate than CTTA of portal-venous-phase images alone.
Nevertheless, this study had several limitations. First, the retrospective study design may have created the potential for bias. Previous studies have indicated that the reproducibility and variability of texture analysis is affected by CT vendors, acquisition parameters including acquisition time, and reconstruction methods. Therefore, we included 81 patients who underwent contrast-enhanced CT using the same quadriphasic protocol performed with the same CT scanner. This may have led to a slightly more limited sample size, and even when using the same quadriphasic protocol, the timing of image acquisition can vary slightly from image to image, thus affecting texture analysis results. Therefore, additional studies with a larger number of cases and image processing techniques such as normalization are warranted to apply the study results to other CT vendors. Second, texture analysis in our study was performed in a limited tumor area rather than the whole tumor. However, several previous studies using texture analysis of only the largest cross-sectional area were still able to demonstrate its promise as a predictive biomarker (161718). Nonetheless, additional studies using whole tumor analysis for HCCs are warranted based on a previous investigation that demonstrated that the separation of the Kaplan-Meier curve for 5-year OS with whole tumor analysis was superior to that with single-slice analysis (40).
In conclusion, CTTA was demonstrated to provide texture features significantly correlated with higher tumor grade as well as predictive markers of DFS in patients with HCC in addition to other valuable imaging and clinico-pathologic parameters. If additional studies including whole tumor analysis can validate our results, CTTA has the potential to become a highly useful quantitative biomarker in the management of patients with HCC.
 XML Download