Abstract
Purpose
To analyze the incidence and prevalence of exudative age-related macular degeneration (AMD) and to predict the future AMD populations and health expenditures of intravitreal ranibizumab injection.
Methods
From 2010 to 2014, the National Health Insurance claims data were used to estimate the incidence and prevalence change of exudative AMD, according to demographic characteristics (year, sex, residence, and age). Based on the above results and changes in future population distribution, we estimated the AMD population by 2030. Considering the cost of Intravitreal ranibizumab injection from 2010 to 2014, we predicted the future health expenditure for AMD.
Results
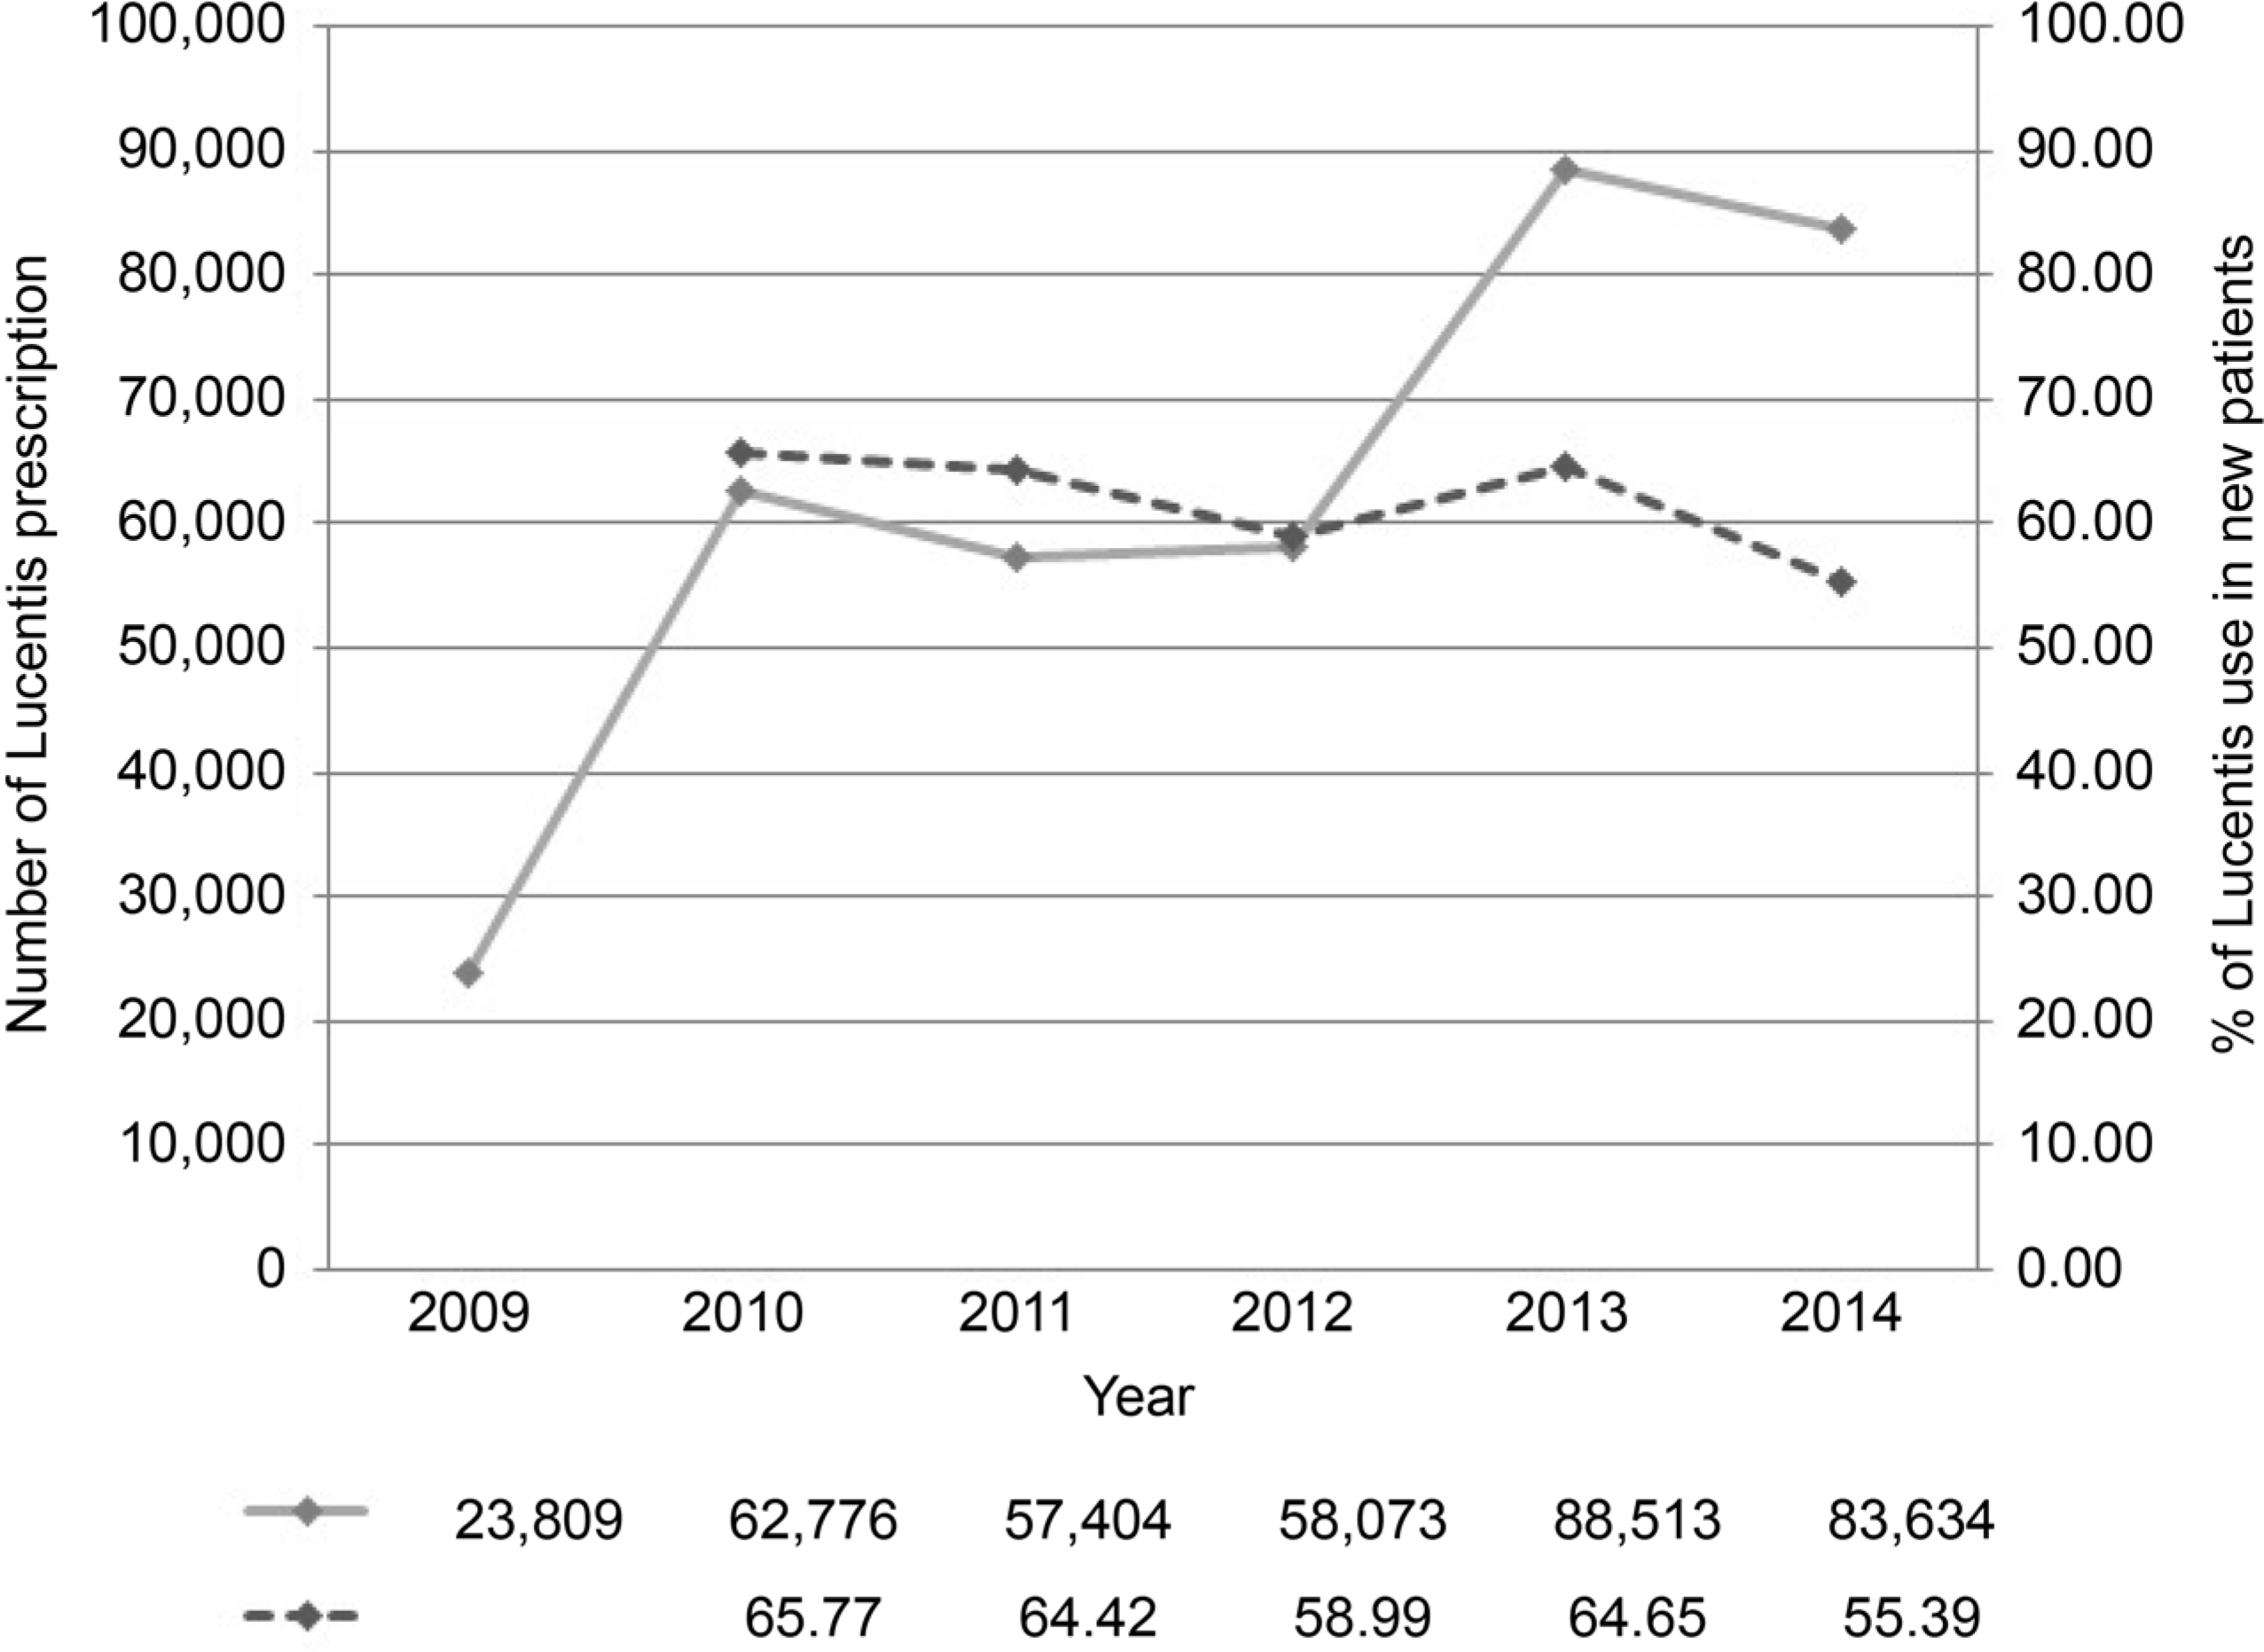
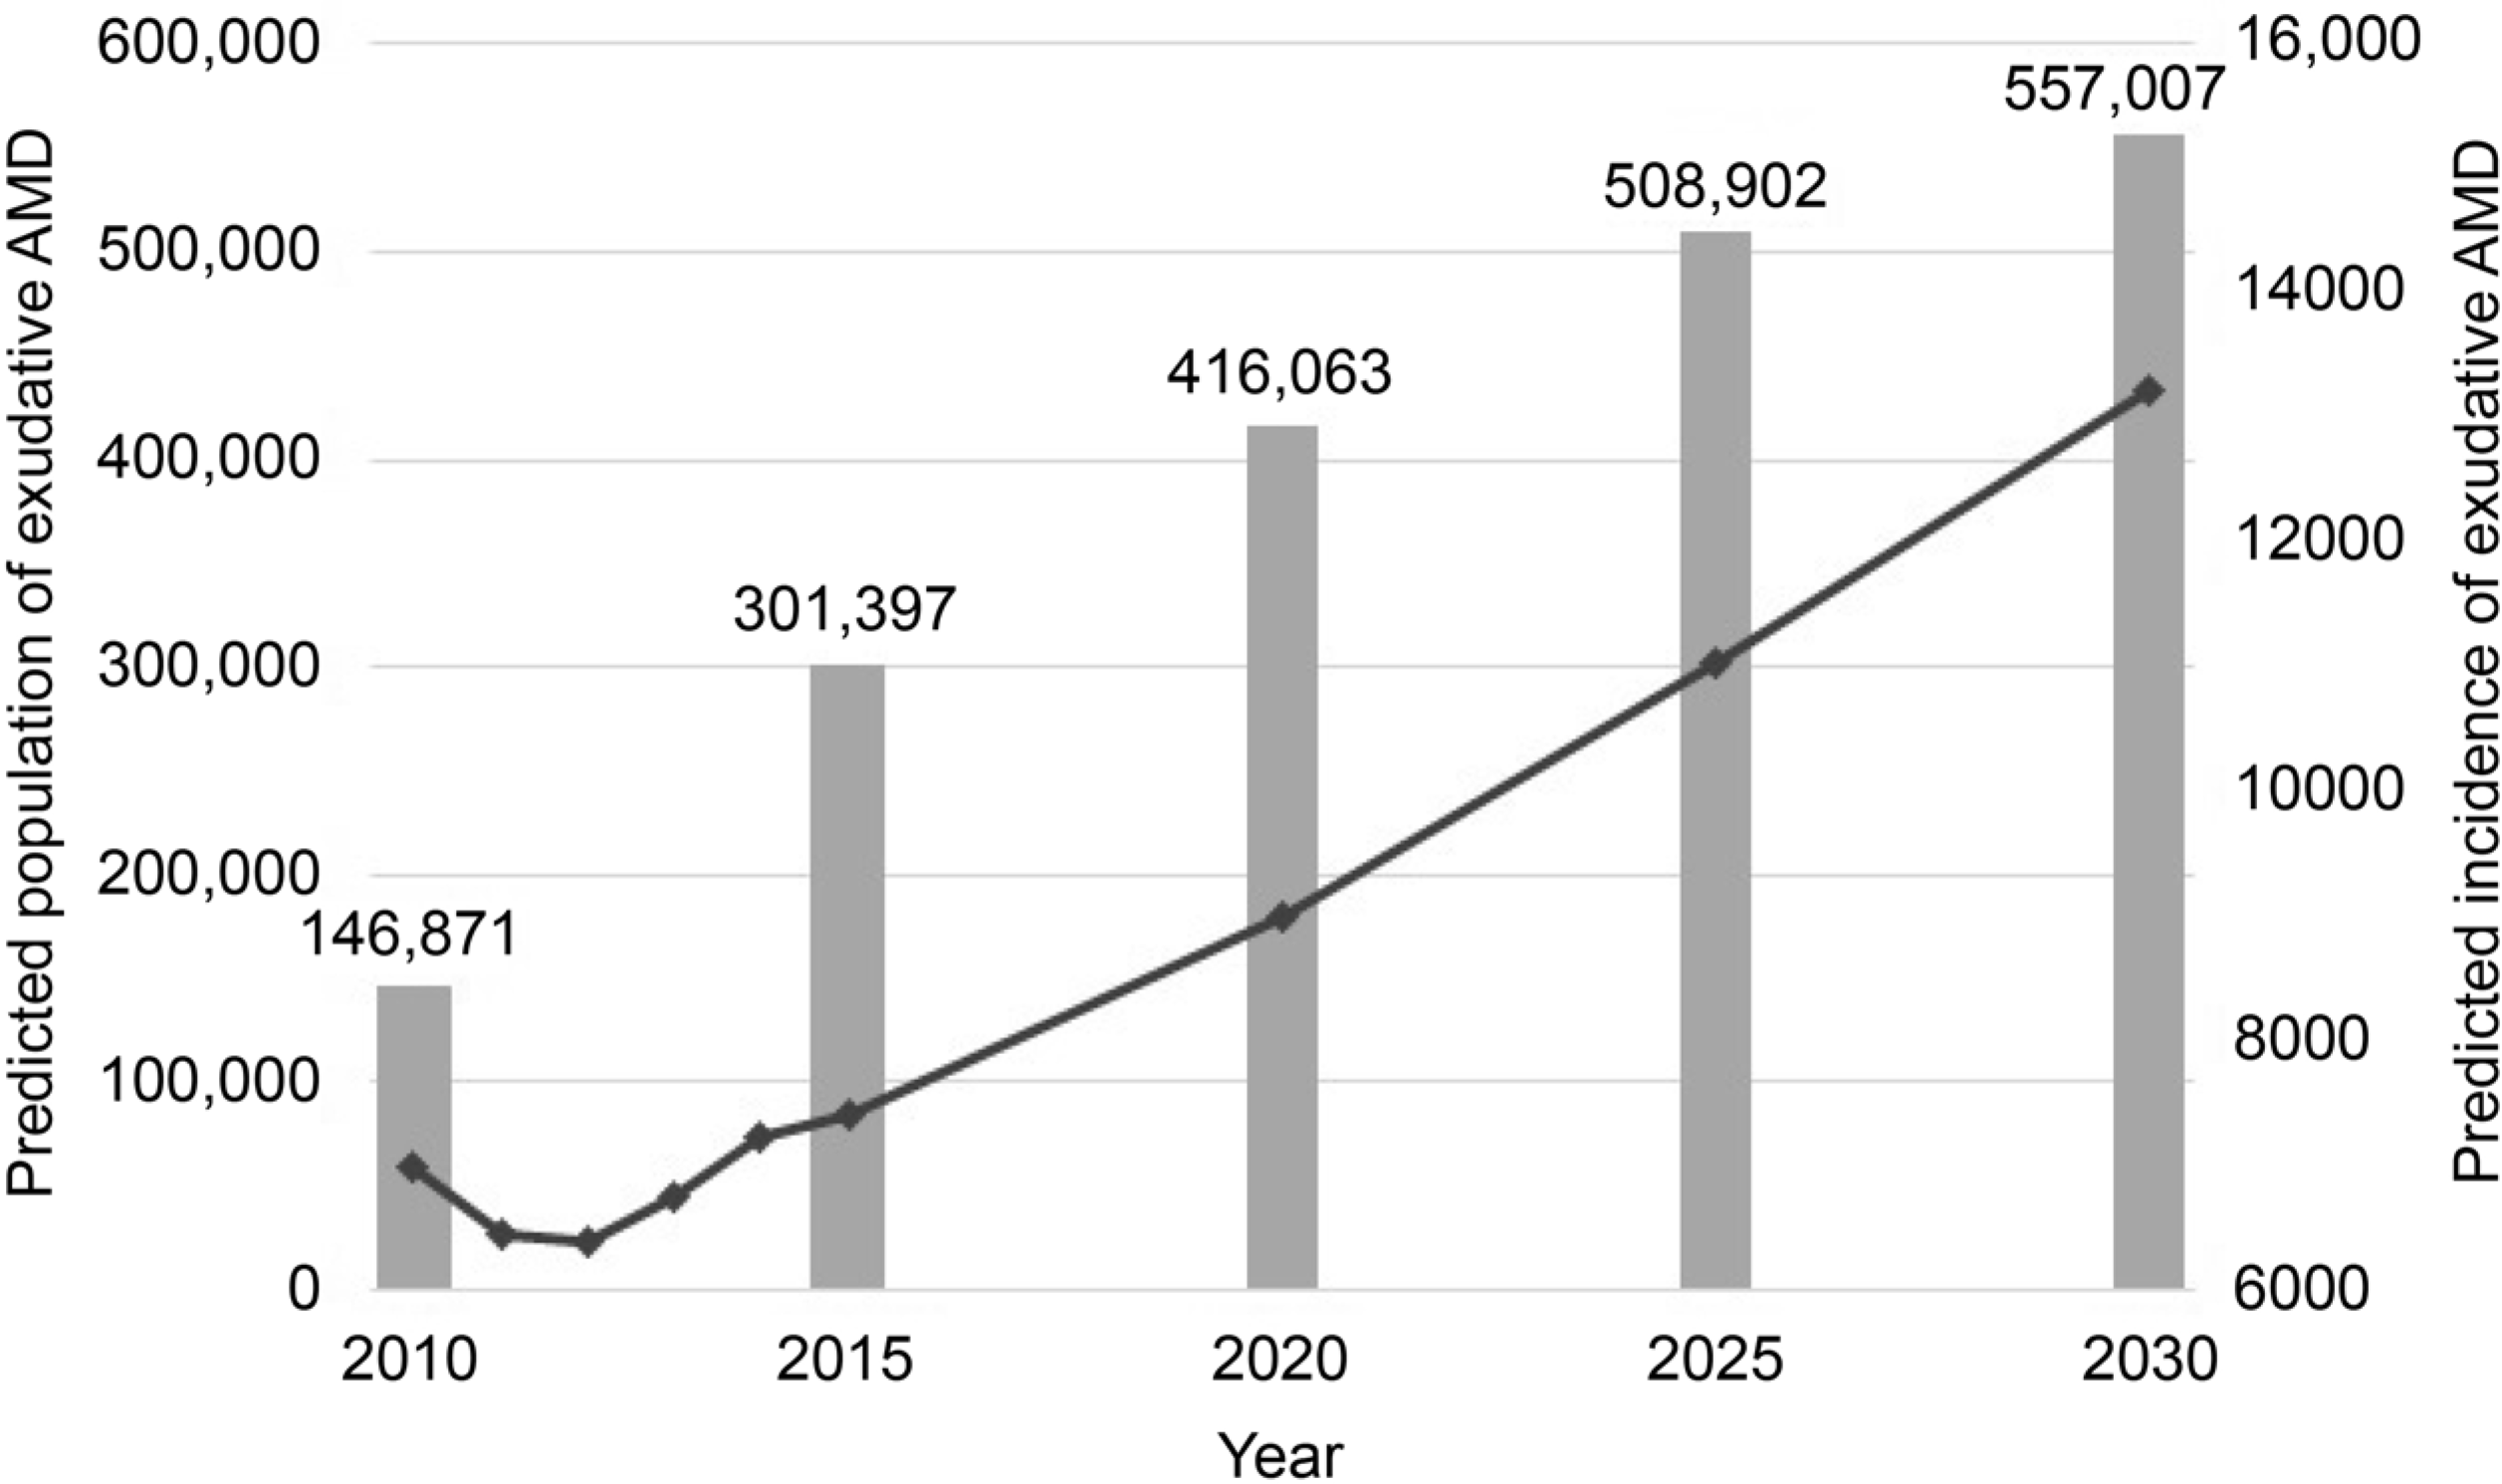
The incidence and prevalence of exudative AMD increased from 14.04 and 295.11 per 100,000 populations in 2010 to 14.25 and 580.71 in 2014, respectively. The prevalence rate was higher in men and showed a large increase over 70 years of age. The ranibizumab was prescribed 13 times per person in average, and the amount consumed increased as the number of insurance coverage increased from 2013. Future AMD populations are predicted to reach 557,007 in 2030 from 146,871 in 2014. As a result, the cost of intravitreal ranibizumab injection is expected to increase from 83.6 billion won in 2014 to 171.7 billion won in 2030.
Go to : 
References
1. Congdon N, O'Colmain B, Klaver CC, et al. Causes and prevalence of visual impairment among adults in the United States. Arch Ophthalmol. 2004; 122:477–85.
2. Klein R, Klein BE, Linton KL. Prevalence of age-related maculopathy. The Beaver Dam Eye Study. Ophthalmology. 1992; 99:933–43.
3. World Health Organization. Vision 2020: the right to sight. Global initiative for the elimination of avoidable blindness: action plan 2006–2011. http://apps.who.int/iris/handle/10665/43754. Accessed February 24, 2014.
4. Lee PP, Feldman ZW, Ostermann J, et al. Longitudinal prevalence of major eye diseases. Arch Ophthalmol. 2003; 121:1303–10.

5. Rein DB, Wittenborn JS, Zhang X, et al. Forecasting age-related macular degeneration through the year 2050: the potential impact of new treatments. Arch Ophthalmol. 2009; 127:533–40.
6. Wong WL, Su X, Li X, et al. Global prevalence of age-related abdominal degeneration and disease burden projection for 2020 and 2040: a systematic review and meta-analysis. Lancet Glob Health. 2014; 2:e106–16.
7. Park SJ, Lee JH, Woo SJ, et al. Age-related macular degeneration: prevalence and risk factors from Korean National Health and Nutrition Examination Survey, 2008 through 2011. Ophthalmology. 2014; 121:1756–65.
8. Cho BJ, Heo JW, Kim TW, et al. Prevalence and risk factors of age-related macular degeneration in Korea: the Korea National Health and Nutrition Examination Survey 2010–2011. Invest Ophthalmol Vis Sci. 2014; 55:1101–8.

9. Statistics Korea. Population Projections for Korea: 2010–2060 (Based on the 2010 Census). Korean Statistical Information Service. http://kosis.kr/publication/publicationThema.do. Accessed August 1, 2012.
10. Statistics Korea. Population Statistics Based on Resident Registration 2014. Korean Statistical Information Service. http://kosis.kr/pub-lication/publicationThema.do. Accessed March 1, 2018.
Go to : 
 | Figure 1.The incidence and prevalence change of exudative AMD according to demographic characteristics (year, sex, residence, and age) (person/100,000 populations). Age-standardized incidence and prevalence rate by sex (A, B), incidence and prevalence rate by age group (C, D), age-standardized incidence and prevalence rate by residence (E, F). AMD = age-related macular degeneration. |
 | Figure 2.The number of Ranibizumab pre-scriptions by year and percentage of Ranibizumab use in new exudative AMD patients. Number of Ranibizumab prescription (solid line), percentage of Ranibizumab use in new AMD patients (dashed line). AMD = age-related macular degeneration. |
 | Figure 3.Predicted population and incidence of exudative AMD by year. Based on the incidence from 2010 to 2014 and future population estimates, the population of exudative AMD is expected to increase gradually. AMD = age-related macular degeneration. |
Table 1.
Change of incidence and prevalence rate (person/100,000 populations)
| 2010 | 2011 | 2012 | 2013 | 2014 | ||
|---|---|---|---|---|---|---|
| Incidence rate | Total | 14.04 | 12.91 | 12.74 | 13.38 | 14.25 |
| Male | 15.99 | 15.41 | 15.26 | 16.40 | 17.39 | |
| Female | 12.08 | 10.40 | 10.22 | 10.37 | 11.10 | |
| Age standardized incidence rate* | Total | 14.30 | 12.66 | 11.90 | 12.04 | 13.15 |
| Male | 16.18 | 14.93 | 13.98 | 14.39 | 15.31 | |
| Female | 12.37 | 10.28 | 9.66 | 9.48 | 10.61 | |
| Prevalence rate | Total | 295.11 | 361.74 | 458.48 | 519.70 | 580.71 |
| Male | 341.42 | 417.81 | 534.62 | 609.84 | 687.48 | |
| Female | 248.64 | 305.52 | 382.21 | 429.50 | 473.96 | |
| Age standardized prevalence rate* | Total | 300.84 | 354.89 | 427.20 | 466.20 | 535.74 |
| Male | 345.74 | 404.60 | 487.44 | 531.87 | 600.91 | |
| Female | 254.83 | 302.57 | 361.56 | 392.70 | 453.87 |
Table 2.
Distribution of incidence and prevalence rate by age group (person/100,000 populations)
Table 3.
Distribution of incidence and prevalence rate by region (person/100,000 populations)
| Year | Seoul | Metropolitan | Gyeonggi/Gangwon-do | Chung-cheong-do | Jeolla-do G | Gyeong-sang-do | Jeju-do | |
|---|---|---|---|---|---|---|---|---|
| Incidence rate | 2010 | 14.48 | 13.96 | 12.05 | 12.70 | 20.20 | 14.68 | 11.70 |
| 2011 | 13.96 | 13.14 | 11.47 | 11.13 | 17.75 | 12.24 | 13.57 | |
| 2012 | 13.11 | 13.13 | 11.51 | 10.21 | 16.23 | 13.94 | 11.64 | |
| 2013 | 14.29 | 13.46 | 12.43 | 10.42 | 16.77 | 14.03 | 12.31 | |
| 2014 | 16.54 | 14.61 | 12.35 | 10.64 | 18.36 | 13.96 | 13.91 | |
| Age standardized incidence rate* | 2010 | 14.48 | 13.96 | 12.05 | 12.70 | 20.20 | 14.68 | 11.70 |
| 2011 | 13.26 | 12.51 | 10.88 | 10.80 | 17.20 | 11.80 | 12.98 | |
| 2012 | 11.79 | 11.90 | 10.47 | 9.65 | 16.20 | 13.00 | 10.77 | |
| 2013 | 12.20 | 11.64 | 10.82 | 9.54 | 16.14 | 12.64 | 11.12 | |
| 2014 | 13.42 | 12.11 | 10.36 | 9.49 | 17.35 | 12.19 | 12.24 | |
| Prevalence rate | 2010 | 262.44 | 354.34 | 232.99 | 246.40 | 451.09 | 280.20 | 349.93 |
| 2011 | 335.27 | 445.29 | 284.54 | 262.67 | 549.01 | 354.10 | 345.07 | |
| 2012 | 443.48 | 579.73 | 351.58 | 308.39 | 606.29 | 477.94 | 435.75 | |
| 2013 | 517.88 | 631.69 | 404.16 | 382.05 | 689.58 | 531.41 | 537.39 | |
| 2014 | 596.06 | 715.72 | 443.27 | 396.18 | 789.15 | 577.22 | 521.46 | |
| Age standardized prevalence rate* | 2010 | 262.44 | 354.34 | 232.99 | 246.40 | 451.09 | 280.20 | 349.93 |
| 2011 | 317.78 | 423.18 | 270.18 | 255.32 | 532.75 | 341.85 | 328.75 | |
| 2012 | 396.51 | 523.47 | 319.54 | 291.19 | 606.45 | 445.66 | 402.55 | |
| 2013 | 437.80 | 542.18 | 351.79 | 349.69 | 667.33 | 479.45 | 482.81 | |
| 2014 | 478.66 | 587.39 | 370.94 | 354.18 | 744.65 | 504.49 | 457.37 |
Table 4.
Predicted population and incidence of AMD
| Year | Total population | Population over 40 years | AMD population | New AMD patients | Health expenditures of ranibizumab (1,000 won) |
|---|---|---|---|---|---|
| 2010 | 49,410,366 | 22,979,003 | 146,871 | 6,985 | 62,776,000 |
| 2014 | 50,423,955 | 25,629,560 | 294,195 | 7,218 | 83,634,000 |
| 2015* | 50,015,202 | 25,708,391 | 301,397 | 7,398 | 96,174,000 |
| 2020* | 49,823,972 | 27,726,757 | 416,063 | 9,004 | 117,052,000 |
| 2025* | 49,212,973 | 29,360,904 | 508,902 | 11,039 | 143,507,000 |
| 2030* | 48,268,309 | 30,207,650 | 557,007 | 13,213 | 171,769,000 |


 PDF
PDF ePub
ePub Citation
 Print
Print


 XML Download