

 PDF
PDF ePub
ePub Citation
 Print
Print


INTRODUCTION
Growth is a topic of high interest in the area of pediatrics. Failure of children to achieve adequate growth is considered a morbidity. Failure to thrive (FTT) refers to a decrease in growth rate or lack of weight gain appropriate for the child's age. Although there is no well-established standard definition for FTT, three distinct criteria are applied: 1) a decrease in weight below the third or fifth percentile, 2) a weight below 80% of the ideal weight for age, and 3) a downward crossing of ≥2 major percentile lines on a weight-for-age chart [12]. In the United States, FTT accounts for 1% to 5% of all hospital admissions in children younger than 2 years and 10% of children seen in primary care practices exhibit signs of inadequate growth [1]. The importance of identifying and treating FTT is underscored by its association with increased risks of low intelligence quotient, learning difficulties, developmental delays, and behavioral problems in affected children [3456].
Generally, FTT is caused by an inability to obtain sufficient calories to maintain growth. This may be attributed to: 1) an inadequate intake of nutrients required for growth, 2) nutrient malabsorption that reduces the bioavailability of consumed nutrients, or 3) an increased metabolic demand due to a chronic disease or genetic or metabolic disorder. An underlying medical condition can lead to failure to growth and present as organic FTT. However, in 90% of FTT cases, there is no underlying medical diagnosis. These cases are described as nonorganic FTT (NOFTT) [5].
NOFTT is most frequently caused by an insufficient intake of calories [7]. It may also be associated with micronutrient deficiencies in children receiving insufficient nutrition. Although an association between NOFTT and serum micronutrient deficiencies seems reasonable, few reports in the literature have described such an association. Moreover, previous studies reported contradictory results. Therefore, the objective of the present study was to investigate micronutrient status of children with NOFTT and that of healthy children.
MATERIALS AND METHODS
Study population
A total of 264 patients who visited a single institution with a concern of nutrition and growth between January 2006 and July 2016 were originally enrolled for this study. Patients with underlying diseases such as neurodevelopmental diseases, cardiac anomalies, metabolic disorders, endocrinopathies, and genetic abnormalities that might affect growth and weight gain were excluded (Fig. 1).
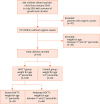
Data were obtained retrospectively by reviewing children's medical records. Children with weight for age below the third percentile without having underlying diseases were assigned to the NOFTT group while those with normal weight for age (above the tenth percentile) were assigned to the control group. Within the NOFTT group, children with weight for age below the first percentile were further classified into the severe NOFTT subgroup.
The study protocol was designed and conducted in accordance with the Declaration of Helsinki. This study was approved by the Institutional Review Board of Severance Hospital (IRB approval No. 4-2018-0792)
Data collection
1. Anthropometric data
Data such as patient's height, body weight, and body mass index (BMI) were obtained through review of electric medical records and analyzed using the Children and Youth Standard Growth Chart.
2. Laboratory data
Complete blood count, including white blood cell count, hemoglobin level, and platelet count, was determined to evaluate anemia and inflammatory status in each patient. Patients' serum iron levels, total iron binding capacity, transferrin saturation, and ferritin levels were analyzed to determine their iron deficiency status. A thyroid function test, including free thyroxine (fT4), triiodothyronine (T3), and thyroid-stimulating hormone was performed to rule out underlying thyroid issues. Immunoglobulin G, A, and M levels were measured to identify potentially immunocompromised status. Biochemical parameters, including serum levels of calcium, inorganic phosphate, magnesium, cholesterol, total protein, and albumin were measured to evaluate children's general nutritional status.
Statistical analysis
All statistical analyses were performed using SAS version 9.4 (SAS Inc., Cary, NC, USA). Significance level was set at 5% for two-sided test. A two-sample independent t-test was performed for comparisons of weight for age, BMI for age, and micronutrient levels between the control and NOFTT groups. Similar comparisons were made between the control and severe NOFTT groups.
RESULTS
Comparison between children with NOFTT and healthy controls
Of 161 patients enrolled in our study, 106 (70.2%) were assigned to the NOFTT group. Table 1 depicts demographic and anthropometric characteristics by group (NOFTT vs. control). Although the two groups did not show a significant difference in age, they showed significant differences in percentiles of mean height for age (NOFTT vs. control: 17.81±12.27 vs. 45.33±22.40, p<0.01), weight for age (1.34±0.86 vs. 31.65±21.80, p<0.01), and BMI for age (2.13±2.49 vs. 32.85±1.987, p<0.01).
Table 1
Comparison of anthropometric and laboratory data between the NOFTT and control groups
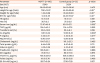
The control group had significantly higher serum calcium and inorganic phosphate levels than the NOFTT group (9.96±0.45 vs. 9.81±0.44 mg/dL, p=0.048; and 5.22±0.52 vs. 5.02±0.51 mg/dL, p=0.017, respectively). However, these values were within normal ranges in both groups. In contrast, the NOFTT group had significantly higher serum iron levels than the control group (75.7±46.9 vs. 63.05±27.1 µg/dL, p=0.032). The NOFTT group also exhibited higher transferrin saturation level than the control group, although such difference was not statistically significant (23.0%±10.13% vs. 20.5%±9.3%, p=0.128) (Table 1).
Comparison between children with severe NOFTT and healthy controls
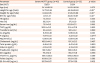
A total of 43 children were assigned to the severe NOFTT group. We found no statistically significant difference in mean age between the control and severe NOFTT groups. In contrast, significant difference in several anthropometric parameters were found between the two groups: height for age (NOFTT vs. normal control: 14.77±11.58 vs. 45.33±22.40, p<0.01), weight for age (0.49±0.25 vs. 31.65±21.80, p<0.01), and BMI for age (1.04±1.41 vs. 32.85±1.987, p<0.01).
Regarding laboratory data, we found a significantly higher inorganic phosphate level in the control group than that in the severe NOFTT group (5.22±0.52 vs. 4.97±0.53 mg/dL, p=0.044). However, these values were within normal range in both groups. No statistically significant differences were found for other laboratory parameters (Table 2).
Table 2
Comparison of anthropometric and laboratory data between the severe NOFTT and control groups
DISCUSSION
Micronutrients such as vitamins and trace minerals (e.g., copper, zinc, iron, iodine, manganese, selenium) are essential elements that are required in small quantities to modulate physiological functions [8]. Although deficiencies in single micronutrients are relatively easily recognized and treated, subclinical deficiencies that often involve multiple micronutrients are more difficult to recognize [9]. Each micronutrient plays a different role in the human body. Micronutrient deficiencies can manifest as a variety of symptoms, including a decline in cognitive function, increased risk of infection, reduced physical growth, developmental delays, and even mortality [101112].
NOFTT accounts for most cases of FTT. The most important factor in NOFTT is an insufficient calorie intake. This occurs most commonly due to environmental issues such as neglect, indifference, and feeding disorders. Family factors such as mental health disorders, inadequate nutritional knowledge, and financial difficulties can contribute to inadequate caloric intake that may lead to FTT [13]. The caregiver's psychological state, his/her bond with child, knowledge, and interests about nutritional status are related to NOFTT. Children with these issues can also experience an insufficient intake of micronutrients, resulting in deficiency. Therefore, micronutrient deficiencies (such as those in zinc, serum iron, or serum copper) have been conventionally regarded as consequences of NOFTT in children. They not only cause weight loss or FTT, but also cause problems with immunity and development [141516].
However, few previous research has been conducted on the association between micronutrients and FTT. In 2009, Aburto et al. [17] found an association between iron deficiency anemia and undernourished children in Mexico. In contrast, Berkovitch et al. [18] failed to detect deficiencies in serum copper or zinc levels among either patients with NOFTT or healthy controls in 2003. There is no published literature on the correlation between different types of micronutrients and FTT in children.
In our study, we observed no statistically significant differences in micronutrient levels between patients with NOFTT and healthy controls except for serum calcium and inorganic phosphate levels. However, both groups had levels within normal ranges. Calcium and inorganic phosphate levels are related to vitamin D and parathyroid hormone deficiencies [19]. However, vitamin D deficiency was not suspected in our study as the mean 25-hydroxy-vitamin D levels in the NOFTT and control groups were 29.17±9.24 ng/mL and 27.10±7.29 ng/mL, respectively, both of which were within the normal range (20–50 ng/mL). Moreover, these levels showed no statistically significant difference between the two groups (p=0.157) [2021]. Furthermore, since calcium and phosphate levels were within normal ranges, no association with parathyroid hormone was considered. Therefore, differences in serum phosphate and calcium levels between the NOFTT and control groups are not likely to be clinically meaningful. Similar to Berkovitch et al.'s study [18], we did not detect any statistically significant difference in zinc levels between the two groups.
We then analyzed differences between children with severe NOFTT and healthy controls to identify potential associations between their micronutrient levels and FTT. However, we again found no statistically significant differences between the two groups.
South Korea is a relatively developed country without extreme food insecurity. Even children with NOFTT can maintain an adequate level of food intake. They may not be deficient in trace elements or micronutrients. Thus, a low serum level of a particular microelement in children with NOFTT should not be undertaken. It should be regarded as a serious problem.
To the best of our knowledge, our study is the first one to assess a large panel of micronutrients in children with FTT. Although our results did not show any significant differences between groups, this study emphasized the clinical importance of micronutrient deficiencies.
This study has some limitations. First, we could not determine post-interventional changes in micronutrient levels since this was a retrospective study. Since most children follow their own growth curve, prospective studies that take birth weight into account and continue to follow the growth curve are needed. Second, the number of types of trace elements analyzed in this study is limited. There are difficulties in measuring the concentration and insufficiency of micronutrients in the body [22]. In this study, various micronutrients were analyzed in comparison with previous studies. However, many other micronutrients were not included. Micronutrients included in this study are relatively easy to inspect and their measurements are well established in the hospital. Other micronutrients that are not included cannot be assured that there is no shortage. Further evaluation of other micronutrients not included in this study is required in future studies. Third, the intake of each micronutrient might have varied among individuals. In addition, it was difficult to evaluate the correlation between the intake amount and micronutrient serum levels. Preschool children of South Korea took in more diet supplement than preschool children of the United States and Japan [23]. About 50% of children in South Korea have taken diet supplement, of which about 35% have multiple vitamins/minerals [24]. In this context, nutritional support (e.g., using multivitamins) might have a significant impact on micronutrient status. A future prospective study is needed to analyze micronutrient levels.
In conclusion, significant micronutrient deficiencies in children with NOFTT should not be expected in developed countries. Therefore, a more cautious approach is needed for patients with NOFTT and micronutrient deficiency.
 XML Download