

 PDF
PDF ePub
ePub Citation
 Print
Print


INTRODUCTION
Infancy is a vulnerable period for brain development, and nutritional inadequacy, in another words malnutrition, in this period may negatively influence the neurocognitive development in the later life of a developing child. Malnutrition may influence neurocognitive development by directly affecting the brain structural development, or indirectly by affecting children's experience and motor behavior. The incidence of malnutrition also alters the cell numbers, cell migration, myelinisation, synaptogenesis, hippocampal formation and neurotransmission of a child's developing brain, due to inadequate availability of energy, protein and micronutrients lacking during this critical brain development process in children. Additionally, it may affect the overall health and well-being of a child, by reducing immune competence and resistance to infections, and affect the prolonged duration of recovering from the infections. Chronic and frequent infections may affect the child's physical activity and interactions with the environment [123].
Micronutrients deficiencies are a widespread problem in children throughout the globe, especially iron deficiency anemia (25% under the age of 3 years), inadequate zinc, iodine intake and vitamin B12 deficiency. Micronutrients are involved in the brain development, and deficiencies are traditionally associated with cognitive and motor impairment [4]. There has been an increasing interest regarding the role of long chain polyunsaturated fatty acids (LC-PUFA) on the neurocognitive development in children in recent years. These fatty acids are critical for the brain development and function in children, and play a central functional role in brain tissue development, which are precursors for the mediators that play a role in the immune reactions, inflammation and the influence of neuronal signal processing and transmission in children [5].
Magnetic resonance spectroscopy (MRS) is a novel advanced imaging technique used as a tool to identify and categorize non-invasive information about the biochemical composition of imaged tissue. The clinical uses in pediatrics of this test include the diagnosis of brain tumors and inherited metabolic diseases and prognosis of hypoxic-ischemic encephalopathy, traumatic brain injury, demyelinating conditions and infectious brain lesions [6]. Neurocognitive impairment is expected in infants with malnutrition. But its association with micronutrients, LC-PUFA levels and MRS findings was not widely evaluated in the past. Therefore, we aimed to analyze the neurocognitive functions in infants with malnutrition and its association with LC-PUFA, micronutrients levels and MRS findings.
MATERIALS AND METHODS
The study included two groups of infants aged between 2–36 months; group 1, infants with malnutrition (n=24) and group 2; age and sex matched healthy infants (n=21). The diagnosis of malnutrition was made according to the standard World Health Organization (WHO) guidelines. Severe malnutrition is defined as the presence of weight for height Z score <3 standard deviation or presence of bilateral nutritional edema or visible severe wasting [7]. Infants with prematurity, intrauterine growth retardation, neurometabolic diseases, and structural central nervous system anomalies or diseases associated with neurocognitive impairment (such as congenital hypothyroidism) were not included into the group 1. None of the infants in group 2 had known chronic diseases, prematurity or intrauterine growth retardation.
After informant and written consent from the parents of the infants, anthropometric measurement was performed. Then, the sample of peripheral blood was obtained for studying the complete blood count, albumin, lipid and micronutrients level including calcium, magnesium, iron, folic acid, zinc, vitamin A and B12 levels and LC-PUFA levels (arachidonic acid [AA] and docosahexaenoic acid [DHA]). Then, a neurocognitive development assessment and MRS were performed for all infants.
Assessment of neurocognitive development
The neurocognitive development of the infants was analyzed with the use of an Ankara Developmental Screening Inventory (ADSI) test. This tool was developed by Erol et al. [8] as a culturally relevant device to yield an index of the developmental status of children. The ADSI is a measurement tool that evaluates five component scales (general development, social and self-care skills, fine motor and gross motor developments, and language-cognitive language), and total points (T points) of children between the age of 1 month and 6 years. The inventory consisted of 154 items answered by the mothers of the children as either response of a “yes” or “no.” If a child received a score of 20%–30% lower than the average score for his or her age in at least two subtests, he or she was classified as having poor neurocognitive development [9].
MRS analysis
Multivoxel MRS (TR/TE, 1.500/135) was performed on all infants with a standard head coil and 1.5-T MRI system (Magnetom Symphony; Siemens Healthcare, Erlangen, Germany). Three orthogonal baseline images were obtained with automated magnetic field shimming. A volume of interest with a thickness of 15 mm was placed on the centrum semiovale directly over the corpus callosum, and parallel to the sphenoidal plane. After optimal water signal suppression with chemical shift–selective techniques, the MRS data were collected. The entire evaluation was completed within 7 minutes. Three specific voxels were selected from the bilateral thalamus, basal ganglia and from the white matter within the volume of interest. Spectra were generated by the use of a Fourier transformation from the data collected, from these eight specific voxels within the volume of interest. After manual baseline correction (near zero) procedures, the metabolite peaks were determined. Three dominant spectra (choline [Cho] at 3.21 parts per million, creatine [Cr] at 3.04 parts per million, and N-acetylaspartate [NAA] at 2.02 parts per million) were analyzed.
Determination of LC-PUFA in erythrocyte membranes
Erythrocyte membranes were isolated from red blood cells according to the method of Hamaguchi et al. [10]. Preparation of fatty acid methyl esters in erythrocyte membranes was performed by using the method of Sattler et al. [11], with some modifications. Fatty acid composition of the erythrocyte membrane was determined by a gas chromatographic method (Agilent Technologies 6890N; Agilent Technologies, Waldbronn, Germany) using a flame ionization detector. Experimental conditions for gas chromatographic flame ionization detector were as follows; column: HP-88 capillary column 100 m×0.250 mm×0.20 µm nominal, inlet temperature: 250°C, injection volume: 1 μL, carrier gas: helium, head pressure: 230 kPa constant pressure (33 cm/s at 50°C), oven temperature: 120°C for 1 minute, 10°C/min to 175°C, hold at 175°C for 10 minutes, 5°C/min to 210°C, hold at 210°C for 5 minutes, 5°C/min to 230°C, hold at 230°C for 10 minutes. Analytical standard (Supelco 37-component FAME mixture, 47885-U; Sigma-Aldrich Co., Dorset, UK) was used for the verification of retention times. DHA and AA in erythrocyte membranes were reported as weight percentages of the total fatty acids analyzed.
Statistical analysis
Statistical analysis was performed using the Statistical Package for Social Sciences version 23 (IBM Corp., Armonk, NY, USA). The noted differences between the groups were calculated using an independent samples t-test (Student's t-test) for the normally distributed data and the Mann-Whitney U test for data that was not normally distributed. A χ2 test was used for the comparisons of qualitative data. Correlations between the variables were calculated using a linear regression. The values of p<0.05 were considered significant.
Informed consent for participating in the study was obtained from parents of all cases, and the study was approved by the ethics committee (2013/129). The study was funded by the Karadeniz Technical University Scientific Research Projects Unit (study ID: 6704 and code number: 11560).
RESULTS
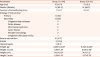
The demographic and clinic findings of the patients and control group are shown in Table 1. No difference was found between the groups in terms of age, gender and duration of breastfeeding (p>0.05 for all). As expected, anthropometric parameters including weight, weight Z score, height and height Z score were lower in patients with malnutrition (p<0.05 for all). According to the WHO guidelines, 10 patients (41.7%) had severe malnutrition.
Table 1
Demographic and clinic findings of the patients and control group
Neurocognitive functions of the infants with malnutrition and who were in the control group are shown in Table 2. All neurocognitive functions were found to be lower in infants with malnutrition (p<0.05 for all).
Table 2
Neurocognitive functions of the patients with malnutrition and healthy controls
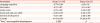
Laboratory parameters of the patients and control group are shown in Table 3. Total protein, albumin, total cholesterol, Ca and Mg levels were significantly low in patients with malnutrition (p<0.05 for all). No significant difference was found in LC-PUFA levels within the groups.
Table 3
Laboratory parameters of the patients and control group
Values are presented as mean±standard deviation or number (%).
HDL: high-density lipoprotein, LDL: low-density lipoprotein, Ca: calcium, Mg: magnesium, Fe: iron, Zn: zinc, LC-PUFA: long-chain polyunsaturated fatty acids, AA: arachidonic acid, DHA: docosahexaenoic acid.
a–b, c–d, e–f, g–h, i–j
p<0.05.
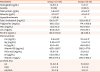
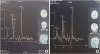
The MRS findings of the patients and control group is shown in Fig. 1. It is noted that the Cho/Cr ratio was higher in all regions in infants with malnutrition, but only thalamic Cho/Cr ratio showed a significant difference (1.33±0.22 vs. 1.18±0.22, p<0.05) (Fig. 2).
Fig. 1
MRS findings of malnourished and healthy infants. Note thalamic Cho/Cr ratio was higher in infants with malnutrition (1.33±0.22 vs. 1.18±0.22).
MRS: magnetic resonance spectroscopy, Cho: choline, Cr: creatine, NAA: N-acetylaspartate.
*p<0.05.
Fig. 2
MRS image of thalamic Cho/Cr ratio of a patient (A) and an infant in the control group (B).
MRS: magnetic resonance spectroscopy, Cho: choline, Cr: creatine.
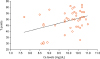
Correlation analysis of parameters such as micronutrients and LC-PUFA levels with total T points was revealed that the T points was only correlated with serum Ca levels (p<0.05, r=0.381) (Fig. 3). No correlation was found between the LC-PUFA and total T points. Additionally, no correlation was found between the MRS findings and total T points.
DISCUSSION
The association between malnutrition and neurocognitive development in children have been extensively researched in animal models and human studies in previous studies [121314151617]. In this study, we analyzed neurocognitive functions and its associations with micronutrients, LC-PUFA levels and MRS findings in infants with malnutrition. We found that 1) all parameters of neurocognitive functions and serum total cholesterol, Ca and Mg levels were low in infants with malnutrition, 2) no difference was found in LC-PUFA levels between healthy and malnourished infants, 3) thalamic Cho/Cr levels were significantly high in infants with malnutrition, and 4) total neurocognitive development (T points) in infants was positively correlated with serum Ca levels.
Serum lipid profiles were studied in malnourished children previously, and similar to our study total cholesterol levels were found to be low in malnourished children compared to healthy controls in all studies [18192021]. Additionally, they also found that low-density lipoprotein and high-density lipoprotein levels were low and triglyceride levels were high in malnourished children. Disturbance of the lipid metabolism in malnourished children were attributed to low lipoprotein lipase activity in malnourished infants. Hypocalcemia was found in 26% of the infants with malnutrition at initial admission and found to be associated with an increased risk of mortality on the follow-up [22]. Hypocalcemia was mainly related in this case, with dietary deficiencies or increased metabolic loses. Similar to Ca, Mg levels were also found low in children with malnutrition, and this result was associated with an incidence of lethargy and refractory convulsions in the children [23].
We did not find any difference in the serum LC-PUFA levels between malnourished and healthy infants. Additionally, no association was found between LC-PUFA levels and neurocognitive functions. Contrary to our study, El-khayat et al. [24], showed that LC-PUFA levels were low in children with protein energy malnutrition, and neurocognitive functions were positively correlated with LC-PUFA levels. Neurocognitive functions were improved after nutritional rehabilitation with LC-PUFA enriched enteral nutrition. Additionally, it was shown that LC-PUFA levels have an important function for the intestinal repair process after malnutrition in the early infancy [25]. LC-PUFAs are critical for the brain development and function, but efficiency of LC-PUFA supplementation for the improvement or positive effects on the long-term neurocognitive development of premature or mature infants are still inconsistent [16262728]. Some studies the showed beneficial effects of LC-PUFA supplementation, whereas some studies or meta-analysis showed no effect [26272829]. Inconsistent results may be associated with differences of duration and doses of LC-PUFA used in the studies. No significant difference was found in the duration of breastfeeding among the groups in our study, but we did not analysis the levels of LC-PUFA in mothers of the infants, therefore LC-PUFA levels may be similar in 2 groups.
MRS analysis especially assessing for motor and neurocognitive outcomes in premature infants with hypoxic-ischemic encephalopathy are widely used in recent years. The combination of Cho/Cr and NAA/Cho ratios in the white matter at term-equivalent age were found to be predictive of motor outcome at 1 year in premature infants [30]. Increased levels of thalamic Cho/Cr ratio were also shown to be useful for the early identification hypoxic-ischemic encephalopathy in full term neonates [31]. MRS studies in infants with malnutrition are lacking at this time. In our study, we found that Cho/Cr ratio was higher in all regions in infants with malnutrition, but that only thalamic Cho/Cr ratio showed a significant difference. Contrary to our study, Nassar et al. [32], studied the brain metabolites in infants with protein energy malnutrition (n=16) and healthy controls (n=9), and they found that all metabolites were decreased in infants with protein energy malnutrition and an improvement were obtained after nutritional rehabilitation. Similar to our study, it was shown that Cho/Cr ratio especially in the white matter of the brain, was increased in children older than 2 years with developmental delay, as compared to healthy controls [33].
Finally, we evaluated the parameters associated with neurocognitive function in infants and we found that only serum Ca levels were positively correlated with neurocognitive functions (T points). No correlation was found with the other parameters. The association between maternal vitamin D deficiency and fetal development including bone, lung and brain development have been well defined in previous studies [34]. Maternal vitamin D deficiency were found to be associated with neurocognitive difficulties in 10-year-old offspring. It was shown that the presence of vitamin D has benefits when found in brain receptors in widespread regions of the brain including the hippocampus, prefrontal cortex, cingulate gyrus, basal forebrain, caudate/putamen, thalamus, hypothalamus and cerebellum, and it contributes to the neuroprotection by modulating the production of nerve growth and neuroprotective factors. Decreased levels of vitamin D receptors were shown in the elderly patients with dementia and Alzheimer's disease. There has been no study about the association of serum Ca levels with the neurocognitive development, but it was shown that Ca is essential for synaptic plasticity, a neuronal process that entails gene expression, and which is presumably the cellular counterpart of cognitive brain functions such as learning and memory [3435].
The limitations of our study were as follows: 1) we were not able to study the vitamin D levels, and 2) neurocognitive development in a child, which is also associated with environmental factors such as cultural, genetic and socio-economic factors that we were not able to analyze these parameters in our study.
In conclusion, our study revealed important clues for the pathogenesis of neurocognitive impairment in infants with malnutrition. Changes in MRS after nutritional rehabilitation and long-term consequences of high thalamic Cho/Cr ratio must be prospectively evaluated. Our findings about the LC-PUFA levels need to be supported with large-number of patients.
 XML Download