

 PDF
PDF ePub
ePub Citation
 Print
Print


Introduction
Water is the highest constituent of the human body and is essential for life. Body water transports nutrients and excretes wastes [1]. Water enables a chemical reaction, controls body temperature, and protects the body from impact. Water also acts as a lubricant as a component of saliva, digestive juices, and mucus. Therefore, even during the fasting, water must be consumed [2].
The main source of water is food and liquid. In Korea, one half of the daily water intake is taken as food and the other half as liquid [3]. Jéquier & Constant [4] reported that total daily water loss and water intake were equilibrated to 2550 ml per day. Daily water intake is composed of 1575 ml from liquid (water, beverage, and milk), 675 ml from food, and 300 ml from metabolism.
The demand for clean water has increased due to deterioration of the living environment caused by economic growth [5]. As a result, the production and consumption of bottled natural mineral water (NMW) are increasing. NMW contains various minerals [6]. Mineral contents such as calcium, sodium, potassium, magnesium, and fluoride must be labeled on the bottled NMW products [7].
The higher the water hardness, the more calcium and magnesium salts are contained in water, which can be a source of minerals. The importance of mineral intake through drinking water was reported in the early epidemiological study in which residents drinking hard water containing calcium and magnesium had a lower mortality from hypertension and cardiovascular diseases than those who drank soft water[8]. However, since mineral content of water differs depending on the source of water and the storage method [9], the mineral content in water or mineral intake by drinking water is not evaluated and tends to be disregarded. Among minerals, calcium is the most required, but most Koreans do not meet the daily recommended nutrient intake (RNI) of calcium because food sources for calcium are limited. An assessment of calcium intake through drinking water such as NMW is therefore needed. The aim of this study was to evaluate daily water consumption and its possible contribution to calcium intake through drinking water in Korean adults.
Methods
1. Materials and subjects
We surveyed dietary intake including water consumption among 640 Korean adults with self-selected diet, analyzed the calcium content of 10 NMWs sold in Korea, and assessed the amount of calcium intake from drinking water and its daily contribution to the RNI of calcium. For evaluation of calcium intake from drinking water, the different brands of bottled NMWs sold in Korea were surveyed, and 10 most commonly purchased bottled water products were selected. A total of 640 adults aged 20–69 years participated in the dietary survey to measure water and calcium intakes. The subjects were recruited through city halls, health centers, university home pages, and senior welfare facilities in the following four provinces of Korea: Seoul, Chungcheong, Gyeongsang, and Jeolla. The exclusion criteria were having any disease, being under medication or diet control due to disease, and being pregnant or lactating. All participants provided their written informed consent. The study was approved by the Institutional Review Board of Kyungpook National University (KNU 2014-0053).
2. Analysis of calcium content in NMW
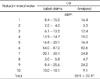
Ten bottled NMWs sold in Korea based on internet survey were purchased at the local markets and their calcium contents were analyzed using ICP-OES (Optima 5300 DV, PerkinElmer, MA, USA). The relative standard deviation gained from three repeated analyses of the same sample was within 3%. Analyzed calcium contents of NMWs were compared to the nutrition label claims and they were in the range of the label claims (Table 1).
3. Dietary assessment
A dietary intake survey was conducted for two days at intervals of 3 days on weekdays using the method of a food record. Dietary sheets were provided to the participants in advance. Subjects were instructed to record the type and intake of all food, beverages, and drinking water consumed for 24 hours on a dietary sheet. Additionally, the dietary supplements and other functional health food intakes were recorded. Moreover, the beverage intake quantities were examined for coffee and tea, and for other beverages, such as the bottled water and the caffeine-free beverages. Then, the trained dietician interviewed participants in-person to revise and supplement dietary intake survey. In order to increase the accuracy of the dietary intake survey, the interviewers used food models, food containers, measuring cups, weighing spoons, and tape measures.
4. Analysis of daily water and calcium intakes
Based on the dietary intake survey sheet, the analysis on energy and nutrient intakes was conducted using CAN-Pro (Computer Aided Nutritional Analysis Program for Professionals, The Korean Nutrition Society, Korea). In this study, total water intake was divided into water intake from food and water intake from drinking water. Water intake from food was analyzed using CAN-Pro based on the dietary intake survey sheet. Milks and beverages were included as food in this study because they contain calcium and are generally regarded as food on a dietary intake survey. In addition, because the database on water content of soup/stew dishes is limited in Korea, water intake from food was calculated based on 0.53 ml/kcal [3], which is the ratio of water content in an ordinary Korean meal. Total water intake was calculated by summing water intake from food and drinking water intake. Total calcium intake was also divided into calcium intake from food and calcium intake from drinking water. Calcium intake from drinking water was calculated based on the drinking water intake and the average calcium content of 10 NMW products sold in Korea.
5. Statistical analysis
Statistical analysis was performed using the SAS program (Ver. 9.4 SAS Institute, Cary, NC, USA). Results were expressed as mean ± standard deviation (SD). Variable differences according to gender and age were tested using unpaired Student's t-test and ANOVA test with post hoc analysis of Duncan's multiple-range test. The P value < 0.05 was considered as statistically significant.
Results
1. Calcium content of NMW and participants'characteristics
Calcium content of 10 bottled NMW products was 2.5–87.0 mg/l on the nutrition label and 20.9 mg/l for analyzed mean value (Table 1). Overall, the analyzed calcium content of NMWs was similar to the nutrition label. The mean height, weight, and body mass index of participants were 171.4 cm, 71.4 kg, and 24.3 kg/m2 for men and 159.1 cm, 56.5 kg, and 22.3 kg/m2 for women, respectively (data not shown).
2. Daily water intake
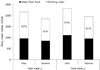
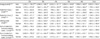
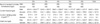
As shown in Table 2, daily energy intake was significantly higher among men than women (2093.9 kcal vs. 1795.5 kcal, respectively, p<0.001). Daily water intakes from food composition database and calculated using the ratio of energy intake were 957.2 ml and 1109.8 ml for men and 848.3 ml and 951.6 ml for women with significant difference by gender (p<0.001). Daily drinking water intake was significantly higher among men than women (1203.9 ml vs. 1004.3 ml, respectively, p<0.001). Daily total water intakes using food composition database and calculated using the ratio of energy intake were, respectively, 2161.1 ml and 2313.6 ml for men and 1852.6 ml and 1955.9 ml for women with significant difference by gender (p<0.001). The contribution percentage of drinking water intake to total water intakes analyzed directly and calculated using energy intake was 55.7% and 52% for men and 54.2% and 51.3% for women, respectively (Fig. 1).
3. Daily calcium intake from food and drinking water
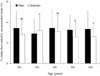
Calcium intake status of participants is shown in Table 3. Daily calcium intakes from food were 564.0 mg for men and 534.2 mg for women without statistical difference. In men, daily calcium intake from food was significantly higher among those in their 60s than those in their 20s or 30s (p<0.05). Daily calcium intakes from drinking water estimated by calcium content of bottled water were 25.2 mg for men and 21.0 mg for women (p<0.001). As shown in Fig. 2, the contribution of daily calcium intakes from drinking water to RNI of calcium was 3.3% for men and 2.9% for women without significant difference. In women, the contribution of calcium intakes from drinking water to RNI of those in their 30s was significantly higher than those in their 50s or 60s (p<0.05).
Discussion
The present study found that daily drinking water intakes of men and women were 1203.9 ml and 1004.3 ml, and calcium intakes from them were 25.2 mg/d and 21.0 mg/d (3.3% and 2.9% of RNI), respectively. Koreans with high consumption of soupy foods, consume about half of their daily water intake as food and half as a liquid. Until now, in dietary intake assessment, intake of nutrients including calcium from drinking water has been neglected. Although Koreans have a high intake of soup and stew, the water intake through these foods is very different, and it makes difficult to assess their intake accurately. In our study, daily water intakes from food analyzed directly and calculated using 0.53 ml/kcal were 957.2 ml and 1109.8 ml for men and 848.3 ml and 951.6 ml for women, respectively. Additionally, drinking water intake was 1203.9 ml/d for men and 1004.3 ml/d for women. In a water balance study, Weinheimer et al. [10] reported that the daily water intake of 26 young adult women was 3128 ml. Among them, water from drinking water was 1575 ml/d, and water from food and beverages was 1241 ml/d. The proportion of drinking water intake to total water intake was about 50%, similar to that in present study. These results show that assessment of mineral intake such as calcium through drinking water should not be overlooked.
Our study showed the importance of calcium intake through drinking water. The Korea National Health and Nutrition Examination Survey (KNHANES) reported that the calcium intake among Koreans is insufficient compared to RNI in all ages except 1–2 years [11]. Similar results are continuously being reported, confirming that calcium is one of the most inadequate nutrients for Koreans. In this study, the dietary calcium intake of participants was 546 mg/d for males and 534.2 mg/d for females, indicating that the intake was deficient compared to RNI.
Environmental pollution caused by economic growth might negatively impact tap water safety. Kim [12] reported that Koreans are reluctant to drink water directly from the tap for health reasons as well as aesthetic reasons. In Canada, 71% of respondents replied that they drank bottled water because of the taste, and 25% cited health and safety reasons [13]. In France, 47% of respondents reported using bottled water because of its taste [14]. A study showed that consumption patterns of drinking water are changing from tap water to bottled water because of its sensory characteristics, hygiene, safety, and convenience [15]. Natural water, which contains artificial contaminants and natural ingredients (e.g., minerals, gases, microorganisms, and their metabolites), is supplied to bottled water through a purification process [5]. Among the minerals contained in natural water, calcium and magnesium not only provide important nutrients, but also influence the water taste and affect the water hardness. The hardness of water is expressed as the amount of CaCO3 dissolved in water, and classified as either soft water or hard water according to hardness [16]. In the present study, the average calcium content in 10 bottled water products sold in Korea was 20.9 mg/L with a range of 4.7–82.6 mg/L. Calcium contents in bottled water were 8–325 mg/L in Italy [5], 22–141 mg/L in Spain [17], and 1.6–522 mg/L in France [15], indicating wide variation by products.
In the present study, calcium intake through drinking water was 25.2 mg/d for men and 21.0 mg/d for women, assuming that all drinking water was consumed as bottled NMW. Although this is relatively low amount (about 3% of calcium's RNI), calcium intake through drinking water can be important source, because calcium intake from food is low in typical Korean meal pattern. Future studies should evaluate the intake of various minerals including calcium through long-term drinking water and to clarify its association with health.
This study has limitations. Although the type of drinking water consumed by individuals may be different, the current study did not measure these differences. Also, we did not analyze water intake in foods such as soup, stew, and porridge of the subjects, which could have led to underestimation of water intake. In addition, when calculating the water intake by applying the ratio to the calorie intake, the difference in the dietary pattern by age group was not reflected. Thus, the calcium intake through drinking water and food may have been different from the actual intake. Despite these limitations, this is a meaningful study that attempted to evaluate the possible intake of calcium through water consumption in Koreans.
Conclusions
In conclusion, results from this study show that one half of the daily water intake is consumed as drinking water and the other half is as food including milk and beverages. Calcium intake through drinking water was low (about 3% of RNI) that nutritional significance may be neglected. However, in order to evaluate calcium intake through drinking water and to clarify its association with health status, studies with a long period and national level are needed.
 XML Download