

 PDF
PDF ePub
ePub Citation
 Print
Print


INTRODUCTION
Thyroid hormones are important for regulating biological processes, including growth, metabolism, and neural development [1234]. Thyroxine (T4) is secreted by the thyroid gland and acts as a prohormone that is transported in the bloodstream to peripheral tissues, where it is converted into other forms, such as 3,3′,5-triiodo-L-thyronine (T3). In serum, most T4 is bound to proteins, and only about 0.02% circulates in the free form (FT4) [4]. Although FT4 measurements are considered more important than total (T)T4 measurements as FT4 is the active form, TT4 measurements are useful for detecting subclinical hypothyroidism or cases of severe hyperthyroidism [4]. Serum TT4 may be more diagnostically relevant than FT4 for evaluating diseased patients and is associated with disease severity [4]. The total rather than the free hormone fraction is acknowledged as the ideal diagnostic measure [5] because of the significant bias of results among FT4 detection methods (−42%) [6]. Moreover, for economical and traditional reasons, TT4 is still widely used in clinical practice, and even the most recently developed automated test systems include TT4.
Since 1970s, various TT4 detection methods, including radioimmunoassay, ELISA, and the most commonly used chemiluminescent immunoassay, have been developed by major manufacturers, such as Abbott, Beckman-Coulter, Roche, and Siemens. Some large Chinese in-vitro diagnostics manufacturers, such as Autobio and Mindray, have also developed TT4 detection systems. However, all these methods are antigen-antibody-based, and interference from non-specific reaction may lead to false results [7]. Moreover, little attention was paid to harmonization or standardization of TT4 detection systems previously [68910]. Only Thienpont et al. [8] compared 11 immunoassays for TT4 in 2010. However, there have been major developments on the standardization of TT4 tests since then. The Joint Committee for Traceability in Laboratory Medicine has established reference materials and methods based on isotope-diluted liquid chromatography-tandem mass spectrometry (ID-LC-MS/MS) [1112]. However, it is unknown whether these have improved the performance of TT4 immunoassays from different manufacturers. One study reported a weak correlation between log thyroid-stimulating hormone (TSH) and TT4 (R=0.25) [10]; however, FT4 measured by ID-LC-MS/MS showed a stronger correlation with log TSH than that measured by immunoassays [1314]. Hence, we compared the performance of six automated immunoassays with that of ID-LC-MS/MS as a reference method and assessed the correlation of TT4 with log TSH measured by ID-LC-MS/MS and the immunoassays.
METHODS
Subjects and sample collection
This was a cross-sectional study. Between October 2015 and January 2016, serum samples were collected from 156 inpatients, including 31 males and 125 females (median age: 40 years, range: 9–91 years), who requested TT4 measurement, at Peking Union Medical College Hospital, Beijing, China. The samples were from cases of hyperthyroidism (N=40), postoperative thyroid cancer (N=18), hypothyroidism (N=15), thyroid nodule (N=14), pregnant women (N=14), and others (N=55). The study was approved by the Ethics Committee of Peking Union Medical College Hospital (ZS-984). All patients involved were made aware of the intended use of their samples and provided written consent. Experiments were carried out in accordance with the Declaration of Helsinki (2013 revision).
Serum was collected in VACUETTE tubes with separator gel and clot activator (Greiner Bio-One, Kremsmunster, Austria). Each sample was divided into seven aliquots, which were stored at −80℃ until analysis within a month. A freshly thawed aliquot was used for each analytical run. ADVIA Centaur XP (Siemens, Munich, Germany) was employed to select samples that had TT4 concentrations evenly distributed between 1.3 and 387 nmol/L, and without hemolysis, icterus, or lipemia.
Assays
TT4 was measured using six automated chemiluminescent immunoassays—Architect 4000 (Abbott Diagnostics, Lake Forest, IL, USA), DXI800 (Beckman-Coulter, Brea, CA, USA), E601 (Roche Diagnostics, Basel, Switzerland), ADVIA Centaur XP (Siemens, Munich, Germany), Autolumo A2000 (Autobio, Zhengzhou, China), and CL-1000i (Mindray, Shenzhen, China)—as well as ID-LC-MS/MS. All immunoassays were carried out in the clinical laboratory of Peking Union Medical College Hospital in a blinded manner, with different experienced operators for each. ID-LC-MS/MS was carried out at the National Center for Clinical Laboratory in China, on an API 4000 triple quadrupole mass spectrometer (AB Sciex, Framingham, MA, USA) coupled with an Agilent 1200 LC system (Agilent Technologies, Santa Clara, CA, USA) and equipped with Analyst 1.4.2 software (AB Sciex) [13].
TT4 measurement
Serum samples or calibrators were sampled by weight, and 13C6-T4 internal standards were added volumetrically using automated diluters, followed by equilibration. Then, 1 mL of methanol (0.1% formic acid) was added to precipitate the protein, and the mixture was centrifuged at 3,000×g for 15 minutes. The upper layer was transferred to the cation exchange column. Cation exchange solid-phase extraction was performed using a mixed-mode cation exchange column (Oasis MCX 1 mL, 30 mg; Waters, Milford, MA, USA). The solid-phase extraction cartridge was conditioned by washing with methanol and water. Then, it was washed with 1 mL of a 2% aqueous solution of formic acid and 1 mL of methanol. Next, T4 and the internal standard were eluted from the cartridge with 1 mL of 5% ammonium hydroxide. The eluates were evaporated to dryness under nitrogen, and the residues were reconstituted in 400 µL of mobile phase, 20 µL of which was loaded into the ID-LC-MS/MS system. HPLC separation was carried out with a Zorbax Eclipse XDB C18 column (5 µm, 2.1×150 mm; Waters) and a mobile phase consisting of 0.05% formic acid in water-methanol (30:70) at a flow rate of 0.3 mL/min. MS detection was carried out using the positive electrospray ionization mode with multiple reaction monitoring. Quantitative ion pair transitions were m/z 777.7→731.6 and m/z 783.7→737.6 for T4 and 13C6-T4, respectively. Qualitative ion pair transitions at m/z 783.7→639.8 and m/z 783.7→639.8 for T4 and 13C6-T4, respectively, were monitored for confirmation. Each sample was injected three times, and average peak area ratios were calculated to quantify T4 concentration in the unknown sample by bracketing calibrations.
Certified reference materials for TT4 (CRM21201 and CRM20202) were provided by Professor Lothar Siekmann of the German Society of Clinical Chemistry and Laboratory Medicine (DGKL). The CRMs were lyophilized human serum samples and were dissolved in 3 mL deionized water. The CRMs were measured in three runs, and with triplicate measurements in each run.
Immunoassays were carried out with the following reagent lots for TT4: 55935UI00 (Abbott), 527911 (Beckman-Coulter), 188364 (Roche), 04003169 (Siemens), 20151121 (Autobio), and 150701 (Mindray). The calibrator lots were: 7K66-01 (Abbott), 2015101503 (Autobio), 33805 (Beckman-Coulter), 20150901 (Mindray), 18150202 (Roche), and 53803A86 (Siemens). Detailed information on the immunoassays is presented in Supplemental Data Table S1. TSH concentration was measured by the Centaur assay (Siemens) using the TSH reagent produced by Siemens.
In addition, three serum pools from Bio-Rad (Hercules, CA, USA; lot 40300, levels 40301, 40302, and 40303) that were used as quality control materials were prepared for assessing immunoassay imprecision prior to comparisons. Following the CLSI EP15-A [15], on five consecutive days, one freshly thawed aliquot of each pool was measured four times by all immunoassays. We ensured that measurement performance met the quality control standard before proceeding with measurements.
Performance criteria
Performance criteria were set on the basis of biological variation, which is often used to evaluate whether an assay is analytically acceptable [16]. With this approach, using the within- and between-subject biological variation (CVw=within-subject biological variation, CVg=between-subject biological variation) for TT4 from Westgard [17] (4.9 and 10.9, respectively), the minimum requirements for TT4 assays were as follows: a mean bias of ≤4.5% [0.375 (CVw2+CVg2)1/2] and imprecision of ≤3.7% (0.75CVw) [18].
Statistical analysis
The TT4 results analyzed by different methods were summarized as mean±SD, and CV of the methods was calculated using a one-way ANOVA. In addition, TT4 results from different methods were analyzed using Passing-Bablok regression and Bland-Altman plots. Passing-Bablok regression, which was used to evaluate method agreement, calculates a regression equation (y=ax+b), including 95% confidence intervals (CIs), for the proportional (a, slope) and constant (b, intercept) errors [19]. If the 95% CI for intercept includes the value zero, there is no constant difference between two methods; if the 95% CI for slope includes the value one, there is no proportional difference between two methods [19]. The bias between two methods was evaluated using Bland-Altman plots, which quantify agreement between two quantitative measurements by constructing limits of agreement [20]. Linearity was tested using the cumulative sum (Cusum) linearity test, which is used to evaluate whether residuals are randomly scattered around the regression line without a significant trend. The correlation between TT4 and TSH was evaluated using linear regression. P<0.05 indicated a significant deviation from linearity. Statistical analyses were carried out using MedCalc v. 13.3.3 (MedCalc Software, Ostend, Belgium) and Microsoft Excel 2007 (Microsoft Corporation, Redmond, WA, USA).
RESULTS
Performance of ID-LC-MS/MS
We evaluated the imprecision of ID-LC-MS/MS by measuring left-over serum samples in three analytical runs, with triplicate measurements in each run. The samples were from seven patients with T4 concentrations ranging from 20.87 to 245.55 nmol/L. For each concentration, the within-run, between-run, and total CVs were 0.60% (0.35–0.89%), 0.54% (0.27–1.23%), and 0.84% (0.57–1.37%), respectively.
For CRM21201 and CRM20202, the mean TT4 concentration measured by ID-LC-MS/MS was 120.74 nmol/L and 88.70 nmol/L, and the bias against target values (120.90 nmol/L and 88.05 nmol/L) was −0.13% and 0.73%, respectively.
This method was used to participate in the 2011, 2012, 2014, and 2016 International Federation of Clinical Chemistry and Laboratory Medicine (IFCC) reference measurement comparison (Ring trials or Rela) schemes. Our laboratory code was 18. In the four-time comparison, the average difference between the results of our method, and the results from the DGKL reference measurement laboratory (code 1) was <1%.
Three vials of 57.55 nmol/L frozen serum samples were combined, and twelve 0.2 mL aliquots were taken for testing the accuracy of the method. Unlabeled TT4 was added to nine of the 12 aliquots: three each with 29, 58, and 116 nmol/L TT4. No TT4 was added to the other three aliquots. The aliquots were then processed and tested by ID-LC-MS/MS. The amounts of TT4 added and recovered were in very good agreement for all three concentrations, with mean recoveries of 100.7% (100.1–101.0%), 99.6% (99.2–100.5%), and 99.9% (99.5–100.7%), respectively.
Performance of the six immunoassays
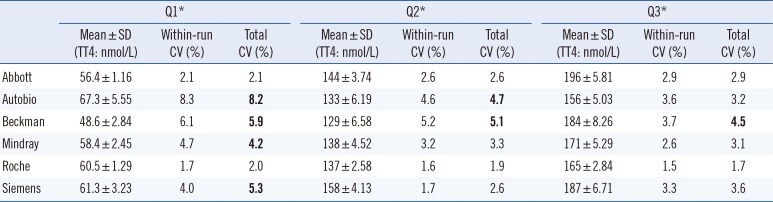
Imprecision evaluation showed that all methods had within-run CV and total CV for TT4<10% (Table 1). However, only Abbott and Roche showed acceptable CV (≤3.7%) in all samples, Autobio and Mindray produced relatively high CVs at the lower concentrations, and Beckman-Coulter assay results exceeded the criteria for all three concentrations (Table 1).
Comparison of TT4 detection results
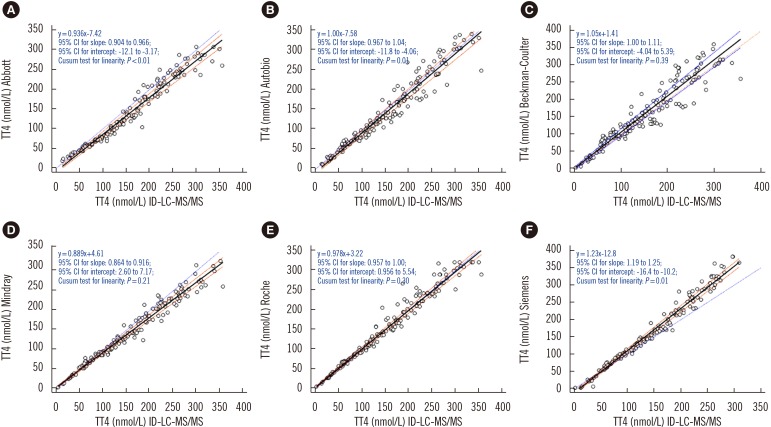
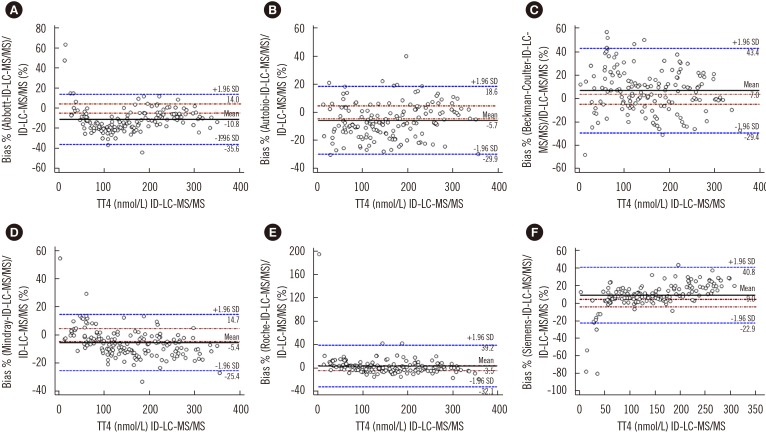
To compare the results of immunoassays and ID-LC-MS/MS, we used low, medium, and high TT4 concentrations that covered the analytical measurable range in each immunoassay. Passing-Bablok regression (Fig. 1) revealed that the results obtained by each immunoassay strongly correlated with those obtained by ID-LC-MS/MS, with correlation coefficients (R)>0.945. No proportional error (slope) was observed for Autobio, Beckman-Coulter, and Roche, and the 95% CIs for slope comprised. However, constant error was observed for most immunoassays, except Beckman-Coulter, with a 95% CI for intercept comprising zero. The highest constant bias was noted for Siemens, at −12.8 nmol/L (Fig. 1). Bland-Altman plots showed that the mean bias relative to ID-LC-MS/MS was the lowest for Roche (3.5%) and the highest for Abbott (−10.8%) (Fig. 2).
Correlation between TT4 and TSH results
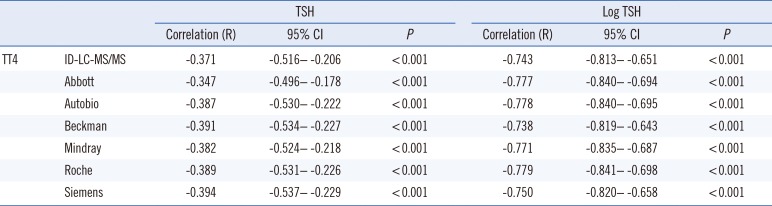
R was −0.371 (−0.516 to −0.206, P<0.001) between TT4 (ID-LC-MS/MS) and TSH (with 121 samples having a TSH concentration higher than the lower limit of 0.008 µIU/mL). The correlations between log TSH and TT4 measured by immunoassays are presented in Table 2. The correlation between log TSH and TT4 results from ID-LC-MS/MS was not stronger than that between log TSH and TT4 results from immunoassays.
DISCUSSION
The relatively small biological variation in TT4 concentrations necessitates a high standard for analytical methods. Burtis et al. [21] stated that when TT4 is used to diagnose thyroid disease, the suggested criteria for maximum bias and imprecision are 2.9% and 5.7%, respectively, and when the TT4 assay is used to monitor changes in an individual over time, bias and imprecision criteria should be 1.3% and 2.6%, respectively. We used performance criteria (a mean bias of ≤4.5% and imprecision of ≤3.7%) based on biological variation, which is used to evaluate whether an assay is analytically acceptable [16]. Applying these criteria, we found that though the immunoassays showed a good overall performance with imprecision <10%, most still did not meet the minimum clinical requirement of CV ≤3.7%.
Method agreement evaluation revealed that the results obtained by each method strongly correlated with those obtained by ID-LC-MS/MS; however, the 95% CIs for slope for Abbott, Mindray, and Siemens did not include one, indicating disproportional differences between these immunoassays and ID-LC-MS/MS [19]. Moreover, a constant error was observed for all immunoassays (95% CI for intercept did not include the value zero) except Beckman-Coulter, and the highest constant bias was found for Siemens.
With the criterion of mean bias of ≤4.5%, only the Roche assay showed acceptable mean bias relative to ID-LC-MS/MS. However, if the 10% mean bias criterion, as outlined in the report of the IFCC working group for standardization of thyroid function tests [8], is considered, only the Abbott assay showed a slightly higher deviation, with an average of 10.8%. The ratio of manufacturers who meet the 10% bias was higher than that in the IFCC report. However, when the proficiency testing criterion for TT4 of ±20% or 12.9 nmol/L from Clinical Laboratory Improvement Amendments [22] is considered, Autobio, Abbott, Beckman-Coulter, Mindray, Roche, and Siemens exceeded the criterion by 11.8%, 18.3%, 28.1%, 3.8%, 3.9%, and 17.1%, respectively.
Nonetheless, all methods showed a strong correlation with ID-LC-MS/MS for TT4 detection. Thus, it is possible to achieve standardization between these methods and ID-LC-MS/MS, which would allow obtaining consistent results from different immunoassays. However, differences exist among all TT4 immunoassays, and efforts to standardize TT4 detection are still required.
Importantly, log TSH and FT4 showed a weak correlation when thyroid disease patients were included in the analysis, and FT4 measured by LC-MS/MS showed a stronger correlation with log TSH than did FT4 measured by immunoassays [1314]. One study reported a weak correlation between log TSH and TT4 [10]. We obtained R>0.7 with all immunoassays; however, this did not equate to a stronger correlation with ID-LC-MS/MS.
One limitation of this study is that we did not evaluate the performance of immunoassays for FT4 detection, due to the lack of a reference method and reference materials in China. Another potential limitation was that the presence of plasma components such as binding proteins and drugs that might affect immunoassay results was not investigated, which must be addressed in future studies [2324]. Further, we did not evaluate whether blood collection devices or storage at −80℃ affected immunohistochemical TT4 detection. A previous study using VACUETTE tubes with separator gel and clot activator from Greiner Bio-One showed that the tubes did not affect TT4 results [25]; however, the study evaluated the effect of the tubes on TT4 detection only for Immulite 1000 (Siemens). Burtis et al. [21] reported that gel barrier collection devices do not have an apparent adverse effect on TT4 detection, and TT4 is stable up to 30 days when frozen.
In conclusion, though all the immunoassays tested in this study correlated strongly with ID-LC-MS/MS, most did not meet the minimum clinical requirements derived from biological variation. Thus, efforts to reduce imprecision and standardize TT4 detection remain necessary. Laboratories and manufacturers must be aware of the assay limitations and improve the performance of these assays.
 XML Download