

 PDF
PDF ePub
ePub Citation
 Print
Print


INTRODUCTION
Prostate cancer screening and early diagnosis is based on digital rectal examination and prostate specific antigen (PSA) serological testing [1]. If necessary, transrectal ultrasound-guided prostate biopsy is used; however, this is an invasive method that requires local anesthesia and antibiotic cover or multiparametric magnetic resonance imaging [2]. In either case, proper interpretation of the results, extensive experience, and close collaboration with urologists is mandatory, which contributes to the overall difficulty of both diagnostic approaches [3].
In 1986, the U.S. Food and Drug Administration (FDA) approved the Hybritech Tandem PSA assay (Hybritech Inc., San Diego, CA, USA) to measure serum PSA concentrations [4]. Initially, the assay was introduced for monitoring the course of disease; however, eight years later, it was accepted for screening potential prostate cancer development with a cut-off value of 4 ng/mL of total PSA (tPSA) in serum [5]. However, the reference cut-off value for prostate cancer screening remains the subject of continuous debate, and several attempts have been made to find a compromise between the specificity and sensitivity of the PSA assay, including setting age- and race-specific reference ranges [6].
PSA is a serine protease belonging to the kallikrein family. It is synthesized as preproPSA that is sequentially cleaved to form the proPSA zymogene and then the mature enzyme [78]. Additionally, PSA can be hydrolyzed at alternative positions, leading to the formation of catalytically inactive nicked forms [7910]. The diagnostic approach is further complicated by the fact that PSA is present in the serum not only as free PSA (fPSA), but also in complexes with serpins: α-1-antichymotrypsin (PSA-ACT) or α-2-macroglobulin (PSA-α2M; a form that escapes immunological detection) [910]. Nicked PSA does not form complexes with ACT and α2M and therefore participates in the fPSA fraction [7]. Assays used to measure tPSA need to detect not only the fPSA sub-fractions but also the PSA-ACT complexes, which constitute 70–90% of tPSA in human serum [11]. However, the concentration and ratio of various PSA sub-fractions provide valuable information on health status and are considered as a supplement to tPSA measurements [12131415]. Thus, although not ideal, PSA remains one of the most tested, validated, and commonly used prostate cancer biomarkers.
We propose the application of a recently developed PSA-specific chicken immunoglobulin Y (IgY) antibody as an alternative to currently used mammalian IgG antibodies [16]. The interaction between the Fc region of IgG with rheumatoid factor (RF), the presence of human anti-mouse antibodies (HAMA) in serum, as well as the activation of the complement system might result in the interferences observed in immunoassays based on mammalian antibodies [17]. Since IgY antibodies do not participate in the above described interactions, their application leads to a reduction in these types of cross-reactions in serological assays [181920].
The isolation method of IgY antibody from egg yolks is simple, efficient, and non-invasive. There are also significant economic and ethical aspects involved in the utilization of antigen-specific IgY antibodies as an alternative to IgG that need to be considered [21]. We describe the application of an anti-PSA IgY antibody in a sandwich ELISA and evaluate its diagnostic potential compared with the assay on Cobas 6000 analyzer (Roche Diagnostics, Warszawa, Poland) and PSA total ELISA (IBL International, Hamburg, Germany) used to measure serum PSA concentration.
METHODS
IgY antibodies
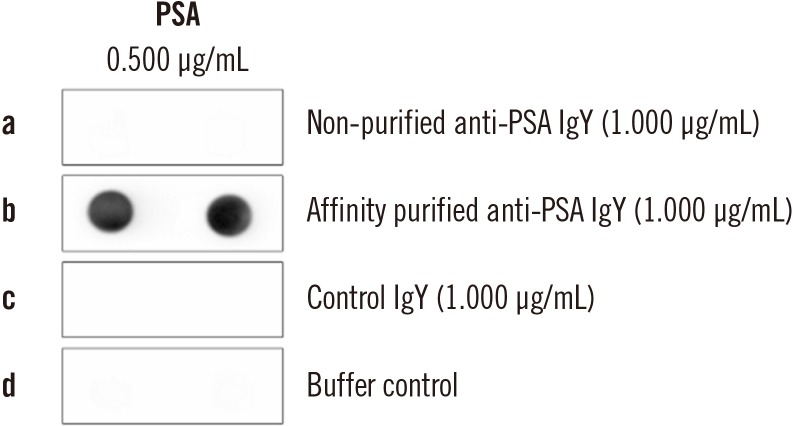
PSA-specific IgY antibodies were obtained by immunizing 22-week-old white leghorn laying hens with fPSA (Fitzgerald Industries International, Acton, MA, USA) as the antigen [1622]. Egg yolk antibody isolates were subjected to affinity chromatography purification with PSA conjugated to CNBr-sepharose (Thermo Fisher Scientific, Gdańsk, Poland), following the manufacturer's protocol. The next steps were performed as described previously [23]. All subsequent IgY-based experiments were performed with affinity purified anti-PSA IgY with confirmed antigen-reactivity to ensure reproducible results in all IgY-based experiments.
Equimolar detection of fPSA and PSA-ACT
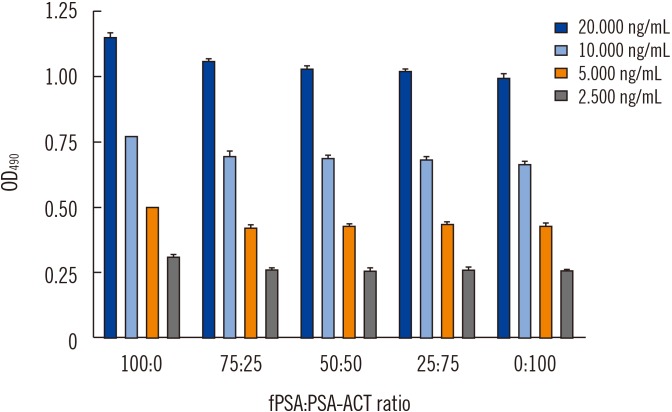
Equimolar detection of the commercially obtained fPSA and the PSA-ACT complex by specific anti-PSA IgY was determined by ELISA. For this purpose, a microtiter plate (Nunc MaxiSorp, Thermo Fisher Scientific) was coated with a mouse monoclonal anti-PSA IgG antibody (clone M1709PSA1; Fitzgerald Industries International) in carbonate buffer (pH 9.600) at 3.000 µg/mL (100.000 µL/well). After four hrs of incubation at 37℃, the plate was washed and blocked overnight with 5.000% skim milk in phosphate buffered saline (PBS) containing 0.050% of Tween-20 (PBST) at 4℃. After washing with PBST, the plate was incubated (1 hour, 37℃) with fPSA and the PSA-ACT complex (Fitzgerald Industries International) at tPSA protein concentrations of 2.500, 5.000, 10.000, and 20.000 ng/mL and with different fPSA:PSA-ACT ratios: 100:0, 75:25, 50:50, 25:75, and 0:100 for each tPSA protein concentration (100.000 µL/well in PBS supplemented with 1.000% bovine serum albumin [BSA]). Next, the plate was washed, and 1.000 µg/mL of the anti-PSA IgY antibody in 0.500% skim milk in PBST was applied (100.000 µL/well, 1 hour, 37℃). After washing, an anti-IgY IgG-horseradish peroxidase (HRP) conjugate (1:5,000, in 0.500% skim milk in PBST; Pierce, Gdańsk, Poland) was used for detection (100.000 µL/well, 1 hour, 37℃). Subsequently, the plate was washed, and the peroxidase substrate solution (o-phenylenediamine [OPD]; Pierce) in citrate buffer (pH 5.000) supplemented with 0.015% H2O2 was added. The reaction was stopped with 1 M H2SO4, and the absorbance at 490 nm was measured with a microplate reader (Multiscan FC; Thermo Fisher Scientific). The results are expressed as optical density at 490 nm (OD490)±SD. All measurements were performed in duplicate.
IgY-based ELISA
Sandwich ELISA was performed to measure tPSA concentration in 255 serum samples using 16 microtiter plates. A microtiter plate (MaxiSorp) was coated with a mouse monoclonal anti-PSA IgG antibody (2.500 µg/mL, 100.000 µL/well; clone M1709PSA1, Fitzgerald Industries International) in carbonate buffer (4 hours, 37℃). Subsequently, the plate was washed and blocked with 5.000% skim milk in PBST (overnight, 4℃). Standard curves, as well as the blank samples, were prepared based on commercially available calibrators (lyophilized serum containing 64.900 ng/mL and serum without PSA, Total PSA G2 CS Elecsys V2.1, Roche Diagnostics). The samples for the standard curve were used in a concentration range of 0.031–5.060 ng/mL. Serum samples, as well as the calibrator, were diluted in PBS supplemented with 0.100% BSA. Serum samples and calibrators were incubated in the plate for one hour at 37℃. The plate was washed with PBST and incubated with affinity purified anti-PSA IgY at a concentration of 2.500 µg/mL in 0.500% skim milk (1 hour, 37℃). Mouse monoclonal anti-PSA IgG and primary polyclonal anti-PSA IgY antibody coating concentrations were optimized in a separate ELISA assay (Supplemental Data Fig. S1). Next, the anti-IgY IgG-HRP conjugate was added (1:5,000, 100.000 µL/well; Fitzgerald Industries International) and incubated for one hour at 37℃. The plate was washed, and the signal was developed as described above. The reaction was stopped after 10 minutes with 1 M H2SO4, and the absorbance was measured with a microplate reader (490 nm).
Sample collection and storage
Two hundred and fifty five randomly selected serum samples were obtained from patients 55–70 years old with prostate cancer from the Greater Poland Cancer Center, Poznań, Poland. The study was approved by the local ethics committee (Bioethical Commission at the Medical University of Poznań, Poland; UMP No10/2012). All patients provided informed consent for blood collection and data processing. The blood samples were collected, stored at room temperature (21–22℃) for 15–30 minutes, and centrifuged at 1,800×g in a serum separator tube. The serum samples were stored at −20℃ for three months.
Commercial assays
Serum tPSA was analyzed using the Cobas assay on the day of blood collection, according to the manufacturer's protocol. This assay is based on the principle of sandwich electrochemiluminescent assay with a biotinylated mouse monoclonal PSA-specific antibody and a mouse monoclonal PSA-specific antibody labeled with ruthenium complex, which forms a sandwich complex with PSA. The method was standardized against Reference Standard/WHO 96/670. The obtained results were used as a reference. Of the 255 examined samples, 142 samples showed a tPSA concentration ranging from 0.100–50.000 ng/mL and were used for statistical analysis.
PSA total ELISA is based on a sandwich enzyme-linked assay principle that employs anti-PSA antibodies specific for different epitopes. The secondary antibody is conjugated to HRP. Experiments were performed according to the manufacturer's protocol.
Data analysis
All data were analyzed using GraphPad Prism version 5.0 (GraphPad Software Inc., La Jolla, CA, USA) or MedCalc 16.4 (MedCalc Software, Ostend, Belgium). The results of equimolar detection of fPSA and PSA-ACT and IBL tPSA measurement are presented as the mean±SD of experiments performed in duplicate, whereas those of the IgY-based ELISA are presented as the mean±SD of two independent experiments performed in duplicate. Our ELISA's analytical performance was determined on the basis of the definitions presented by Armbruster and Pry [24]; we calculated the limit of background (LoB), limit of detection (LoD), and limit of quantification (LoQ). Pearson correlation coefficient (r) together with P values and 95% confidence intervals (CIs) for r were determined to measure the precision of the results [25]. The combined measure of precision and accuracy was used to evaluate the concordance correlation coefficient. The measure of precision is fixed as an r, whereas accuracy is expressed as a bias correction factor, which measures how far from the 45° line through the origin passes the line of the best-fit [26]. As the Pearson correlation coefficient does not enable the determination of whether there is a fixed or proportional difference between compared methods, we applied Passing-Bablok [27] and Bland-Altman [28] methods of comparison. To evaluate how well linear model fits to the obtained data, the CUSUM test for linearity was used [27]. As a complement to the Bland-Altman difference plot, the folded empirical cumulative distribution plot (mountain plot) was used to indicate the distribution of differences [29].
To evaluate the diagnostic potential of our ELISA, we compared serum tPSA concentrations measured by it with those from the Cobas and PSA total ELISA assays.
RESULTS
For each analyzed tPSA concentration, the affinity purified (Fig. 1) anti-PSA IgY antibody displayed the ability to bind both free and complexed PSA at nearly the same molar ratio (Fig. 2; Supplemental Data Fig. S2).
The standard curve prepared for the developed IgY-based ELISA was based on the commercial Total PSA calibrator (IBL International) to ensure the most accurate measurement conditions. LoB, LoD, and LoQ, were 0.061, 0.083, and 0.100 ng/mL, respectively (also see Supplemental Data Fig. S3 and S4). The linearity of the standard curve ranged from 0.100 to 3.375 ng/mL (R2=0.990, R2: goodness-of-fit measure, average value for 16 separate microplates).
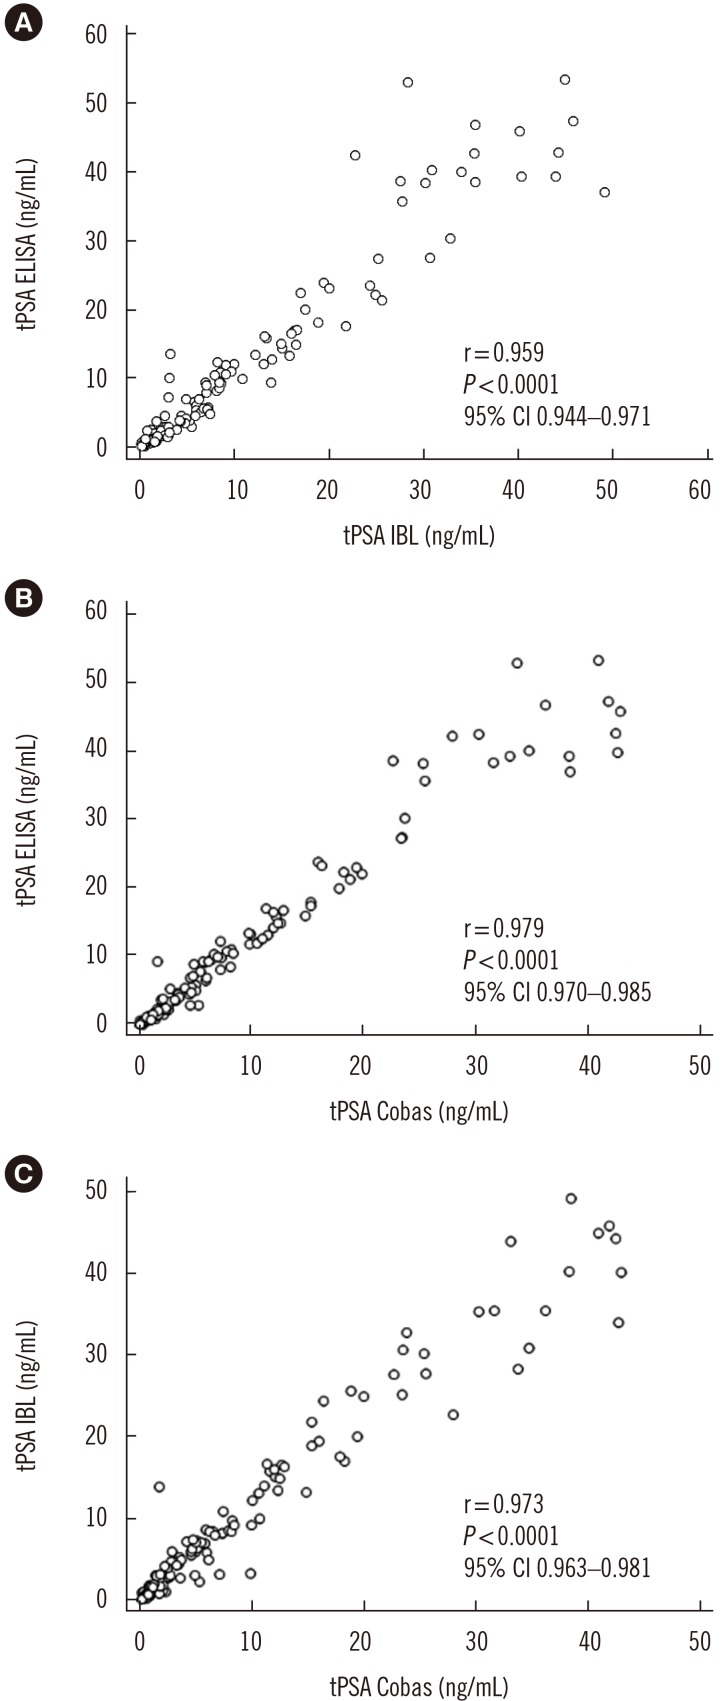
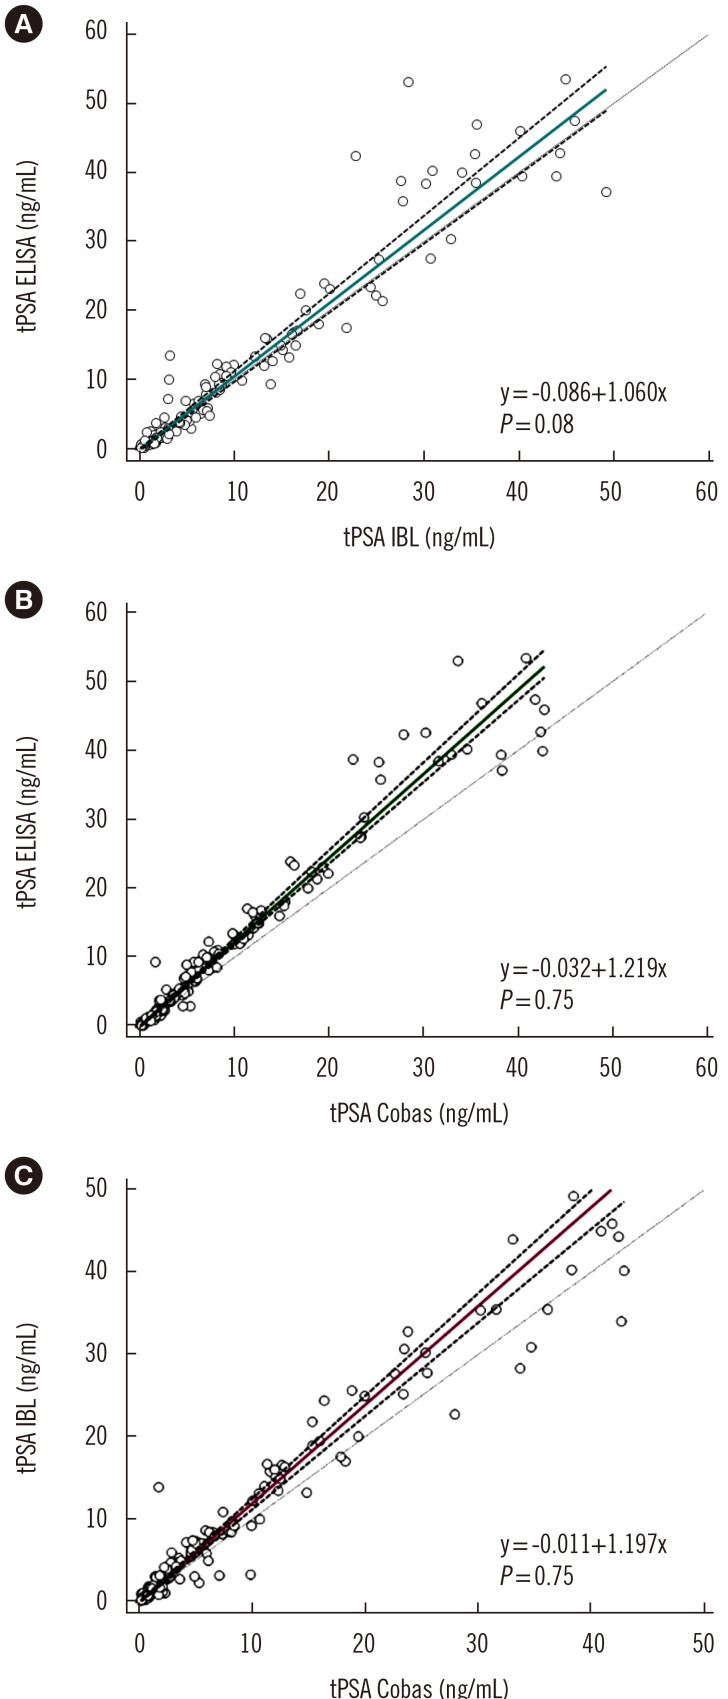
As shown in Fig. 3, the concordance correlation coefficient was 0.950 (95% CI, 0.933–0.963) with a bias correction factor of 0.991 for the comparison between IgY-based ELISA and the IBL assay results and 0.947 (95% CI, 0.932–0.959; bias correction factor=0.968) and 0.965 (95% CI, 0.953–0.975; bias correction factor=0.992) for both IgY-based ELISA and IBL asCsay results versus the values obtained in the Cobas assay. The Passing-Bablok analysis results obtained for all three assays revealed correlation with no significant deviation from linearity (Fig. 4). A similar comparison in which tPSA concentration was determined using a four-parameter logistic regression model (4PL) instead of linear regression is provided in Supplemental Data Fig. S5.
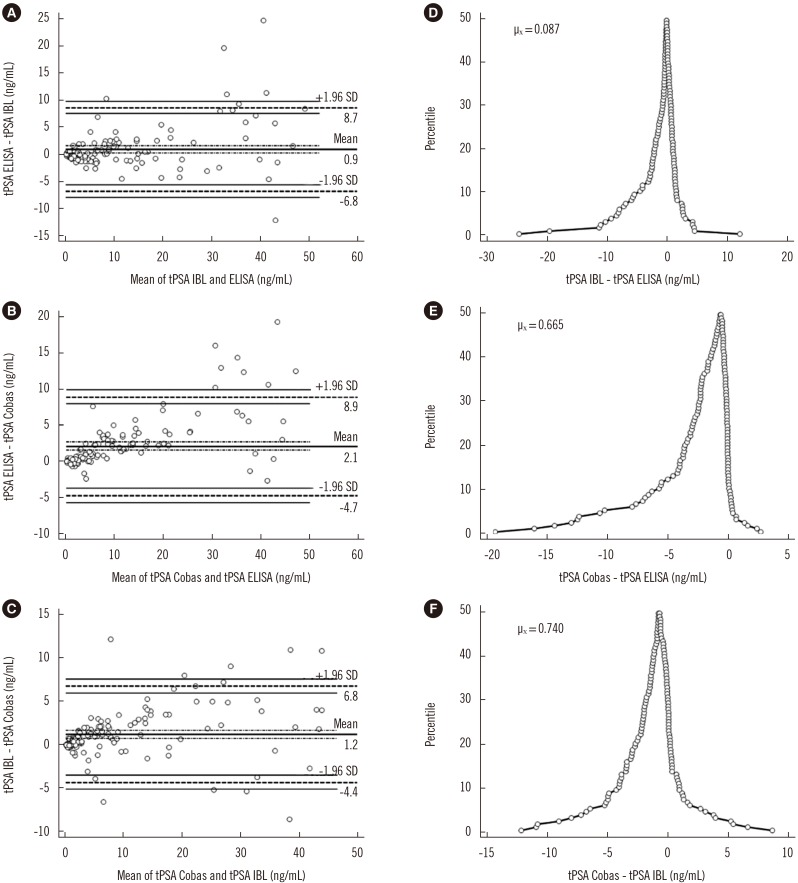
Fig. 5A shows the agreement between IgY-based and IBL ELISAs. The differences between measurements for IgY-based ELISA and the Cobas assay (Fig. 5B) as well as for IBL ELISA and the Cobas assay (Fig. 5C) did not meet the 95% limit of agreement. The folded empirical cumulative distribution plot provides information on the distribution of the differences between the analyzed assays (Fig. 5D–F). Both the ELISA-based methods overestimated the PSA concentration compared with the Cobas assay.
DISCUSSION
Determining the concentration of tPSA often carries the risk of obtaining different results due to inter-assay variability, which in turn can lead to the misinterpretation of results and an incorrect diagnosis. It has been postulated that due to possible differences, the tPSA determination should be consistent during the whole patient history of diagnosis and treatment [30]. Thus, several comparative studies regarding different tPSA assays have been published in which the results of Passing-Bablok and Bland-Altman analyses have been taken into consideration. The correlation between various methods tested varies depending on the analyzed range of concentrations, type of method (manual vs automated), or calibrators used [313233]. Importantly, although the recalibration of assays for tPSA determination according to the WHO 96/670 standard has significantly improved the compliance between the obtained results, discordances between tPSA concentration values among different assays are still observed [34]. This highlights the importance of consistently using a particular tPSA assay. We endeavored to ensure the optimal comparison conditions including the selection of a commercial calibrator and by comparing our IgY-based ELISA with certified tests for IVD.
Avian IgY represents an interesting alternative to mammalian IgG antibodies and can often be applied in immunochemical assays for diseases [35]. Thus, we analyzed the diagnostic potential of a specific anti-PSA IgY antibody.
The sandwich ELISA used for the study was based on monoclonal anti-PSA IgG as the capture antibody and affinity purified polyclonal anti-PSA IgY as the detecting antibody. In addition to the IgY characterization previously described [16], we established the ability of the developed PSA-specific IgY for equimolar detection of fPSA:PSA-ACT. This feature is key to accurate determination of serum PSA concentration, as the PSA-ACT complex represents 70–90% of tPSA in human blood [91011].
The obtained data show a strong correlation for the IgY-based ELISA and commercially available tPSA ELISA certified for IVD (IBL). It is worth emphasizing that besides different antibody sources, both assays rely on independent calibrators for standard curve preparation. The statistical and Passing-Bablok regression analyses indicated a good agreement between the IgY-based and commercial IBL ELISA. However, neither of the ELISAs met the 95% limit of agreement in the Bland-Altman correlation analysis when compared with the Cobas assay. Most discrepancies between ELISAs (IgY-based and IBL) and the Cobas assay were observed for high serum tPSA concentrations (>20.000 ng/mL), which might be the result of different assay principles. Although the CUSUM test for linearity did not indicate any significant deviation from linearity (P>0.050) in all three Passing-Bablok regression analyses, the slope value differed significantly from one when comparing the IgY-based or IBL commercial ELISA with the Cobas assay, which indicates a proportional difference between the compared assays.
The major limitation of the present study is the time-consuming process of specific IgY antibody purification via affinity chromatography, and since they are polyclonal, possible batch-to-batch differences of generated IgYs. Future steps of our research will focus primarily on assay re-design including the elimination of the mammalian antibody used for antigen capture and optimizing its application as a point-of-care device. Nevertheless, the developed IgY-based ELISA represents an alternative method to commercial ELISA for determining the PSA serum concentration.
 XML Download