

 PDF
PDF ePub
ePub Citation
 Print
Print


INTRODUCTION
After implant placement, blood comes into contact with the dental implant's surface. Blood proteins are adsorbed on the implant's surface, and the bone formation cascade initiates around the implant following an inflammatory phase [1]. The surface engineering of dental implants has focused on facilitating these molecular and cellular adhesion and migration processes around the implant, with the aim of accelerating peri-implant bone healing and enhancing bone-to-implant contact (BIC) [23].
Hydroxyapatite (HA) is known to be a non-inflammatory, non-toxic, and non-immunogenic material with osteoconductive and bioactive properties [4]. Therefore, HA coating has been proposed as an implant surface modification method to promote peri-implant bone healing and osseointegration, thereby enabling early functional loading [5]. However, many products have been removed from the market because of study results showing high complication rates. One study reported that the HA-coated layer was peeled or absorbed and a gap was formed between the implant and bone, resulting in failure of osseointegration due to mechanical instability [6]. In addition, even if the initial osseointegration was excellent, the HA surface was vulnerable to bacterial infection, and once infected, the coated layer was absorbed and caused early detachment or delamination [7]. However, the negative outcomes of HA-coated implants in the past seem to have been due to the low-quality coating and crystallization of HA. Recently developed HA-coated implants have been reported to have a high cumulative success rate, exceeding that of early HA-coated implants [89].
Another approach has been attempted to boost the surface energy and to lower the hydrophobicity of dental implants using a contamination-reducing storage method for promoting early peri-implant bone formation [10]. Increased surface wettability has been proposed to facilitate fibrin adhesion and extracellular protein and platelet expression, resulting in osteoblast migration and colonization toward the implant surface [111213]. Such molecular and cellular behavior is considered to improve early bone healing and to promote the development of an intimate bone-to-implant interface. Histologic evidence from a human study showed that the percentage of BIC at 2 and 4 weeks was higher for hydrophilic implants than for hydrophobic implants [14]. Another study revealed that this surface improvement had a positive effect on cellular metabolism and signal transduction related to bone regeneration and osseointegration in the early healing stage [15].
Osteoblasts secrete an unmineralized organic matrix (osteoid), which later becomes mineralized bone tissue during a maturation process [16]. There is a considerable body of evidence demonstrating a relationship between implant surface wettability and mineralized bone formation. However, little evidence exists regarding the relationship between the implant surface and unmineralized bone dynamics.
The objective of this study was to investigate the bone healing of 3 dental implants with different surfaces in dogs: sandblasting, large-grit and acid etching (SLA; IS-III Active®), SLA with HA nanocoating (IS-III Bioactive®), and SLA stored in sodium chloride solution (SLActive®). The hypothesis was that osteoid formation would be facilitated by increasing surface wettability.
MATERIALS AND METHODS
Animals
This study protocol was approved by the Institutional Animal Care and Use Committee (IACUC), Seoul National University (IACUC No. SNU-160412-3), and all experimental procedures were conducted according to guidelines of the Institute of Laboratory Animal Resources at the Seoul National University. The timeline of the present study is described in Figure 1. This study was conducted following the Animal Research: Reporting In Vivo Experiments (ARRIVE) guidelines [17]. Nine 1-year-old male beagle dogs ranging from 12 to 15 kg in weight were used in this study. At recruitment, all animals were healthy and had no abnormal dentition. Before the trial, the animals were allowed to acclimate to the facility for 2 weeks. The experiment was conducted from June 9, 2016, to August 17, 2017. The dogs were individually housed in 90 cm×80 cm×80 cm (width×depth×height) indoor kennels with free access to water and were fed a standard dog food diet (HappyRang; Seoulfeed, Seoul, Korea) or a balanced moist diet after tooth extraction.
Study implants
Three implants with different surfaces and a tapered design were used in this study: a hydrophobic SLA surface implant (IS-III Active®, Neobiotech, Seoul, Korea; self-tapping, surface roughness [Ra]=approximately 3.5 μm; contact angle=109.2°) that was 3.5 mm in diameter and 8 mm in length; a hydrophilic SLA surface implant with HA nanocoating (IS-III Bioactive®, Neobiotech; self-tapping, Ra=approximately 3.5 μm; contact angle=approximately 4°) that was 3.5 mm in diameter and 8 mm in length; and a hydrophilic SLA surface implant stored in sodium chloride solution (bone level SLActive®, Straumann, Basel, Switzerland; non-self-tapping, Ra=approximately 1.8 μm [18]; contact angle=0° [10]) that was 3.3 mm in diameter and 8 mm in length.
Surgical procedure
The surgical procedure was conducted under general anesthesia induced with Zoletil® (10 mg/kg; Virbac, Carros, France), Rompun® (0.15 mg/kg; Bayer Korea, Ansan, Korea), and atropine sulfate (0.05 mg/kg; Jeil, Daegu, Korea) administered intravenously. Before surgery, local infiltration anesthesia using 2% lidocaine HCl with 1:100,000 epinephrine (20 mg/kg; Huons, Seongnam, Korea) was induced. The mandibular second, third, and fourth premolars (P2, P3, and P4) were extracted from both sides (Figure 2A and B). To minimize alveolar bone trauma, teeth were extracted following a hemisection in the buccolingual direction and reflection of the mucoperiosteal flap. The surgical site was closed with resorbable sutures (4/0 Vicryl®; Ethicon, Inc., Johnson & Johnson Medical, Norderstedt, Germany), and the sutures were removed 1 week later.
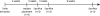
 | Figure 2Clinical photographs from the present study. Before tooth extraction (A), after tooth extraction (B), 1 month after tooth extraction (C), horizontal incision and flap reflection (D), implant placement (E), suture with 5/0 Vicryl (F).
|
The animals were administered oral antibiotics (amoxicillin [500 mg]; Chongkundang Pharm. Co., Seoul, Korea) twice daily and analgesics (ibuprofen [400 mg], DaeWoong Pharm. Co., Seoul, Korea) 3 times daily for 1 week to alleviate postoperative pain and inflammation. The wound sites were inspected twice a week to verify whether any complications had occurred.
Four weeks after tooth extraction, a single incision was made on the crest for implant placement (Figure 2C and D). A small full-thickness flap was reflected and prepared by sequential drilling. Three different implants were placed bilaterally—that is, 6 implants in total—according to a random sequence generated using the www.random.org website. The implant shoulder was positioned on the bone crest, and the inter-implant distance was at least 3 mm. Subsequently, the cover screw was adjusted, and the flap was repositioned and closed with 5/0 Vicryl® (Ethicon, Inc., Johnson & Johnson Medical) using the continuous locking suture technique (Figure 2C and F). All operations were performed by a single surgeon (H.B.A.) All animals received mouthwashes using 0.12% chlorhexidine gluconate solution (Hexamedine®, Bukwang Pharm., Seoul, Korea) 3 times a week postoperatively. The suture was removed 1 week after implant placement surgery.
Histologic processing
Three dogs were euthanized at 2, 4, and 12 weeks following implant placement, respectively. A fixative containing a mixture of 5% glutaraldehyde and 4% formaldehyde was perfused through the artery. The mandible was dissected, and block biopsies were obtained using a saw. Biopsies were processed as undecalcified sections in accordance with methods described by Donath and Breuner [19]. Sections were microgound and polished to approximately 30 μm, followed by staining with Goldner trichrome.
Histologic and histomorphometric examination
Slides were evaluated using an incandescent light microscope (DP72; Olympus, Tokyo, Japan) connected to an imaging system (DP Controller; Olympus). Histomorphometric analyses were performed using image analysis software (Image J 1.51j8; National Institutes of Health, Bethesda, MD, USA). Linear measurements were made at the buccal and lingual aspects of the implants (Figure 3):
 | Figure 3Schematics of linear measurements illustrating vertical marginal bone loss at the buccal and lingual aspects of the implants (b-MBL and l-MBL, respectively) (a, b).
|
1) b-MBL: the vertical marginal bone loss at the buccal aspect of the implant.
2) l-MBL: the vertical marginal bone loss at the lingual aspect of the implant.
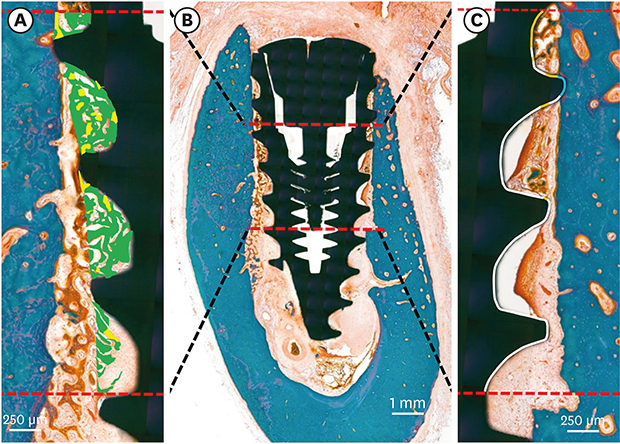
Mineralized BIC (mBIC), osteoid-to-implant contact (OIC), total BIC (tBIC), mineralized bone area fraction occupied (mBAFO), osteoid area fraction occupied (OAFO), and total bone area fraction occupied (tBAFO) were measured in the threads at the region of interest (ROI) (Figure 4). The ROI in this study was the peri-implant area, located between 3 and 6 mm below the implant shoulder. The total bone tissue was defined as the combination of the osteoid and mineralized bone matrix [20].
 | Figure 4Histomorphometric analysis in the ROI, beginning at 3 mm and ending at 6 mm below the implant shoulder (B). Areas of the osteoid (green) and mineralized bone (yellow) were defined within the thread (A). Tissue-to-implant contact within the ROI (C) was differentiated into osteoid (orange), mineralized bone (blue), and void (white).ROI: region of interest.
|
Statistical analysis
Descriptive statistics are expressed as mean values±standard deviation. Sample size was calculated based on a previously published study [11] using G*power (version 3.1., Autenzell, Germany). Type I error was set at 0.05 and type II error was set at 0.2. The clinically relevant difference was set at 20% of mean BIC with a standard deviation of 5%, achieving a statistical power of 94.8%.
Statistical software (SPSS Statistics 19.0, IBM Corp., Armonk, NY, USA) was used. Two-way (3×3) analysis of variance (ANOVA) was initially used to determine the effects of different implant surfaces and healing time periods at an alpha level of 0.05, followed by the post hoc Tukey test. Two-way ANOVA revealed significant interactions between the 2 factors for the mBIC, tBIC, and mBAFO (Table 1). Therefore, the simple main effects of the implant surface and healing time period were each examined. The alpha level was corrected to control for type I error: 0.0167 (≒0.05/3) for the differences across implant surfaces (a total of 3 comparisons for each healing time period), and 0.0167 (≒0.05/3) for the differences among the 3 healing time periods (3 comparisons for each implant surface). For the healing time period, post hoc pairwise comparisons were performed using the Bonferroni correction. The 3 different healing time periods produced 3 comparisons (3C2=3) for each implant surface, and thus the alpha level was corrected to 0.0056 (0.0167/3). The 3 different implant surfaces produced 3 comparisons (3C2=3) for each healing time period, and the alpha level was thus corrected to 0.0056 (0.0167/3).
Table 1
Results of the histomorphometric analysis

Values are presented as mean±standard deviation. b-MBL, l-MBL, OIC, mBIC, tBIC, OAFO, mBAFO, and tBAFO were measured. For the implant surface, time, and their interaction (implant surface×time), P values obtained by 2-way analysis of variance are reported. Post hoc tests were not performed when an interaction was observed.
b-MBL: buccal marginal bone loss, l-MBL: lingual marginal bone loss, OIC: osteoid-to-implant contact, mBIC: mineralized bone-to-implant contact, tBIC: total bone-to-implant contact, OAFO: osteoid area fraction occupied, mBAFO: mineralized bone area fraction occupied, tBAFO: total bone area fraction occupied.
a)Statistically significant difference between 2 and 4 weeks of healing time; b)Statistically significant difference between 2 and 12 weeks of healing time; c)Statistically significant difference between IS-III Active and IS-III Bioactive; d)Statistically significant difference between IS-III Active and SLActive; e)Statistically significant difference between IS-III Bioactive and SLActive.
![]()
RESULTS
Clinical observations
At implant placement, spinning occurred in 1 case (SLActive, 12-week group). Besides this implant, overall implant stability quotient values were between 67 and 81, and the insertion torque values were >19 Ncm (Supplementary Table 1). All implants exhibited uneventful healing with no clinical signs of inflammation and were processed for histologic analysis.
Histologic analysis
The histologic observations identified no inflammatory tissue in the peri-implant region. In several cases, crestal bone loss was seen, and implant invasion to the inferior alveolar nerve was observed. To minimize the effect of the aforementioned factors on mBIC, OIC, tBIC, mBAFO, OAFO, and tBAFO, the ROI was set in 3 threads between 3 and 6 mm below the implant shoulder.
Two-week healing
Woven bone formation was observed around the implant threads 2 weeks after implant placement (Figures 5 and 6). On the pristine bone sides, newly formed bone was observed to spread out toward the implant surface. On the other sides, newly formed bone was randomly situated throughout the gap between the implant surface and bone-like islands. Osteoclast and osteoid matrix with osteoblast seams indicated dynamic new bone formation.
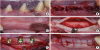
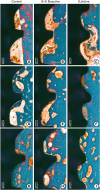 | Figure 5Histologic photograph of dental implants with IS-III Active, IS-III Bioactive, and SLActive surfaces at 2, 4, and 12 weeks following implant placement.
|
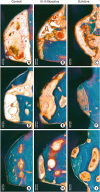 | Figure 6Histologic photograph of dental implants with IS-III Active, IS-III Bioactive, and SLActive surfaces at 2, 4, and 12 weeks following implant placement. Week 2 showed osteoid and woven bone formation within implant threads. Week 4 exhibited primary peri-implant bone mixed with woven and lamella bones. At 12 weeks, primary plexiform formation nearly ceased, and secondary remodeling was ongoing around all types of implants.
|
Four-week healing
Primary peri-implant bone, showing plexiform bone mixed with woven and lamella bones, was observed (Figures 5 and 6). More intensely mineralized bone was observed in the spaces within the threads and around the implant. In contrast to the incomplete bone formation observed after 2 weeks of healing, more developed bone structures were detected. Reversal lines—that is, interfaces between the old bone and new matrix (osteoid)—were also observed.
Twelve-week healing
Primary plexiform formation had nearly ceased and secondary remodeling was ongoing around all types of implants (Figures 5 and 6). Remodeling was much stronger at the BIC area than at the area further apart from the interface. The cement line, reflecting secondary osteon formation and lamellar bone deposition, was exhibited more intensely than was observed in the previous healing phase.
Histomorphometric analysis
The b-MBL, l-MBL, OIC, mBIC, tBIC, OAFO, mBAFO, and tBAFO are shown as mean±standard deviation (Table 1). Two-way ANOVA tested the b-MBL, l-MBL, OIC, mBIC, tBIC, OAFO, mBAFO, and tBAFO in the 3 implant surfaces with different healing time periods (2, 4, and 12 weeks) (Table 1). Statistically significant differences were observed across the implant surfaces for OIC, mBIC, tBIC, OAFO, and tBAFO (Table 1). Statistically significant differences were observed over time for l-MBL, mBIC, tBIC, mBAFO, and tBAFO (Table 1). In addition, an interaction effect between the implant surfaces and healing time periods was observed for mBIC, tBIC, and mBAFO (Table 1). The results of the post hoc test regarding the implant surfaces and healing time periods are presented in Table 1.
The statistical significance of the simple effects is represented in Figures 7 and 8. To control type I error, an adjusted P value according to the numbers of comparisons for the parameters was used. Overall, a statistically significant increase was observed at 12 weeks compared with 2 and/or 4 weeks in mBIC and tBIC for all 3 implant surfaces (Figure 7A and B). A statistically significant increase was observed at 12 weeks compared with 2 weeks in mBAFO for the IS-III Active implants (Figure 7C). A statistically significant increase in mBIC and tBIC was observed for the SLActive surface implants in comparison with the IS-III Active implants at 2 weeks (Figure 8A and B).
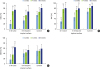 | Figure 7Bar graphs of mBIC, tBIC, and mBAFO for different implant surfaces after 2, 4, and 12 weeks of healing. Red, yellow, and green bars indicate 2, 4, and 12 weeks of healing, respectively. The X-axes represent the implant surface. (A) mBIC, (B) tBIC, and (C) mBAFO values for different implant surfaces with 2, 4, and 12 weeks of healing.mBIC: mineralized bone-to-implant contact, tBIC: total bone-to-implant contact, mBAFO: mineralized bone area fraction occupied.
a,b)Statistically significant difference among 2 weeks, 4 weeks and 12 weeks of healing in each implant surface (adjusted P<0.0056).
|
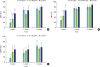 | Figure 8Bar graphs of mBIC, tBIC, and mBAFO for 2, 4, and 12 weeks of healing with 4 different implant surfaces. Orange, blue, and purple bars indicate IS-III Active, IS-III Bioactive, and SLActive implant surfaces, respectively. The X-axes represent healing time. (A) mBIC, (B) tBIC, and (C) mBAFO values for 2, 4, and 12 weeks of healing with different implant surfaces.mBIC: mineralized bone-to-implant contact, tBIC: total bone-to-implant contact, mBAFO: mineralized bone area fraction occupied.
a,b)Statistically significant difference among implant surfaces for each healing time (adjusted P<0.0056).
|
DISCUSSION
The aim of this study was to investigate bone healing and remodeling associated with the use of 3 dental implants with different surfaces in dogs. Four major findings could be drawn from the results presented above. First, tBIC values plateaued at 4 weeks, and no significant differences were observed in tBIC values between 4 and 12 weeks in any of the 3 implant groups. Secondly, >50% of instances of mBIC were observed after 2 weeks of observation in the SLActive group and after 4 weeks of observation in the IS-III Active and IS-III Bioactive groups. Third, the OIC, OAFO, and tBAFO values were affected by the implant surfaces, and l-MBL and tBAFO were affected by the healing time. Finally, primary bone formation was observed to have almost been completed at 12 weeks, and was proceeding toward secondary remodeling.
According to our data, higher OIC values were observed with the IS-III Bioactive implant (HA-coated implant) than with the IS-III Active implant (non-HA-coated implant). This suggests that the nano-coated HA surface facilitated osteoblast activity. Several studies have reported that HA upregulates the expression of genes associated with bone formation [2122]. The upregulation of osteoblastic activity might last for a long period on HA-coated implant surfaces.
SLActive, the hydrophilic surface implant, did not have a markedly enhancing effect on OIC at any observation time compared with the IS-III Active implant. The hydrophilic surface might have affected early bone formation before 2 weeks, resulting in increased mBIC values at 2 weeks, by which time the hydrophilic surface modification effect might have almost disappeared, a finding consistent with those of previous studies [112324].
In our study, OIC and OAFO values showed a tendency to increase from 2 to 4 weeks, and then decreased at 12 weeks. As osteoblasts are activated, an unmineralized organic matrix osteoid is supplemented to the layer of cells [1]. It was confirmed that osteoblast activity continued to occur around the implant following implant placement until 12 weeks. The maximum OIC and OAFO values at 4 weeks might explain the summation of primary and secondary bone formation. Based on our data, osteoblast activity decreased, resulting in a reduced osteoid mass as primary bone formation was finalized.
As mineralized bone mass increased around the implants, OIC and OAFO values decreased, and this tendency was most pronounced at 12 weeks, reflecting the bone remodeling process. The HA-coated surface implant showed higher OIC values than did the non-HA-coated, hydrophobic surface implant not only during the initial bone formation period, but also during the remodeling period. The remodeling process continues throughout life and may be interrupted by overloading or early loading [2526]. Therefore, the use of a HA-coated surface implant might be advantageous by facilitating early loading in terms of early peri-implant bone formation and increased resistance to disturbances in the bone remodeling process.
Meanwhile, in clinical situations, dissolution of the HA coating during surgical procedures could lead to exposure of the titanium surface and formation of gaps between the implant and non-resolved HA film. The vulnerability of HA coating on titanium surfaces emerged as a clinical issue, suggesting mechanical and biologic problems [2728]. To reduce the long-term dependence on mechanical interlocking between the coating and implant, while attempting to benefit from the increased osteoconductive properties observed in HA coatings, thinner HA coating technologies have been developed for dental implant surfaces [293031]. In this study, the thickness of the HA nanoparticle layer was approximately 10 μm (data provided by the manufacturer), and no inflammation or HA particle peeling was observed in the HA-coated implant specimens. The desirable thickness of HA coating for promoting the host response of peri-implant bone healing and for reducing mechanical problems seems to be approximately a few micrometers, as suggested by a previous study [3032].
Newly formed bone should be reconstructed in a way that it can withstand occlusal loads. Regulation of osteoblast activity is facilitated by a cytokine signal transmitted by mechanical stimuli; the name of this process is mechanotransduction. In our study model, prostheses were not delivered; therefore, we could not confirm the effect of occlusal loading on the hydrophilic and/or hydrophobic surface of the implants. In future research, bone remodeling following prosthesis delivery needs to be investigated.
The results of this study suggest that implant surface wettability facilitates bone healing dynamics around implants, which could be attributed to the improvement of early osseointegration. The histologic and histomorphometric evaluations identified higher and faster new bone formation associated with the use of hydrophilic surface implants than with the use of hydrophobic surface implants. In addition, osteoblasts might become more activated with the use of HA-coated surface implants than with hydrophobic surface implants in the bone remodeling phase.
 XML Download