

 PDF
PDF Citation
 Print
Print


INTRODUCTION
In the recent decade, dramatic advances in neonatal care have been achieved with the collaborative efforts of obstetricians and neonatologists. The improved survival rate of extremely low birth weight infants led us to expect improving long-term outcomes.
Since neurodevelopmental disabilities and recurrent health problems may persist into early to late childhood, the focus for perinatal strategies to reduce long-term morbidities, especially to prevent brain injury with interest to lowering cerebral palsy (CP) prevalence has been continued. CP is the most common cause of significant neurodevelopmental impairment. In response to this expectation, many areas have established population-based registers to monitor CP prevalence, with the aim of relating changes in antenatal, perinatal, and postnatal care.1 The surveillance for CP in Europe (SCPE) network and many multicenter networks observed the decrease trends in CP prevalence by gestational age (GA).2 At the same time, the neurosensory impairments such as blindness or deafness with growth failure were observed. So far, no long-term data on very low birth weight infants (VLBWIs) was reported in the Korea. The Korean Neonatal Network (KNN)3 database was established in 2013 which improved data collection systems in participating facilities and studying various factors associated with the mortality and morbidity of VLBWI in Korea. Long-term data were also collected for VLBWI born between January 2013 and December 2014 in Korea. A better understanding of long-term outcomes in a national cohort, including all VLBWI in Korea, will lead to better approaches to neonatal care for VLBWI in Korea.
In this study, the primary outcome of neurodevelopmental outcomes (CP, Bayley version II or III and Korean developmental screening test for infants and children [K-DST]) using standardized scales was assessed among VLBWI in the birth-year period 2013–2014 who survived, were discharged and were followed at corrected ages of 18–24 months in Korea. The general prevalence of CP according to GA, in addition to Bayley Scales of Infant Development and K-DST, was also observed.
The secondary outcome was to observe other ranges of clinical outcomes, such as hearing and eye impairments, growth, re-hospitalization rates and incidence of periventricular leukomalacia (PVL) and other health issues among VLBWI who were discharged from the neonatal intensive care unit (NICU).
METHODS
Long-term data were collected for 2,660 VLBWI born between January 2013 and December 2014. The data were from 43 NICUs in 2013 and 54 NICUs in 2014 using a standardized form defined as the KNN electronic case report form. The inclusion criterion for this study was all VLBWI born in participating neonatal centers within 28 days of birth who survived, were discharged and were followed at corrected ages of 18–24 months. Collected data included general medical information (7 items), growth information (4 items), neurosensory and developmental information (9 items), treatment information (8 items), readmission and the most recent brain imaging studies. Neurodevelopmental tools used were either Bayley Scales of Infant and Toddler Development-2nd Edition (BSID-II) or/and the cognitive, language and motor composites of the Bayley Scales of Infant and Toddler Development-3rd Edition (BSID-III) or/and K-DST. As a result, a total of 2,326 infants weighing less than 1,500 g at birth were included in this study. If possible, telephone survey was also conducted to obtain long-term data after discharge. Data were collected by local staff using uniform definitions; they were then electronically submitted to the KNN central office. The statistical analysis and results are based on the reports from 2013 and 2014 KNN annual reports.45
Definitions and classification
The registries participating in the KNN are population-based. Survivors of VLBWI who followed up were assessed at corrected 18–24 months of age by pediatricians and/or rehabilitation doctors. Impairments included CP, deafness (hearing loss requiring amplification) and developmental delay according to the mental developmental index (MDI) or psychomotor developmental index (PDI) of the BSID-II or/and the cognitive, language and motor composites of the BSID-III. Children were considered at risk if scores were > 2 standard deviations (SDs) below the test mean (scores of < 70). Our criteria for the diagnosis of CP is defined as permanent but not unchanging disorders of movement and/or posture and of motor function caused by a non-progressive interference, lesion, or abnormality of the developing/immature brain. Progressive disorders or non-cerebral diseases leading to a loss of motor function are excluded. The subtypes of CP were recorded as diplegia, hemiplegia, quadriplegia or unknown. For the K-DST, the questionnaire in the screening test was completed by either parents or primary caregivers who were primarily involved in caring for the child. The area for “further evaluation needed” is considered to be a risk group for developmental delay. Severe disability comprised unlikely to sit alone or unlikely to walk ten steps independently as noted in the Gross Motor Function Classification System. The other hospital outcomes were defined as per standardized data collection for KNN.3
Statistical analysis
Quantitative variables were described with the number of non-missing values, mean, SD, 25th percentile, median, and 75th percentile. Qualitative variables were described with the number and percentage of subject. Missing values will not be included in the calculation of percentages. Statistical analyses were performed using STATA 14.2 (Stata Corp., College Station, TX, USA) and SAS 9.4 (SAS Inst., Cary, NC, USA).
Ethics statement
This study was reviewed and approved by the Institutional Review Board (IRB) of Ethics Committee of Seoul St. Mary's Hospital, The Catholic University of Korea, College of Medicine (IRB No. KC130NMI0228). Informed consent was waived by the board due to the retrospective nature of this study.
RESULTS
After excluding the expired 151 patients in 2013 and 326 patients in 2014, 2,660 VLBWI were assessed in the long-term study. Of the 2,660 VLBWI born between January 2013 and December 2014 and survived to follow up at corrected 18–24 months of age, 35 patients were reported to have expired after NICU discharge; thus, approximately 1.2%–1.5% of NICU graduates with underlying diseases eventually led to death. Telephone survey was performed in 310 (11.7%) VLBWI and follow up loss occurred in 570 (21.4%) VLBWI. Accordingly, the follow up rates after discharge were 76.6% in 2013 and decreased to 59.0% in 2014.
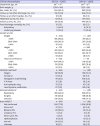
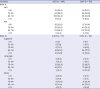
The baseline characteristics and clinical outcomes of VLBWI are shown in Table 1. The mean GA and birth weight were 291/7 ± 26/7 weeks of GA and 1,093 ± 268 g in 2013 and 292/7 ± 26/7weeks of GA and 1,125 ± 261 g in 2014, respectively. About half of VLBWI were readmitted to the hospital at least once in the first 1–2 years of life, mostly as a result of respiratory illnesses; these rates were approximately 2 times the rates of other causes of readmission. Second, surgery for underlying health issues such as inguinal hernia required readmission for surgery in the first 1–2 years of life. Other causes were infection, central nervous system and nutritional or growth failure. At the corrected 18-month visit, a weight < 50th percentile was reported in about half of the graduates; this measure was 46.5% in 2013 and 66.1% in 2014. Infants who were < 50th percentile in height and head circumference percentiles were more than half of the population of this study. The prior or present oxygen use at home after discharge occurred in 16.8% of infants in 2013 and 14% in 2014. However, most patients stopped oxygen at corrected 18–24 months of age. The nasogastric tube feeding incidence was 8%–9% and the ventriculo-peritoneal shunt rate was reported to be 1.5%–2.5%. There were also VLBWI who were on medication with anti-epileptic drugs (3.6%–3.9%) or Levothyroxine (8%–8.6%). Brain magnetic resonance imaging (MRI) was not performed in many children discharged after the NICU. However, among the VLBWIs who underwent brain MRIs performed after NICU discharge, 81 (9.6%) in 2013 and 80 (6.8%) in 2014 had abnormal findings; bilateral PVLs occurred most often in 29 (29.0%) infants in 2013 and 32 (31.4%) infants in 2014.
Table 1
Clinical characteristics and outcomes of VLBWIs (n = 2,660)
Primary outcome
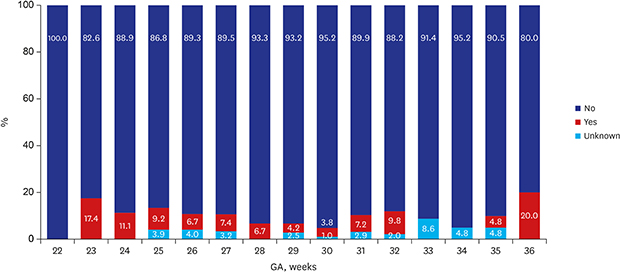
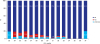
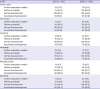
Of the 2,660 infants enrolled in this study, 35 (1.3%) died and 597 (22.4%) were lost to follow up at corrected 18–24 months of age, leaving 2,028 (76.2%) infants who were eligible for CP assessment at the corrected age Table 2. The overall prevalence of CP among the follow up infants was 6.2% in 2013 and 6.6% in 2014. Figs. 1 and 2 demonstrate the distribution of CP cases according to GA. According to GA, the prevalence of CP was 8.8% among VLBWI born between 22 to 27 weeks of gestational range; this rate steadily declined to an estimated 30 weeks of GA. However, infants at 36 weeks of GA who were born with severe intrauterine growth retardation weighing less than 1,500 g, the CP incidence spiked to 20 percent of rate (Fig. 1). In 2014, the prevalence of CP was 9.6% among VLBWI born between 22 to 27 weeks of gestational range, a range that is considered to be the highest risk group of preterm infants among all VLBWI. Children born after 28 weeks of GA showed a steady decline of CP incidence. Similarly, in 2014, in infants at 36 weeks of GA who were born with severe intrauterine growth weighing less than 1,500 g, the CP incidence was 20 percent (Fig. 2). In general, the prevalence of CP showed an inverse relationship to GA.
Table 2
Neurodevelopmental outcomes: VLBWI born 2013 vs. 2014
Fig. 1
CP according to GA in VLBWI born in 2013. The above figure was abstracted from 2013 KNN annual reports.4
CP = cerebral palsy, GA = gestational age, KNN = Korean Neonatal Network.
Fig. 2
CP according to GA in VLBWI born in 2014. The above figure was abstracted from 2014 KNN annual reports.5
CP = cerebral palsy, GA = gestational age, KNN = Korean Neonatal Network.
Among the VLBWI, infants who were likely to sit alone were 91.5% of those born in 2013 and 91.7% in 2014. The rates of VLBWI who were likely to walk ten steps independently were 86.2% in 2013 and 86.3% in 2014. The participation for rehabilitative support was 37.6% in 2013 and 34.9% in 2014. The VLBWI who underwent speech therapy was lower as 5.1% in 2013 and 5.7% in 2014 (Table 2).
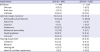
The follow up rate for BSID-II was low because only 433 (16.3%) infants were scored with this method in Table 3. Of the 436 infants among all enrolled infants, 246 infants born in 2013 were assessed with the BSID-II. Of these, 55 infants (22.4%) were at risk (scores of < 70) on the MDI, and 63 (25.6%) were at risk on the PDI. Of VLBWI born in 2014, among 187 infants assessed, 45 (24.1%) were at risk on the MDI, and 27 (14.4%) were at risk on the PDI (Table 3). For BSID-III, the follow up rate was even lower; specifically, 198 infants (7.4%) were enrolled between 2013 and 2014. In 2013, 6 (7.8%) were at risk in cognitive development, 5 (6.5%) were at risk in language development and 10 (13%) were at risk in motor development among the VLBWI born in 2013 at corrected 18 months of age. Similarly, in VLBWI born in 2014, 5 (4.1%) were at risk in cognitive development, 7 (5.8%) were at risk in language development and 4 (3.4%) were at risk in motor development.
Table 3
BSID outcomes: VLBWI born 2013 vs. 2014
For the K-DST, only 809 (30.4%) children were available for the questionnaire of the screening test Table 4. The area “further evaluation needed” is considered to be a risk group for developmental delay. In 2013, VLBWI were at risk for neurodevelopmental delays in the following areas: 34 (11.3%) in gross motor, 17 (5.7%) in fine motor, 19 (6.3%) in cognitive, 22 (7.3%) in language, 14 (4.7%) in personal-social and 15 (5.0%) in self-help areas. In 2014, VLBWI were at risk for neurodevelopmental delays in the following areas, similar to the rates in 2013: 76 (15.0%) in gross motor, 40 (7.9%) in fine motor, 46 (9.1%) in cognitive, 37 (7.3%) in language, 33 (6.5%) in personal-social and 40 (7.9%) in self-help areas (Table 4). The overall percentage of normal development was about 70%–80%.
Table 4
K-DST in VLBWI born 2013 vs. 2014
Secondary outcome
Regarding eye complications, blindness in both eyes was reported in 0.2%–0.3% of VLBWI. Other ophthalmologic disorders manifested mainly as retinopathy of prematurity in 41.2% in 2013 but decreased to 26.6% in 2014. The 23 (2.7%) and 19 (1.6%) children, respectively, reported wearing glasses. Bilateral hearing loss was 1.9% in 2013 and 0.8% in 2014. The need for a hearing aid was observed in 6 (0.7%) VLBWI in 2013 and 3 (0.3%) VLBWI in 2014 (Table 5).
Table 5
Eye and hearing impairments: VLBWI born 2013 vs. 2014
DISCUSSION
This is the first national KNN study to report long-term outcomes at corrected 18–24 months age for VLBWI in Korea including GA-specific information. The mean GA among VLBWI born 2013 and 2014 were similar, however, the birth weight was significantly lower in 2013 (1,093 ± 245 g vs. 1,125 ± 280 g) (P = 0.002). This may reflect that VLBWI with small for GA with more clinical severity were enrolled from the 43 NICUs in 2013 (mainly tertiary hospitals) than 54 NICUs in 2014. CP remains a major cause of childhood disability affecting more than 2 (2 to 3.6) per 1,000 live-born children.6789 The CP prevalence of approximately 1.8 to 2.3 cases per 1,000 children is reported in Europe, Australia, and the USA, but the prevalence was higher, 2.9 and 3.6 per 1,000 children, in Uganda and Egypt, respectively.1011 The CP incidence is higher in VLBWI. The prevalence of CP based on the SCPE which included 8 national registries demonstrated a decline in the rate of CP from 131.8 to 74.1 per 1,000 live births among VLBWI between 1980 and 2003.2 In our study, the overall incidence of CP was 6%–7%; these rates were lower compared to that of previously reported multi-center incidences for CP. When compared the prevalence of CP according to GA, our CP prevalence for neonatal survivors born < 28 gestational weeks was 8%–9.5%; this rate was considered higher compared to the Swedish study that reported 71.4 per 1,000 live births of CP prevalence.12 On the other hand, a systemic review analyzed in Australia and Canada reported that the prevalence of CP was 111.80 per 1,000 neonatal survivors born before 28 weeks; these were higher incidences of CP compared to our study.4 In a study by Valleur et al.,13 the CP prevalence for infants born < 28 gestational weeks was reported to be 149.1 per 1,000 neonatal survivors when they were assessed at age 6 years. Although it is unclear whether the lower prevalence of CP in Asian children can be attributed to ethnic disparities, studies conducted in the United States have reported that Asian children had a lower CP prevalence than that in Caucasian children.1415
In Fig. 1, a downward curve of the CP incidence is noted for those born between 28–30 gestational weeks of VLBWI.45 The lower incidence for CP in those born < 25 weeks of GA may result in a potential bias; no survival may reduce the gestational specific CP prevalence and eventually lower the general incidence of CP. VLBWI who were born at 22 weeks of GA in 2013 (Fig. 1) had no incidence of CP. In 2014, a higher prevalence of CP in neonatal survivors was observed in relation to GA group in those born before 28 weeks of GA (Fig. 2). In a few studies, the unexpectedly high pooled CP incidence in children born at GA 28–31 weeks compared to children born at less than 28 weeks of GA also explained a possibility of bias in the analysis.2 For BSID-III, the infants at risk of developmental delay were reported lower (< 10%) when compared to BSID-II of −20% of infants at risk of developmental delay. There are two possibilities of lower rate of developmental delay in BSID-III; the follow up rate was lower (7.4% vs. 23.7%) which may inadvertently and inaccurately lower the rate of infants at risk. Another limitation of the BSID-III is that cognitive and motor scores have been shown to be higher than BSID-II.16 Accordingly, higher mean values of the BSID-III have required modifications of the cut-points of the BSID-III composite scores; current NICHD NRN categories are moderate delay 70–84, severe delay < 70 and profound delay ≤ 54.17
Regard to post-discharge mortality, our mortality rate after discharge was reported as 15 in 2013 and 12 per 1,000 neonatal survivors in 2014, probably reflected by lower follow up rate. The study by Kugelman et al. 18 manifested that infant deaths after discharge from the hospital but before 1 year of age were reported a mortality rate of 5.9 per 1,000 live births < 1,500 g which showed lower post-discharge mortality rate. In this study, the post-discharge mortality was independently associated with congenital malformations, neonatal seizures, necrotizing enterocolitis and bronchopulmonary dysplasia. It is also important to note that severe growth retarded infants at 36 weeks of GA with less than 1,500 g had a high 20% incidence of CP (Figs. 1 and 2).45 The high incidence of CP at 36 weeks of GA in both 2013 and 2014 revealed that careful follow up should be conducted for neurodevelopmental outcomes in severely growth retarded preterm infants. The growth < 50th percentile was manifested in more than half of the graduates suggesting a need for growth follow up after NICU discharge. The rehabilitative support was frequently found in 35%–37% while suggested that our VLBWI were in a continuous need for motor support even after discharge. The language support counted only about 5% which may be due to later development of language with the language support usually occur at corrected 18–24 months of age.
Regarding to neurosensory impairments at a corrected age of 2 years, the blindness in both eyes was reported in 0.2%–0.3%, while bilateral hearing loss was 1.9% in 2013 and 0.8% in 2014. The lower rate of need for a hearing aid may be a result of the circumstances that they are too young to wear a hearing aid at a corrected age of 18 months. Although low in rates, the eye and hearing impairments are necessary to follow up in a longer run to observe more accurate outcomes.
Regarding to other health issues, about half of VLBWI were readmitted to the hospital at least once in the first 1–2 years of life, mostly as a result of respiratory illnesses; these rates were reported to occur approximately 2–3 times as often as the readmission rate of normal birthweight children.19 MRI findings in children with CP indicate that brain maldevelopments may only account for approximately 10% of the pathology in children with CP.2021 PVL is more predominantly found in the brain MRIs of preterm infants with a developmental delay while MRI findings of full-term children are more heterogeneous.22 In our study, brain MRIs were performed in 22.8% of VLBWI after discharge in 2013 and 13.2% in 2014. Those MRIs may be performed more frequently in VLBWI with higher risk for developmental delay. Bilateral PVLs were most often found, specifically, in 29 (29.0%) VLBWI in 2013 and 32 (31.4%) in 2014. PVL is typically bilateral, affecting the motor tracts and gives rise to bilateral spastic CP.20 In contrast to bilateral PVL, severe intraventricular hemorrhage (IVH) or hemorrhagic infarction usually result in a unilateral impact on motor tracts and, thus, gives rise to unilateral spastic CP.23 Recently, a study by van Haastert et al.24 described a decrease in cystic PVL of more than 50% between birth periods ranging from 1990 to 1993 and 2002 to 2005. Our bilateral PVL rate (30%) counted only for those performed brain MRIs after discharge. Higher PVL rate may result because more brain MRIs after discharge were performed at higher neurodevelopmental risk infants. Thereby, more brain MRIs should be performed in a long run to observe a more accurate incidence of PVL among VLBWI.
In the future, other than major CP outcomes, preterm babies also have a high rate of minor neuromotor dysfunction and poor coordination without a diagnosis of CP.2526 Even extremely preterm infants with normal intelligence and no CP can present with gross and fine motor difficulties.27 It is also necessary to observe minor neurodevelopmental sequelae, such as cognitive deficits, academic under-achievements,28 attention deficit hyperactivity disorder and emotional troubles,2930 over the long-term that may increase the rate of disabilities and difficulties in VLBWI in early adulthood. It is also noteworthy that these difficulties may be apparent even in children without neurosensory impairment and a normal intelligence quotient (IQ); as previously reported by Saigal et al.,28 72% of adolescents with less than 750 g birthweight, 53% with a birthweight of 750–1,000 g, and 13% of normal birthweight controls had difficulties at school.
This study has a few limitations. Several factors contributed to a potential selection bias in our review. First, the mortality in the first years of life would lead to the exclusion of more severe cases that might reduce the incidence of adverse outcomes. Second, there is a possibility that the diagnosis of milder cases that were not referred to rehabilitation facilities may be excluded. Third, hidden disabilities subsequently become apparent later, and many infants might have important developmental lags that are not classified as impairments. Fourth, the standardization of Bayley edition either to be 2nd or 3rd edition should be chosen to be unified which will avoid any inter- or intra-variations. Lastly, the statistical analysis is based on the reports from 2013 and 2014 KNN annual reports which offered limitations of further analysis.
In summary, we described the prevalence of CP and neurosensory outcomes (hearing and eye impairments) along with other long-term health issues in a large national neonatal cohort in Korea. The strengths of this study include the large cohort size, standardization of the definitions of neonatal morbidities among different units, and organization of prospective data collection. Currently, KNN is following these VLBWI at corrected age of 36 months and the longer period of follow up may provide additional relationships with long-term outcomes and a better understanding of this disease process.
 XML Download