

 PDF
PDF ePub
ePub Citation
 Print
Print


INTRODUCTION
Prostate cancer (PCa) is one of the most common cancers affecting men [1]. It is the most frequently diagnosed malignancy and the 2nd most common cause of cancer-associated death in men worldwide [2]. With the high prevalence of this disease, the socioeconomic impact of PCa is also significant. Therefore, predicting the prognosis and understanding the etiology of PCa is of utmost importance. There have been several previous studies suggesting significant associations between lipid metabolism and PCa [345]. Snowdon et al. [3] reported that animal product consumption and obesity can be risk factors for aggressive PCa based on their retrospective analysis of 6,763 subjects with a 20-year follow-up period. Another study by Freedland et al. [4] also demonstrated a significant relationship between high obesity and worse postoperative biochemical recurrence (BCR)-free survival after analyzing the data of 1,106 subjects after radical prostatectomy. Moreover, a recent meta-analysis showed that there was a 21% increase in BCR rate, as well as 15% increase in PCa-specific mortality, with a 5 kg/m2 increase in body mass index (BMI) after radical prostatectomy [5]. Even though those clinical studies showed meaningful relationships between obesity and PCa, the exact mechanism underlying this phenomenon is still unknown.
In the present study, we investigated the expression of several metabolism-related genes, which have been previously reported to have important roles in lipid metabolism, in human adipose tissue collected from patients with localized PCa. We also aimed to reveal any possible relationships between the expression of those genes and postoperative prognosis after surgery.
MATERIALS AND METHODS
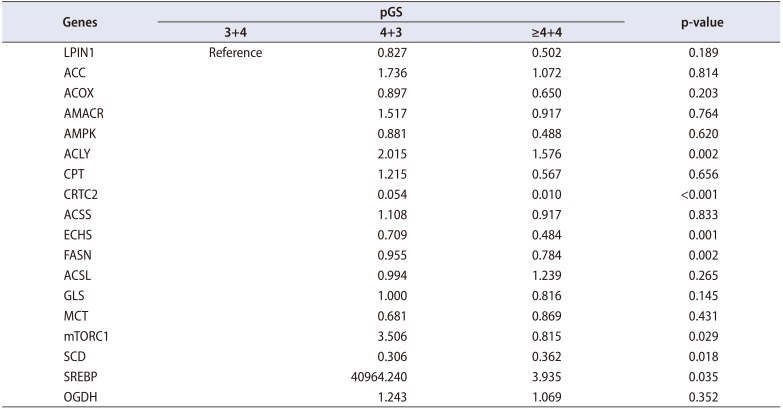
After gaining approval from the Institutional Review Board of Seoul National University Bundang Hospital (IRB No. B-1610-365-301), we prospectively enrolled 40 patients who were treated with radical prostatectomy for localized PCa in the single tertiary center of South Korea. After gaining consent from every patient, periprostatic adipose tissue was collected from the anterior fat pad of the prostate. Every radical prostatectomy was performed through a robotic approach. To compare the expression of metabolism-related genes according to the pathologic Gleason score (pGS), we divided the patients according to pGS. Patients with pGS ≥4+3 placed in the high pGS group (n=25) and the others were placed in the low pGS group (n=15). We selected and investigated 18 genes that have been previously reported to be involved in lipid metabolism (Table 1). The expression of each gene was compared between the high and low pGS groups. BCR was defined as the continuous elevation of prostate specific antigen (PSA) with a minimum of two consecutive tests. The routine postoperative follow-ups were taken every 3 months. Apart from serum PSA tests, regular pelvic imaging (magnetic resonance imaging) with bone scan was performed every 6 months.
1. RNA extraction and real-time polymerase chain reaction analysis
The obtained adipose tissue was immediately stored in RNAlater solution (Ambion, Austin, TX, USA) at −80℃. Then, RNA was extracted from adipose tissue using the RNeasy lipid tissue mini kit (Qiagen, Valencia, CA, USA). Subsequently, cDNA was synthesized from 1 µg of RNA using Omniscript RT kit (Qiagen) according to the manufacturer's instruction. Real-time polymerase chain reaction (PCR) was performed using 18 gene-specific primers with the Power SYBR Green PCR Master Mix (Applied Biosystems, Warrington, UK) and the 7500 real-time PCR system (Applied Biosystems, Foster City, CA, USA). Primer sequences are listed in Table 1. All experiments were performed in triplicate.
2. Statistical analyses
Continuous variables were compared between two different groups using independent t-tests. The chi-square tests were utilized to identify the differences of the categorical variables between the groups. Multivariate Cox-proportional analyses were performed to identify the independent predictors of BCR-free survival after surgery. All statistical analyses were performed using IBM SPSS software package ver. 19.0 (IBM Co., Armonk, NY, USA). The p-values are presented as two-sided values and p<0.05 was considered statistically significant.
RESULTS
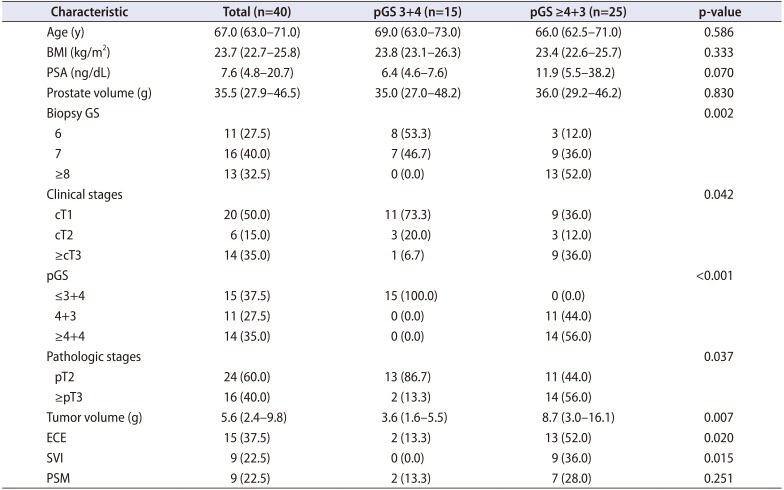
The overall preoperative and postoperative characteristics of the patients are summarized in Table 2. The median age of entire patients was 67.0 years (interquartile range [IQR], 63.0–71.0 years) and median PSA was 7.6 ng/dL (IQR, 4.8–20.7 ng/dL). There were 11 patients (27.5%) with biopsy Gleason score 6, but all patients were eventually upgraded to Gleason 7 (3+4) from pathologic evaluations of prostatectomy specimens. When we stratified the entire cohort into two groups according to pGS, there were 25 patients in the high pGS group (≥4+3) and 15 patients in the low pGS group (3+4), respectively. The high pGS group also showed significantly worse pathologic outcomes in terms of rate of extracapsular extension (p=0.020), seminal vesicle invasion (p=0.015), and volume of tumor (p=0.007).
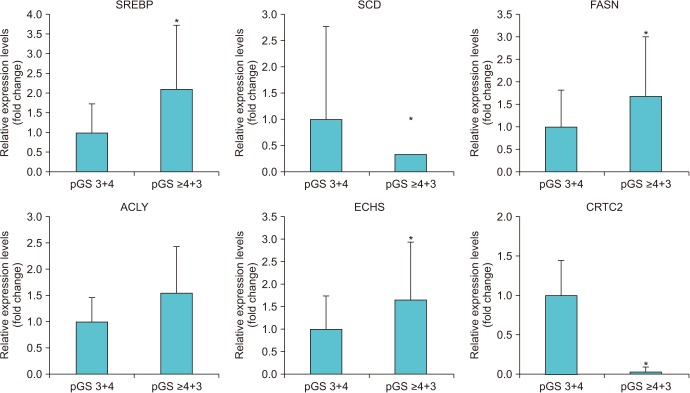
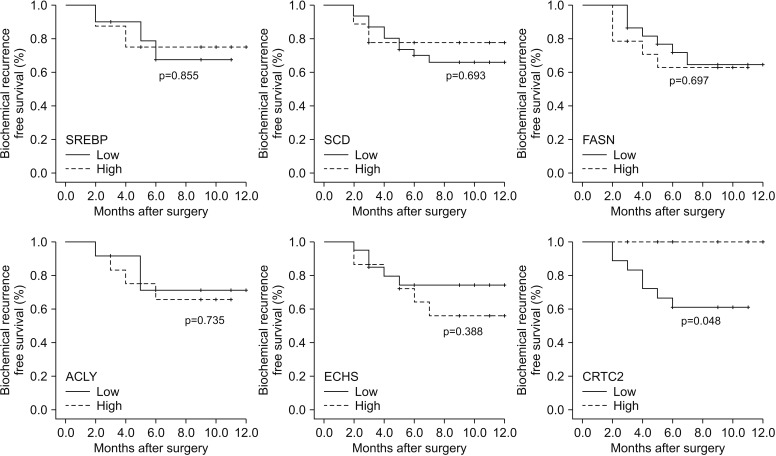
When we compared the expression of 18 genes between the high and low pGS groups, there were significant differences in 6 genes (SREBP, p=0.035; SCD, p=0.018; FASN, p=0.002; ACLY, p=0.002; ECHS, p=0.001; and CRTC2, p<0.001) (Table 2, Fig. 1). The high pGS group showed significantly higher expression of SREBP, FASN, ACLY, and ECHS, and low expression of SCD and CRTC2. When we subdivided the patients according to the level of expression for each gene, patients with low expression for CRTC2 showed significantly worse pathologic outcomes: high pGS (≥4+3) (p=0.020) and higher rate of seminal vesicle invasion (p=0.017). Finally, the patients with low expression of CRTC2 showed superior BCR-free survival after surgery (p=0.048) (Fig. 2). However, there were no significant differences in BCR-free survival for the other genes tested (p>0.05).
DISCUSSION
In the present study, we investigated the expression of several metabolism-associated genes in adipose tissue samples of patients with localized PCa. We observed significant differences in the expression levels of six genes according to the patients' pGS. The patients with high expression of CRTC2 showed significantly lower rates of seminal vesicle invasion and lower pGS than the patients with low expression of CRTC2. Finally, the patients with high CRTC2 expression showed significantly longer postoperative BCRfree survival than the patients with low expression of CRTC2. To the best of our knowledge, the present study is the first to report a significant association between CRTC2 expression and PCa prognosis.
The association between lipid metabolism and PCa has been continuously suggested in previous studies. There have been three meta-analyses that investigated the relationships between obesity and PCa [56]. MacInnis and English [5] showed a significant positive linear association between the incidence of PCa and increased BMI (relative risk [RR], 1.05; 95% confidence interval [CI], 1.01–1.08; p=0.006; per 5 kg/m2 increment) after analyzing 55,521 cases from 31 cohort studies. Another study by Bergström et al. [6] found similar findings between obesity and increased incidence of PCa. The overweight population had a 6% higher risk of having PCa than the normal weight population in their study. Apart from the high incidence of PCa in the obese population, poor postoperative outcomes were also reported after surgical treatment of PCa. Cao and Ma [7] analyzed six studies that included over 1.2 million subjects and concluded that there were a 15% increased risk of dying from PCa and a 21% higher risk for BCR per 5 kg/m2 increase in BMI. Another study also showed significant association between obesity and worse pathological outcomes including surgical margin status [8]. Freedland et al. [8] analyzed a large cohort with 7,027 subjects treated by retropubic radical prostatectomy and found that the BMI was significantly associated with positive margin rate. Compared to normal weight patients, the patients with mild obesity showed 42% increased risk of positive margin rate (hazard ratio [HR], 1.42; 95% CI, 1.02–1.98) and the patients with moderate to severe obesity showed 97% increased risk of positive margin (HR, 1.97; 95% CI, 1.05–3.71). Obesity also showed significantly worse clinical outcomes after radiation therapy in patients with PCa [9]. Wang et al. [9] reviewed the medical records of 1,442 patients treated with dose-escalated radiotherapy and found that increase in BMI was significantly associated with increased risk for BCR (HR, 1.03; 95% CI, 1.00–1.07; p=0.042), as well as cancer-specific (HR, 1.15; 95% CI, 1.07–1.23; p<0.001) and overall mortality (HR, 1.05; 95% CI, 1.02–1.08; p=0.004), when BMI was analyzed as a continuous variable.
There have been some hypotheses for explaining these associations between obesity and PCa [10]. The first involves insulin and/or insulin-like growth factor (IGF); PCa cells are known to highly express insulin receptors, which suggests that insulin may enhance PCa progression and development [11]. Another study by Lee et al. [12] showed that elevated hemoglobin A1c level was related with worse survival outcomes after radical prostatectomy. Moreover, elevated IGF-1 was associated with increased incidence of PCa in several meta-analyses [1314]. However, the exact mechanisms underlying these clinical findings are still unclear. Another theory for explaining the relationship between obesity and PCa involves the decreased androgen production in obese people [15]. Schnoeller et al. [16] analyzed a relatively small cohort of 137 patients treated with radical prostatectomy and found that the preoperative free testosterone level was inversely associated with worse pathologic outcomes. From their study, low testosterone level was connected to aggressive PCa. On the other hand, Lee et al. [17] insisted that the preoperative level of serum sex hormone-binding globulin level is an independent predictor for postoperative pathologic outcomes in terms of extraprostatic extension (HR, 1.342; 95% CI, 1.010–1.798; p=0.039). Subsequently, the Prostate Cancer Collaborative Group analyzed about 10,000 subjects and concluded that there was no significant relationship between the sex hormone and risk of PCa [18]. However, they found a moderate association between sex hormone-binding globulin level and the risk of having PCa (RR, 0.86; 95% CI, 0.75–0.98; p=0.010). Unfortunately, these relationships linking low androgen levels, obesity, and PCa are still unclear.
The CRTC2 gene is known as a cAMP response element binding protein (CREB) co-activator and is abundant in the liver [19]. The CREB pathway is activated under fasting condition and stimulates glucose production from stored glycogen in the liver. A previous study investigated CRTC2 knockout mice and found that CRTC2-deficient mice showed decreased serum glucose level during fasting and increased insulin sensitivity [20]. They concluded that CRTC2 is linked to insulin resistance, as well as to hepatic gluconeogenesis. However, studies focused on the relationship between CRTC2 and the development of malignancies are still scarce in number. Fang et al. [21] previously analyzed the impact of the CRTC2 gene in patients with lymphoma and found that CRTC2 is a tumor suppressor gene that preserves genomic integrity by stimulating DNA mismatch repair genes. Malaguarnera et al. [22] tried to evaluate the effect of metformin in LNCaP PCa cells and found that silencing CRTC2 resulted in decreased IGF-I receptor promoter activity. They concluded that metformin inhibits the upregulation of IGF-I receptor expression and may be useful to prevent the intracellular androgen production by PCa cells. As this study is the only one so far to directly associate CRTC2 and PCa, it is difficult to make a solid conclusion. However, we found that low CRTC2 level correlated with worse pathologic outcomes and significantly shorter BCR-free survival in the present study. Furthermore, CRTC2 expression was revealed as a significant independent predictor for postoperative BCR through multivariate Cox proportional analysis. Therefore, it is possible that CRTC2 acts as a tumor suppressor gene in PCa. Another study by Khan and Frigo [23] reviewed about role of 5-AMP-activated protein kinase (AMPK) in PCa. They emphasized the role of AMPK as a master regulator of metabolism and its possible numerous association beyond metabolism. They also mentioned about the role of CRTC2 as co-regulator of AMPK in the nucleus of each cell. Unfortunately, the current evidences about the CRTC2 upon cellular metabolism and its association with cancer cell developments are quite limited and it is hard to reach any sudden conclusion regarding this subject. Therefore further studies are needed for better understanding about the roles of CRTC2 in PCa.
Our study has certain limitations; the number of subjects was not large enough to draw further meaningful results on other metabolism-related genes. Furthermore, the follow-up times were relatively short compared to other major radical prostatectomy cohorts.
CONCLUSIONS
The patients with high Gleason score showed significantly higher expression of six genes (SREBP, SCD, FASN, ACLY, ECHS, and CRTC2) compared with patients with low Gleason score. Among those genes, CRTC2 showed significant association with pathologic outcomes, as well as with postoperative BCR-free survival.
 XML Download