

 PDF
PDF Citation
 Print
Print


Abbreviations
APC
allophycocyanin
cLN
cervical lymph node
Foxp3+
forkhead box P3
GC
germinal center
LN
lymph node
M3R
muscarinic receptor type 3
RA
rheumatoid arthritis
SAN
sanroque
SLE
systemic lupus erythematosus
SS
Sjögren's syndrome
SSA
Sjögren's syndrome-related Ag A
SSB
Sjögren's syndrome-related-related Ag B
Tfh
follicular helper T
Tfr
follicular regulatory T
WT
wildtype
INTRODUCTION
Sjögren's syndrome (SS) is a chronic autoimmune disorder that is primarily characterized by lymphocytic infiltration into exocrine tissues such as salivary and lacrimal glands (1,2). Such epithelitis causes dysfunction of the glands and leads to sicca symptoms including dry mouth (xerostomia) and dry eyes (xerophthalmia). Numerous extra-glandular sites, such as lungs, skin, and thyroid, are also implicated. The primary form of SS involves disorders of the above organs without additional diseases. The secondary form is more common, and occurs in association with other rheumatic autoimmune diseases, such as rheumatoid arthritis (RA) and systemic lupus erythematosus (SLE or lupus) (3). In clinical studies, the prevalence of secondary SS among patients with SLE varied from 8% to 30% (4,5). Coexistence of SLE and SS appears to lead to a poor prognosis, since such patients suffered more often from peripheral vascular, renal, and musculoskeletal damage than those with SLE alone (6).
Although SS is second only to RA in prevalence among systemic autoimmune diseases (7), its pathogenesis is largely unknown. Since SLE is accompanied by SS in a substantial proportion of patients, SS and SLE may share some causal factors. An abundance of anti-nuclear Abs, especially IgG Ab to dsDNA, is a diagnostic feature of SLE (8). These autoantibodies are deposited in tissues as immune complexes, causing inflammation and end organ damage in skin, kidneys and more. It is widely accepted that long-lasting plasma cells producing high affinity, class-switched autoantibodies are mainly produced in germinal centers (GCs) inside the follicles of secondary lymphoid organs (9). The GC reaction is instructed by a specialized subset of CD4+ T cells, named follicular helper T (Tfh) cells (10). In this regard, Tfh cell-driven humoral immunity seems to be the main driver of SLE development. Like SLE, SS is also associated with an abundance of IgG autoantibodies, such as anti-SS-related Ag A (SSA)/Ro, anti-SS-related Ag B (SSB)/La, and anti-muscarinic receptor type 3 (M3R) Abs (11). Because M3R expression is restricted to exocrine gland tissues, anti-M3R Abs are thought to be specific for SS, while anti-SSA/Ro and anti-SSB/La Abs are also found in the sera of SLE patients (12). These findings suggest a pathogenic role of Tfh cell-driven Ab responses in the development of SS as well. This hypothesis is further supported by the fact that the frequency of circulating Tfh cells is increased in patients with primary SS (13) and that salivary gland epithelial cells from patients with SS promote the differentiation of Tfh cells (7). Nevertheless, whether dysregulation of Tfh cells is sufficient to trigger the development of SS remains uncertain.
In mice, the pathogenic role of Tfh cells in SLE occurring in a lupus-prone strain named sanroque (SAN) is well established. SAN mice are homozygous for the M199R “san” allele in the Roquin gene (Roquinsan/san), which encodes a member of the RING-type ubiquitin ligase family (14). As a consequence of overexpression of inducible T-cell costimulatory on T cells, SAN mice spontaneously develop excess Tfh cells with more numerous GCs than their wildtype (WT) littermates (15). High affinity anti-nuclear IgG autoantibodies can be detected in female SAN mice as early as the preclinical phase, and their appearance is followed by renal pathology typical of lupus. However, it is not known whether the autoimmunity occurring in SAN mice also affects exocrine glands and drives SS pathology.
This study was undertaken to determine whether hyper-activation of Tfh cells is sufficient to precipitate SS. To this end, we used SAN mice, and found that secondary SS-like manifestations occur spontaneously in aged SAN mice. Thus, our results provide evidence for a pathogenic role of Tfh cells in the development of SS and we propose SAN mice as a model of the coexistence of secondary SS and SLE.
MATERIALS AND METHODS
Mice
Heterozygotes for the M199R allele in the Roquin gene (Roquinsan/+) on a C57BL/6 background (14) were purchased from Mutant Mouse Regional Resource Center, University of California at Davis. They were bred to generate homozygous SAN (Roquinsan/san) mice in a specific pathogen-free barrier facility at Hanyang University. Female SAN mice and their WT littermates at 20–45 wk of age were used. This study was approved by the Institutional Animal Care and Use Committee (HY-IACUC-2016-0064 and HY-IACUC-2017-0198). All animal experiments were carried out in strict accordance with guidelines and regulations.
Saliva measurement
Mice were anesthetized and injected intraperitoneally with pilocarpine (Sigma-Aldrich, St. Louis, MO, USA) at a dose of 5 mg/kg body weight to induce saliva secretion. One min after injection, saliva was collected from the oral cavity for 5 min.
Histopathologic examination
Salivary glands and kidneys were fixed, embedded in paraffin and sectioned at 8 and 3 μm, respectively, as described previously (16). The tissue sections were stained with periodic acid-Schiff (Sigma-Aldrich) for kidneys, and with H&E (Sigma-Aldrich) for salivary glands. Histopathologic indexes were enumerated as described previously (17,18). In some experiments, tissue sections were stained with anti-mouse IgG-biotin (Sigma-Aldrich), followed by standard immunohistochemical methods, as described (19). Hematoxylin was used for counter staining.
FACS analysis
Spleen and cervical lymph node (cLN) cells from 35–40-wk-old mice were analyzed by FACS, as previously described (20). The following mAbs and reagents were purchased from BD Biosciences (San Jose, CA, USA) or eBioscience (San Diego, CA, USA): anti-CD4-PerCP, anti-Bcl6-FITC, anti-CXCR5-biotin, streptavidin-allophycocyanin (APC), anti-CD44-APC-Cy7, anti-GL7-FITC, anti-Fas-PE, anti-B220-PerCP, and anti-CD138-APC.
ELISA
Sera were collected from SAN mice and their WT littermates and assayed by ELISA to measure autoantibodies. The titers of anti-dsDNA and anti-M3R Abs were determined as described previously (16,21). Peptides encoding the murine M3R extracellular domain (VLVNTFCDSCIPKTYWNLGY) were synthesized by Peptron (Daejeon, Korea) and used at 10 μg/ml. Titers of total-IgG, anti-SSA/Ro and anti-SSB/La Abs were measured using Mouse Total IgG ELISA kit, Mouse Anti-SSA Total Ig kit, Mouse Anti-SSB Total Ig kit (all from Alpha Diagnostic International, San Antonio, TX, USA), respectively. To prepare salivary gland extracts, salivary glands were homogenized in PBS with protease inhibitors and spun down at 12,000 g for 30 min at 4oC to collect supernatants. The salivary gland extracts were coated at 5 μg/ml onto the plates and standard ELISA methods were followed. A mouse serum containing the highest titer of autoantibodies was serially diluted and used as a standard.
ELISPOT assay
Ab-secreting cells were enumerated by standard ELISPOT methods, as described previously (22) with modifications. In brief, PVDF membrane filter plates (Merck Millipore, Burlington, MA, USA) were activated with 75% ethanol for 2 min and coated with appropriate Ags as in the above ELISA methods. Aliquots of cell suspensions from spleens and cLNs were added to the wells and incubated overnight at 37°C, followed by sequential incubation with biotinylated anti-mouse IgG mAb (Sigma-Aldrich) and alkaline phosphatase-conjugated streptavidin (Sigma-Aldrich). After adding NBT-BCIP (Mabtech AB, Nacka Strand, Sweden), spot numbers were counted using an iSpot Reader System (AID, Strassberg, Germany). Data are presented as numbers of Ab-secreting cells per 105 cells with background subtracted.
RESULTS AND DISCUSSION
SAN mice exhibit manifestations of sialadenitis after the onset of lupus nephritis
SAN mice have been shown to spontaneously develop lupus-like symptoms in their kidneys with a variable time of onset depending on genetic background, sex, and environmental conditions (14,15). When we looked for lupus-like features in female SAN mice bred in our animal facility we found that all nephritic indexes, such as hypercellularity score, proportion of proliferating glomeruli, and lymphocytic infiltration, were significantly higher in the SAN mice than their WT littermates (Fig. 1A and B). This histopathology was evident by about 20 wk after birth (not shown) and was sustained until 40 wk after birth (Fig. 1A and B). Consistent with this, the kidneys (mostly the glomeruli) of SAN mice stained strongly with anti-IgG mAbs, indicative of IgG deposition, whereas those of their WT counterparts did not (Fig. 1C). These data confirm that SAN mice are bona fide mouse models of human lupus.
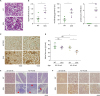 | Figure 1Clinical and histopathologic manifestations akin to lupus nephritis and SS in SAN mice. Female SAN mice and their WT littermates at 40–45 wk (A, B), 20 wk (C), and the indicated wk (D-F) of age were examined by clinical and histopathologic methods. (A) Kidney sections stained with periodic acid-Schiff. (B) Histopathologic indexes. (C) Immunohistochemical images of kidney sections stained with anti-mouse IgG mAb. (D) Saliva flow rates. (E) Salivary gland sections stained with H&E. Arrows indicate foci of lymphoid infiltrates. (F) Immunohistochemical images of salivary gland sections stained with anti-mouse IgG mAb. Photographs are representative of more than three individuals. Graphs display means±SEMs with symbols representing the values of individual mice.HETERO, heterozygote; NS, not significant.
*The p<0.05 by Student's t-test.
|
To determine whether the mechanisms leading to autoimmune defects in SAN mice also generate a disorder akin to SS, we carried out clinical and histopathologic examinations of the salivary glands. We found a significantly reduced rate of saliva flow in female SAN mice at 40–45 wk of age, indicative of dysfunction of the salivary glands (Fig. 1D). Moreover, salivary gland tissues from SAN mice, but not those from WT controls, contained foci composed of lymphocytic infiltrates as well as IgG deposits (Fig. 1E and F). Importantly, the histopathologic manifestations were not yet seen in the mice at the onset of lupus (about 20 wk) or even at the time of full-blown lupus (about 30 wk), while the extent of IgG deposits was slightly enhanced.
Taken together, these results demonstrate that SAN mice develop a secondary SS-like disorder. Given that the primary phenotype of SAN mice, this suggests that chronic over-activation of Tfh cells is sufficient to precipitate sialadenitis, leading to dysfunction of salivary glands. Interestingly, we found that the onset of SS is delayed by about 20 wk with respect to the onset of lupus. This leads us to speculate that factors other than Tfh cell-driven autoimmunity play a role in controlling when damage occurs to the salivary glands. Little is known about these factors, but it is likely that sex hormones whose concentrations vary with age are involved, and that the 2 diseases have different susceptibilities to these hormones. For example, estrogens have been shown to play pathogenic and protective roles in the pathogenesis of SLE and SS, respectively, in animal models (23-25). Clinical studies revealing that SLE and SS are common at childbearing age and in perimenopausal period, respectively (2,26) are in agreement with our results and further support the hypothesis.
The production of autoantibodies targeting salivary glands is enhanced in SAN mice from the preclinical phase
Since elevated titers of serum IgG autoantibodies are a hallmark of systemic autoimmune diseases and we have found IgG deposits in target tissues, we measured levels of autoantibodies specific for SLE (anti-dsDNA) and SS (anti-M3R) and of autoantibodies common to both diseases (anti-SSA/Ro and anti-SSB/La). We found that the serum titers of IgG-switched Abs to dsDNA and M3R, whole Abs to SSA/Ro and SSB/La, and whole IgG were significantly elevated in female SAN mice of 40–45 wk of age (Fig. 2A). IgG Abs reactive to salivary gland were also significantly more abundant in SAN mice. The increases in anti-M3R IgG as well as anti-dsDNA IgG were already prominent at 20 wk of age, the preclinical phase for SS, and were sustained until 30–35 wk of age (Fig. 2B). Cells secreting IgG Abs to M3R and salivary gland extracts were about 2-fold and 3–4-fold more numerous in the spleens and cLNs of SAN mice, respectively, than in those of WT counterparts (Fig. 2C). Anti-dsDNA IgG-secreting cells also showed similar trends, though lacking statistical significance.
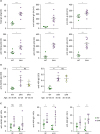 | Figure. 2The spectrum of autoantibodies and frequencies of autoantibody-secreting cells in SAN mice. (A, B) Sera were collected from mice at 40–45 wk of age (A) and at the indicated ages (B), and assayed by ELISA. (C) ASCs in spleen and cervical LNs from 30–35-wk-old mice were counted in ELISPOT assays. Each symbol represents individual mice and horizontal lines display mean±SEM of each group.AU, arbitrary units; ASC, Ab-secreting cell; NS, not significant; SGE, salivary gland extracts; Sp, spleen.
*The p<0.05, **p<0.01 and ***p<0.001 by Student's t-test.
|
These results together demonstrate that the lymph nodes (LNs) draining salivary glands are more active than spleens in producing autoantibodies targeting salivary glands prior to the emergence of tissue damage. Despite the later onset of sialadenitis compared to glomerulonephritis, signature autoantibodies for SS and for SLE are produced concurrently and with similar kinetics. Thus, the later onset of SS may not be due to delayed production of autoantibodies targeting salivary glands. Instead, protective mechanisms may exist that renders the salivary glands less vulnerable to damage by autoantibody-mediated inflammatory responses.
Our finding that SAN mice contain high titers of autoantibodies reactive to salivary gland extracts is intriguing, and may point to a perturbation of glandular homeostasis and breakdown of self-tolerance against glandular tissues. These two pathogenic events may form a positive feedback loop that amplifies destructive autoimmune processes. It is also worth noting that, unique among Abs specific for salivary glands, anti-M3R Ab has been shown to act as an antagonist to M3R in inhibiting acetylcholine signals, so reducing salivary secretion in addition to mediating inflammation (27). Therefore, the elevated anti-M3R Ab in SAN mice seems to play an important role in the development of the SS-like disorder.
The salivary gland-draining LNs in SAN mice contain elevated numbers of Tfh cells and their downstream effector cells
We hypothesized that in SAN mice an initial perturbation of glandular homeostasis causes autoantigens to be released from salivary gland tissue and to drain to adjacent LNs in which a Tfh cell-driven GC reaction takes place. We tested this idea by examining the cellular content of cLNs. As expected, CXCR5+Bcl6+ Tfh cells were more numerous in the cLNs of SAN mice than in those of WT mice (Fig. 3A). In agreement with this, the proportions and numbers of GL7+Fas+ GC B cells and B220−CD138+ plasma cells were significantly elevated in the cLNs of SAN mice (Fig. 3B and C). These effects were also seen in their spleens and mesenteric LNs but were less pronounced (Fig. 3A and Supplementary Fig. 1), suggesting that the sialadenitis seen in aged SAN mice is due to enhanced GC responses occurring predominantly in salivary gland-draining LNs. Intriguingly, LNs pooled out from axillary, inguinal and popliteal sites contained Tfh cells at the level comparable to cLNs (Supplementary Fig. 1). We suspect that this is due to axillary LNs that are involved in the immune network for sialadenitis as well. We also cannot rule out the possibility that paw joints are sites susceptible to the immune attack associated with SAN phenotypes.
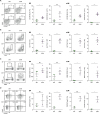 | Figure. 3FACS profiles of humoral immune cells associated with GC in SAN mice. Humoral immune cells in SAN mice and their WT littermates at 30–35 wk of age were assayed post mortem by FACS. Representative FACS profiles gated on CD4+CD44high cells (A), B220+ cells (B), viable lymphocytes (C) and CD4+ cells (D) are shown in the left panels. Graphs displaying percentages or cell numbers are presented in the right panels. All data are representative of more than 3 independent experiments.NS, not significant; Sp, spleen.
*The p<0.05, **p<0.01, and ***p<0.001 by Student's t-test.
|
Enhanced GC responses including differentiation of GC B cells and plasma cells could be influenced by follicular regulatory T (Tfr) cells, a subset of forkhead box P3 (Foxp3+) Tregs residing in GCs and expressing CXCR5 and Bcl6, given that a lack of Tfr cells led to greater GC responses (28). To address this possibility, we detected CD4+CXCR5+Foxp3+ Tfr cells in SAN mice and found that the proportion and number of Tfr cells were not decreased in spleens and cLNs from SAN mice when compared with those from WT mice (Fig. 3D). This suggests that Tfr cells may not be dysregulated in a way that has been previously appreciated to cause GC activation. Although there were previous studies showing elevated number of whole Treg cells (CD4+Foxp3+ cells) in 8–10-wk-old SAN mice (29,30), it is worth noting that our data reveal for the first time the irrelevance of SAN's SS-like pathogenesis with the Tfr subset that is actually functional inside the follicle.
In summary, we provide clear evidence for the spontaneous development of secondary SS in SAN mice. Humoral autoimmunity driven by hyperactivated Tfh cells in salivary gland-draining LNs appears to be responsible for this previously unappreciated phenotype. Thus, our findings suggest that chronically dysregulated activity of Tfh cells is sufficient to induce the delayed development of secondary SS in lupus-prone mice.
 XML Download