Journal List > Korean J Adult Nurs > v.31(1) > 1116869

Kwon, Kim, and Seo: Systematic Review on the Relationship between Depressive Symptoms and Activities of Daily Living in Cognitively Intact Older Adults

Abstract

Purpose

The purpose of this study was to examine the direction and strength of the relationships between depressive symptoms and Activities of Daily Living (ADLs) among older, cognitively intact adults as reported in observational studies.

Methods

A systematic review and meta-analysis were conducted to search the existing published observational studies in five electronic databases. PubMed, EMBASE, PsycINFO, the Cochrane library, CINAHL, and Medline were used from June 2005 to June 2015. The search strategies all used MeSH terms. Studies reporting r-values between depressive symptoms and the ADLs of older adults were included in the meta-analysis. Overall effect size was computed, and subgroup/moderation analysis was then performed.

Results

16 studies involving 7,184 older adults were identified, and no publication bias was found. The overall effect size was moderate, with a value of −.28. The strength of the effect size was moderated by sample residence type.

Conclusion

From the meta-analysis results, it was concluded that the strength of the relationship between depressive symptoms and ADLs was significant. The relationship showed a negative direction in all included studies. Therefore, various nursing intervention programs should be developed to increase the ADL related to depression according to the cognitive status and the residence status of the elderly by nurses.

INTRODUCTION

Depression is a major public health concern that not only leads to personal sufferings but also a national economic burden, as it is related to increased morbidity and mortality. In particular, late-life depressive symptoms are the most prevalent mental health issue affecting older adults [1]. The prevalence of major depressive disorder among older adults in Korea is 5.4~7.5%, which is overall higher than the 3.3~5.6% in adults [2]. In 2017, the number of patients treated for depression in Korea was 667,720, and the total cost of this medical treatment was 255,142 million won [3]. The wide range of prevalence rates of depression may be due to differences in functional dependence, level of cognitive function, and living situations of research subjects [45]. In previous studies, Activities of Daily Living (ADLs) have been interconnected with depressive symptoms and cognitive status in older adults [167]. However, recent studies have insisted that depressive symptoms and cognitive status are independently linked with ADLs, particularly in cases where older adults live independently in their own homes [89].
In reviewing the literature, the strength of the association between ADLs and depressive symptoms differed across the studies depending on several factors such as type of residence, physical activities, and ethnic background. First, the correlation between depressive symptoms and ADLs of older adults living at home was found to be weak compared to the strength of the correlation in case of institutionalized older adults; cognitive status might not contribute to the difference in the strength of the correlation between these two groups of older individuals [10]. Second, physical activities seem to mediate the magnitude of the relationship between depression and ADLs through the beneficial preventive effects on cognitive functioning and associated illnesses [11]. Lastly, few studies have studied the effects of depression separately on levels of ADLs in ethnically diverse populations. While depressive symptoms can be perceived differently based on different ethnic backgrounds [12], the relationship between depressive symptoms and the level of ability to complete ADLs might be different. For example, research in South Asian and African-American populations revealed significant negative correlations between depressive symptoms and daily routines [1314]; however, the magnitude was lower in the South Asian sample [1314]. For this reason, answering the question about a relationship between depressive symptoms and ADLs of older adults of various ethnic and cultural backgrounds may help provide more information about this complex relationship. From a research perspective, this information is required to accurately estimate the sample size for studies targeting individuals with potential risk factors (e.g., living facility type, ADL type, age, and ethnic background). Methodological heterogeneity also needs to be considered as a measurement tool to reach a better understanding of the association between late-life depressive symptoms and ADLs [15].
This study examined the relationship between ADLs and depression among community-dwelling older adults through a Systematic Review (SR) and Meta-Analysis (MA). We synthesized the obtained information to calculate the strength of the relationship. Moreover, we assessed the extent to which this relationship is affected by various factors of interest, such as sample and study characteristics. The specific objectives were 1) to identify the study characteristics; 2) to estimate the publication bias of included studies by examining the funnel plot; 3) to assess the methodological quality level of each included study using the appraisal tool for descriptive correlational study design; 4) to estimate the overall effect size for the relationship between ADLs and depressive symptoms; 5) to perform the subgroup analysis that calculate the effect size between studies that has been clearly excluded the cognitively impaired individuals (controlled) and studies that have been unclearly reported the cognitive impaired (un-controlled); and 6) to explore the moderators.

METHODS

1. Study Design

The present study consisted of a SR and MA to integrate and analyze studies on the relationship between depression and ADLs.

2. Data Sources and Review Strategy

Published and unpublished studies measuring the direction and strength of the relationship between depressive symptoms and ADLs-including instrumental ADLs (IADLs)-were independently extracted by the researchers, who were trained in literature search through a professional program.
Several electronic databases, such as PubMed, EMBASE, PsycINFO, the Cochrane library, CINAHL, and Medline, were used. MeSH terms such as “Aged” [Mesh] OR “Aging” [Mesh] OR “Housing for the Older adults” [Mesh], “Depressive symptoms” [Mesh] OR “Depressive Disorder” [Mesh] AND “Activities of Daily Living”[Mesh] were used to retrieve relevant articles published from June 2005 to June 2015. The Google Scholar search engine was used to locate additional studies that were not listed within the databases mentioned above.

3. Inclusion and Exclusion Criteria

The inclusion criteria of this study were: a) articles written in English; b) older adult study participants; c) data reporting the direction and strength of the relationship between depressive symptoms and ADLs; and d) a descriptive correlational study design. The scope of primary studies could be limited when applying specific criteria such as study design for synthesizing findings from each primary study [16]. Guided by prior research [16], we included the studies that reported the correlation values between depressive symptoms and ADLs.
However, studies were excluded if they: a) reported no information for calculating correlation values between depressive symptoms and ADLs; b) were designed as experimental, qualitative, or review studies; and/or c) were published prior to June 2005. Moreover, we excluded studies wherein the older adult subjects had major mental or physical disabilities (e.g., cognitive disabilities, paresthesia, major depressive symptoms, or diagnosed depression, etc.), or who were hospitalized in acute care settings.

4. Publication Bias

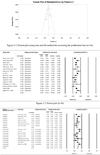
In order to estimate publication bias, two procedures were used to assess whether the studies were skewed due to the selective nature of the inclusion criteria [17]. First, we created a funnel plot using Duval and Tweedie's trim and fill method and discovered an approximately symmetrical and null-trimmed study. The asymmetry of the funnel plot suggests that studies reporting a negative relationship between two variables may not have been published. Second, we also used Egger's regression intercept to determine publication bias. This statistical method uses a funnel plot to test whether the effect sizes depend on the sample size for the individual study [18]; for example, whether studies with smaller sample sizes may have had the tendency to report larger effect sizes. In the absence of bias, the p-value of Egger's regression intercept will exceed .050, and there will be a zero-value intercept. In this MA, the observed p-value (two-tailed) was .550, and the intercept was −.560 (95% Confidence Interval [CI]= −2.47~1.35). In other words, no significant bias was observed in the included studies.

5. The Process of Data Coding and Quality Assessment

Several steps were followed for data coding and extraction. Two researchers independently searched electronic databases; the identified studies were then classified into inclusion or exclusion groups according to the above-mentioned criteria. Included studies were independently coded by two researchers according to a coding manual that required the cataloging of the authors; the publication year; study design; sample size; general information about the participants (age, gender, etc.); ethnic composition of the sample; measurement tools; and the main results (correlation values). If inter-coder differences existed, a third researcher (the principal investigator) rechecked and resolved them in a research meeting with all researchers before data entry.
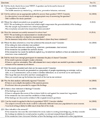
The methodological quality of the included studies was assessed using a cross-sectional appraisal tool consisting of 11 questions [19]. These were adapted from users' guides to the medical literature that were provided and “How to use an article about therapy or prevention”[19]. The 11 items had the potential to screen whether or how the studies could: a) address clear issues, b) use proper methodology, c) conduct acceptable subject recruiting methods, d) measure accurately, e) justify data collection, f) recruit sufficient numbers of participants, g) report the results, h) analyze the data sufficiently, i) state the findings clearly, j) apply their findings to the local population, and k) contribute to the existing knowledge. Responses to the questions were recorded as “yes”, “no”, or “cannot tell”.

6. Ethical Consideration

This study was approved by the Chungnam National University Institutional Review Board (IRB No.2-1046881-A-N-01-201607-HR-028-09-03).

7. Data Synthesis and Statistical Analysis

This study's effect size correlation was calculated using Fisher's Z transformation: Z=.5×log ((1×r)/(1−r)), and variance was set as V=1/(N−3) using the Comprehensive Meta-Analysis 3.0 software program. The effects measured as r≤.10, r=.30, and r≥.50 are small, medium, and large, respectively. These cutoffs are similar to those commonly used in descriptive correlational study design [20].
The homogeneity test examined the estimation of the overall effect size by calculating the Q statistic and quantified the degree of effect size dispersion using an I2 index. Values of p>.050 for the obtained Q statistics indicated that the included studies were homogeneous [21].
Moreover, I2 values function as percentages of total variance in a set of effect sizes in cases of true heterogeneity [22]. Values of around 25% (I2=25), 50% (I2=50), and 75% (I2=75) indicate low, medium, and high heterogeneity, respectively [18]. If the Q statistics and I2 values require rejecting the homogeneity assumption, a random-effects model can be applied. The random-effects model allows for generalization to a larger population [1623]. However, if the included studies are homogeneous, MA can measure the overall effect size using the fixed-effects model [24], since this permits generalization to the study sample [1623]. For the overall effect in this study, the random-effects model was used because the heterogeneity test was statistically significant. For the subgroup analysis and moderating effects, we further examined the effect size according the potential moderators. Furthermore, the effect size variance can be inferred due to the fixed moderator and random effects; therefore, we chose a mixed-effect model for this study. This model is preferred to a fixed-effects model, which hypothesizes that moderators and sampling errors contribute to effect size variability. In this MA, the unit of analysis is a study with a total estimated effect size, while the unit of moderator analysis is effect size [25]. In observational studies, it can be understood that effects of r ≤.10, r=.30, and r≥.50 are small, medium, and large, respectively [25].

RESULTS

1. Study Characteristics

A total of 11,840 studies were initially found through the systematic search. After excluding the duplicated and irrelevant articles, the abstracts and full text of the remaining 307 articles were reviewed. Of these studies, 291 did not report the direction or strength of the relationship between ADLs and depressive symptoms among older adults. In all, 16 studies that reported the correlation values were included in the MA. The search strategy is shown in detail in Figure 1.
A total of 7,184 older adults participated in 16 studies, with sample sizes ranging from 44 to 1,308. Among the 16 studies, three were designed as longitudinal surveys [A3, A6, A16] and the design of remaining studies was crosssectional [A1, A2, A4, A5, A7-15]. Six studies consisted of individuals from Asian countries such as Taiwan, South Korea, Philippines, and Japan [A3, A6, A10-12, A15]. Eight studies examined samples of older adults who lived at home [A2, A3, A6, A7, A10–12, A16]. Most of the participants in the 12 studies were females [A1, A2, A4, A5, A7–10, A13–16], while males made up the majority of participants in the remaining four studies [A3, A6, A11, A12]. The Geriatric Depression Scale (GDS) was used to measure the severity of depressive symptoms in seven studies [A1, A4, A6, A8, A10, A12, A14]. The remaining studies utilized the Patient Health Questionnaire (PHQ-9) [A5], the Center for Epidemiological Studies Depression Scale (CES-D) [A3, A7, A9, A11, A16], and the Beck Depression Inventory (BDI) [A2]. The included studies also used other means, including assessment of ADLs and IADLs [A1–3, A5–10, A13, A14, A16], to measure ADLs. The main characteristics of the 16 studies are presented in Table 1.

2. Quality Assessment of the Included Studies

The quality of the 16 included studies was assessed using the appraisal tool for descriptive correlational study design. Quality was assured as long as the studies met eight of the tool's 11 items in terms of appropriateness to the issue of interest, proper methodology, data justification, presentation of results, sufficiency of data analysis, ability to apply the findings to the local population, and clearly discussing findings. However, only four of the included studies had a sufficient sample size to allow for the nationwide generalization of the study findings. The remaining 12 studies made no mention of the calculating power for estimating the sample size. The results of each item of the appraisal tool are presented in Table 2.

3. Overall Effect Size for ADLs and Depressive Symptoms

The overall effect size, which represents the strength of the correlation between ADLs and depressive symptoms, for the 16 included studies was r=−.28 (95% CI=−0.32~−0.23). This overall effect size suggested a moderate association between ADLs and depressive symptoms among older adults. As presented in Table 3, the direction of the relationship observed in all the studies was negative, whereas the effect size r ranged from −.14 to −.42 (Table 3). The forest plot for effect size r of the individual studies and overall studies is shown in Figures 2-1, 2-2

4. Subgroup Analyses

To compare the effect size for the relationship between depressive symptoms and ADLs, whether the studies that have clearly excluded the cognitively impaired and unclearly reported the cognitively impaired, subgroup analysis was performed according to the control of the cognitive function. As a result, the effect size was r=−.30 (95% CI=−0.33~−0.27) in controlled studies (n=7), whereas r= −.26 (95% CI=−0.29~−0.25) found in uncontrolled studies (n=9). The result shows in Figure 2-3.

5. Moderation Analyses

As demonstrated in Table 3, population characteristics such as gender (Men/Women), mean age (75+ vs. less than 75), Asian populations (Yes vs. No), and residence type (Home vs. Facility), were used as possible moderators. The strength of the relationship between ADLs and depressive symptoms tended to be larger in studies in which the majority of the participants were females (n=12) females [A1, A2, A4, A5, A7–10, A13–16] ; the mean participant age was under 75 years (n=8)[A3, A8–11, A15, A16]; and the majority of the participants were not Asian (n=9) [A1–3, A6, A10-12, A14, A15]. The effect size of residing in a senior residence was greater than studies in which the participants were living at home and for the ones in which the participants' living situations were unclear (n=5) [A1, A5, A8, A13, A14]. The studies focusing on ADL (n=11) [A1–4, A7, A10–14, A16]; a tool to assess GDS (n=7) [A1, A4, A6, A8, A10, A12, A14]; convenience sample data (n=11) [A1, A2, A5–7, A9, A10, A12–15]; a sample size of less than 200 (n=7) [A1, A2, A4, A5, A7, A8, A15]; and the reporting of the reliability values (n=12) [A2–5, A7–12, A14, A15] had larger effect sizes (r-values) than did comparative studies (Figure 2-3).

DISCUSSION

The findings of this MA showed that all the included studies reported the relationship between ADLs and depressive symptoms in a negative direction among community- dwelling older adults. This moderate-strength relationship between ADLs and depressive symptoms among older adults was significant in most studies. Lack of ADLs significantly increased the depressive symptoms experienced by older adults. Although this MA was unable to reveal a causal relationship between the two factors, it was found that failure to successfully perform daily routines may lead to an increase in older adults' dependency. This, in turn, may lead to an increased tendency exhibit depressive symptoms. Conversely, persistent depressive symptoms may aggravate physical disabilities over time [1326]. However, this relationship strength was not revealed in similar ways in all the included studies. When the 16 included studies were synthesized to obtain the overall effect size for this MA, it was found that the studies were not homogeneous in this regard, and that their individual effect sizes ranged from .14 to .42. Even after applying the necessary criteria for obtaining homogeneity, the strength of the relationship between ADLs and depressive symptoms was found to vary throughout the included studies. It is an important distinction that the target populations of these studies were relatively healthy community- dwelling older adults who were not as cognitively impaired as anticipated in the inclusion criteria. Since cognition plays an integral role in the execution of most physical tasks [26], when the cognitive role was excluded, the strength of the relationship between the two was clear in this subgroup analysis.
The effect size r value was greater in studies that cognitive impaired was precisely excluded as use the assessment tool than counter studies. Older adults who either live at home or are not institutionalized generally tend to be independent in basic ADLs [4]. One study found no statistically significant relationship between ADLs and depressive symptoms. Although this study gave no explanation for this non-significant relationship, one possible reason is that despite being recruited from a family health center, most subjects (72%) were able to go for regular walks to visit their outpatient clinics; such activity may have affected the weak association between ADLs and depressive symptoms [4].
Likewise, the strength of the association between ADLs and depressive symptoms was affected by various study characteristics. Moderation analysis was performed to identify the influencing factors that contributed to the differences of strength of association according to certain population characteristics (gender, mean age, ethnic majority, residential type, types of ADL) and study characteristics (measurement tools used to assess depressive symptoms, data sources, sample size, and presence of measurement reliability reports). Among possible moderators, residential type was a significant moderator in the strength of association between ADLs and depressive symptoms. The studies in which the participants lived in senior housing reported relationships of the greatest strength. Moreover, we found that the strength of association tended to be higher in studies that had a majority of participants who were female, non-Asians, or under the age of 75 years.
The effect sizes were also slightly different depending on the types of measurement tools used to assess physical activity and depressive symptoms, and the presence of reporting of reliability, data sources, and sample sizes. This implies that the effect size was greater in studies that measured IADLs than in studies that measured ADLs. Moreover, ADLs were assessed using the Barthel Index, the Physical Performance Scale, and the ADL Measure in four studies. In order to measure the depressive symptoms, seven studies used either the 15-item or 30-item GDS. The effect sizes in the studies that used GDS were higher than in those that used the CES-D. This should be considered when assessing depression among older adults. The GDS was designed specifically for use with older adults [27], whereas the CES-D was developed to measure depressive symptoms among the general population [28]. Studies on community-dwelling older adults have preferred to use the GDS for assessing depressive symptoms because the items require simple (yes/no) responses. Additionally, this tool states sensitive issues relevant to older adults in a manner that is easy to understand and respond to [27].
Along with measurement tool type, the studies that reported reliability demonstrated strong associations between ADLs and depressive symptoms. However, four studies among 16 did not report the reliabilities of their tools. Even though the effect size differences in reporting reliability were not statistically significant, rigorous attention should be paid during the publication process to whether a tool's reliability is addressed.
In the context of sampling method, the sample sizes of studies that used the convenience sample were much lower than 200, as compared to the random sampling of the studies using national data. The smaller (a sample size of fewer than 200 people) studies demonstrated stronger associations between ADLs and depressive symptoms than did studies using national data. Even though the strength of the association between ADLs and depressive symptoms was not moderated by sample sizes in this MA, this tendency can be explained by the characteristics of the correlation value. If the sample size is large, even a very small correlation can be generally statistically significant [20]. Another important point in terms of sample size should be considered; that is, the power calculation for estimating the sample size was not observed in 12 studies. During the critical appraisal process, most of the questions asked about the quality of the 16 studies were answered favorably, except for the questions that dealt with the sampling method (Questions 3 and 6).
The results of this MA demonstrate the overall strength and direction of the relationship between ADLs and depressive symptoms among community-dwelling older adults; however, some limitations remain. In this MA, many studies that investigated the relationship between ADLs and depressive symptoms among a sample with cognitively and physically impaired older adults living in acute care settings were excluded. More studies of relatively healthy community-dwelling older adults are needed to identify the significant moderating factors by synthesizing the results from individual studies
Despite its limitations, this MA was the first attempt to synthesize information concerning the strength and direction of the association between ADLs and depressive symptoms among community-dwelling older adults. These findings may help to determine the effect size should be entered during power analysis, and the factors that should be considered during estimations of the relationship between ADLs and depressive symptoms among this aging population.
Moreover, several suggestions can be proposed regarding practical nursing intervention. When assessing the level of depression in community-dwelling older adults, ADLs should be considered and monitored. In this study, we could not include the studies that focused on cognitive dysfunction because of the small number of studies on impaired cognitive status. In future studies, the research on the relationship between depression and ADLs in cognitively impaired older adults should be expanded. As research accumulates, the magnitude of the effects of depression and ADLs in older adults can be compared according to their cognitive status.

CONCLUSION

Considering the increasing life expectancy worldwide, community healthcare providers should be concerned about older adults' depression and ADLs, especially among those with a cognitive decline as well as a relatively better cognitive functioning. Based on the results from this SR and MA, we provisionally conclude that there is a significant negative association between ADLs and depressive symptoms, and this relationship is of moderate strength. ADLs and depressive symptoms of community- dwelling and relatively healthy older adults should be continuously assessed by community mental healthcare providers using validated tools. This could help identify the potential factors (e.g. cognitive change) involved in depressive symptoms and ADLs according to changes in the physical and mental health of older adults.
Moreover, from a research perspective, researchers can estimate the sample size for the overall effect size in a sample of community-dwelling older adults when applying the power analysis. However, further MAs should be conducted to confirm this relationship by using data accumulated from individual studies.

Figures and Tables

Figure 1

PRISMA flow diagram of screening and selection process of studies.

kjan-31-1-g001
Figure 2

Funnel plot, forest plot & subgroup analysis.

kjan-31-1-g002
Table 1

Study Characteristics of 16 Included Studies

kjan-31-1-i001

ADL=activities of daily living; BADL=basic activities of daily living; BDI=Beck depression inventory; CES-D=center for epidemiological studies depression scale; CSDD=Cornell scale for depression dementia; GDS=geriatric depression scale; GDS-Mob=geriatric depression scale-mobility; GDS-PAD=geriatric depression scale-physical activity dissatisfaction; GDS-PF=geriatric depression scale-physical functioning; GDS-SF=geriatric depression scale-short form; IADL=instrumental activities of daily living; PHQ-9=patient health questionnaire; PPS=physical performance scale.

Table 2

Critical Appraisal of Included Studies Using AMSTAR (N=16)

kjan-31-1-i002
Table 3

Overall Effect Size and Subgroup Analysis (N=16)

kjan-31-1-i003

ADL=activities of daily living; IADL=instrumental activities of daily living; BADL=basic; GDS=geriatric depression scale; CES-D=center for epidemiological studies depression scale; CI=confidence interval.

ACKNOWLEDGEMENT

This research was supported by the Daejeon University Research Grants (2016).

Notes

CONFLICTS OF INTEREST The authors declared no conflict of interest.

AUTHORSHIP

  • Study conception and design acquisition - KM;

  • Data collection - KM, KS-A, SK;

  • Analysis and interpretation of the data - KM, KS-A, SK;

  • Drafting and critical revision of the manuscript - KM, KS-A.

Appendix

Appendix 1

Studies Included in Meta-Analysis

A1. Altiok M, Yilmaz M, Onal P, Akturk F, Temel GO. Relationship between activities of daily living, sleep and depression among the aged living at home. Pakistan Journal of Medical Sciences. 2012;28(1):162-6.
A2. Bozo, Ö, Toksabay NE, Kürüm O. Activities of daily living, depression, and social support among elderly Turkish people. The Journal of Psychology. 2009;143(2):193-206. https://doi.org/10.3200/JRLP.143.2.193-206
A3. Chao S-F. Functional disability and depressive symptoms: longitudinal effects of activity restriction, perceived stress, and social support. Aging & Mental Health. 2014;18(6):767-76. https://doi.org/10.1080/13607863.2013.878308
A4. Gardner DK, Helmes E. Interpersonal dependency in older adults and the risks of developing mood and mobility problems when receiving care at home. Aging & Mental Health. 2006;10(1):63-8. https://doi.org/10.1080/13607860500307522
A5. Gitlin LN, Szanton SL, Huang J, Roth DL. Factors mediating the effects of a depression intervention on functional disability in older African Americans. Journal of the American Geriatric Society. 2014;62(12):2280-7. https://doi.org/10.1111/jgs.13156
A6. Imai H, Yamanaka G, Ishimoto Y, Kimura Y, Fukutomi E, Chen W, et al. Factor structures of a Japanese version of the Geriatric Depression Scale and its correlation with the quality of life and functional ability. Psychiatry Research. 2014;215(2): 460-5. https://doi.org/10.1016/j.psychres.2013.12.015
A7. Jahn DR, Cukrowicz KC. Self-rated health as a moderator of the relation between functional impairment and depressive symptoms in older adults. Aging & Mental health. 2012;16(3): 281-7. https://doi.org/10.1080/13607863.2011.598847
A8. Jang Y, Bergman E, Schonfeld L, Molinari V. The mediating role of health perceptions in the relation between physical and mental health: a study of older residents in assisted living facilities. Journal of Aging and Health. 2007;19(3):439-52. https://doi.org/10.1177/0898264307300969
A9. Jang Y, Chiriboga DA, Herrera JR, Schonfeld L. Correlates of depressive symptoms among Hispanic older adults living in public housing. Journal of Applied Gerontology. 2010;29(2): 180-95. https://doi.org/10.1177/0733464809339592
A10. Kim BJ, Choi Y. The relationship between activities of daily living (ADL), chronic diseases, and depression among older Korean immigrants. Educational gerontology. 2015;41(6):417-27. https://doi.org/10.1080/03601277.2014.982006
A11. Lu L. Leisure experiences and depressive symptoms among Chinese older people: a national survey in Taiwan. Educational Gerontology. 2011;37(9):753-71. https://doi.org/10.1080/03601271003744632
A12. Shin KR, Kang Y, Kim MY, Jung D, Kim JS, Hong CM, et al. Impact of depression and activities of daily living on the fear of falling in Korean community-dwelling elderly. Nursing & Health sciences. 2010;12(4):493-8. https://doi.org/10.1111/j.1442-2018.2010.00567.x
A13. Steele JC, Patrick JH, Goins RT, Brown DK. Self-rated health among vulnerable older adults in rural Appalachia. Journal of Rural Health. 2005;21(2):182-6. https://doi.org/10.1111/j.1748-0361.2005.tb00080.x
A14. Unsar S, Dindar I, Kurt S. Activities of daily living, quality of life, social support and depression levels of elderly individuals in Turkish society. Journal of the Pakistan Medical Association. 2015;65(6):642-6.
A15.Watanabe Y, Kaneko F, Hanaoka H, Okamura H. Depression and associated factors in residents of a health care institution for the elderly. Physical & Occupational Therapy In Geriatrics. 2007;26(1):29-41. https://doi.org/10.1080/J148v26n01_03
A16. Yang Y. How does functional disability affect depressive symptoms in late life? The role of perceived social support and psychological resources. Journal of Health and Social Behavior. 2006;47(4):355-72. https://doi.org/10.1177/002214650604700404
kjan-31-1-a001

References

1. Bruce ML. Depressive symptoms and disability in late life: directions for future research. The American Journal of Geriatric Psychiatry. 2001; 9(2):102–112. DOI: 10.1097/00019442-200105000-00003.
pmid
2. Health Insurance Review & Assessment Service. What are the most common mental illness by age group? [Internet]. Seoul: Health insurance & assessment service;2018. cited 2019 January 08. Available from: https://www.hira.or.kr/co/search.do?searchWord=%EC%97%B0%EB%A0%B9%EB%8C%80%EB%B3%84+%EB%A7%8E%EC%9D%B4+%EB%82%98%ED%83%80%EB%82%98%EB%8A%94+%EC%A0%95%EC%8B%A0%EA%B1%B4%EA%B0%95+%EC%A7%88%ED%99%98%EC%9D%80%3F.
3. Park JH, Kim KW. A review of the epidemiology of depression in Korea. Journal of the Korean Medical Association. 2011; 54(4):362–369. DOI: 10.5124/jkma.2011.54.4.362.
crossref
4. Altiok M, Yilmaz M, Onal P, Akturk F, Temel GO. Relationship between activities of daily living, sleep and depression among the aged living at home. Pakistan Journal of Medical Sciences. 2012; 28(1):162–166.
5. Smalbrugge M, Pot AM, Jongenelis L, Gundy CM, Beekman ATF, Eefsting JA. The impact of depression and anxiety on well being, disability and use of health care services in nursing home patients. International Journal of Geriatric Psychiatry. 2006; 21(4):325–332. DOI: 10.1002/gps.1466.
crossref pmid
6. Han JH, Park KM, Park H. Effects of laughter therapy on depression and sleep among patients at long-term care hospitals. Korean Journal of Adult Nursing. 2017; 29(5):560–568. DOI: 10.7475/kjan.2017.29.5.560.
crossref
7. Song HJ, Meade K, Akobundu U, Sahyoun NR. Depression as a correlate of functional status of community-dwelling older adults: utilizing a short-version of 5-item Geriatric Depression Scale as a screening tool. The Journal of Nutrition, Health & Aging. 2014; 18(8):765–770. DOI: 10.1007/s12603-014-0542-0.
crossref
8. de Paula JJ, Diniz BS, Bicalho MA, Albuquerque MR, Nicolato R, de Moraes EN, et al. Specific cognitive functions and depressive symptoms as predictors of activities of daily living in older adults with heterogeneous cognitive backgrounds. Frontiers in Aging Neuroscience. 2015; 7:139. DOI: 10.3389/fnagi.2015.00139.
crossref
9. Mehta KM, Yaffe K, Covinsky KE. Cognitive impairment, depressive symptoms, and functional decline in older people. Journal of the American Geriatrics Society. 2002; 50(6):1045–1050. DOI: 10.1046/j.1532-5415.2002.50259.x.
crossref pmid pmc
10. Neergaard JS, Dragsbæk K, Hansen HB, Henriksen K, Christiansen C, Karsdal MA. Late-life risk factors for all-cause dementia and differential dementia diagnoses in women: a prospective cohort study. Medicine. 2016; 95(11):e3112. DOI: 10.1097/MD.0000000000003112.
11. Gallagher D, Kiss A, Lanctot K, Herrmann N. Depressive symptoms and cognitive decline: a longitudinal analysis of potentially modifiable risk factors in community dwelling older adults. Journal of Affective Disorders. 2016; 190:235–240. DOI: 10.1016/j.jad.2015.09.046.
crossref pmid
12. Chau V, Bowie JV, Juon H-S. The association of perceived discrimination and depressive symptoms among Chinese, Korean, and Vietnamese Americans. Cultural Diversity and Ethnic Minority Psychology. 2018; 24(3):389–399. DOI: 10.1037/cdp0000183.
crossref pmid
13. Gitlin LN, Szanton SL, Huang J, Roth DL. Factors mediating the effects of a depression intervention on functional disability in older African Americans. Journal of the American Geriatric Society. 2014; 62(12):2280–2287. DOI: 10.1111/jgs.13156.
crossref
14. Lu L. Leisure experiences and depressive symptoms among Chinese older people: a national survey in Taiwan. Educational Gerontology. 2011; 37(9):753–771. DOI: 10.1080/03601271003744632.
crossref
15. Schmitter-Edgecombe M, Parsey C, Lamb R. Development and psychometric properties of the instrumental activities of daily living: compensation scale. Archives of Clinical Neuropsychology. 2014; 29(8):776–792. DOI: 10.1093/arclin/acu053.
crossref pmid pmc
16. Cooper H. Synthesizing research: a guide for literature reviews. California: Sage;1998.
17. Ferguson CJ, Brannick MT. Publication bias in psychological science: prevalence, methods for identifying and controlling, and implications for the use of meta-analyses. Psychological Methods. 2012; 17(1):120–128. DOI: 10.1037/a0024445.
crossref pmid
18. Sterne JAC, Egger M, Smith GD. Investigating and dealing with publication and other biases in meta-analysis. British Medical Journal. 2001; 323:101. DOI: 10.1136/bmj.323.7304.101.
pmid
19. Guyatt GH, Sackett DL, Cook DJ, Guyatt G, Bass E, Brill-Edwards P, et al. Users' guides to the medical literature: II. How to use an article about therapy or prevention a. Are the results of the study valid? Journal of the American Medical Association. 1993; 270(21):2598–2601. DOI: 10.1001/jama.1993.03510210084032.
20. Cohen J, Cohen P, West SG, Aiken LS. Applied multiple regression/correlation analysis for the behavioral sciences. 3rd ed. New York: Taylor & Francis Inc;2013. p. 5.
21. Hedges LV, Olkin I. Statistical methods for meta-analysis. Orlando: Academic Press;1985. p. 337.
22. Borenstein M, Hedges LV, Higgins JPT, Rothstein HR. Introduction to meta-analysis. . Chichester, West Sussex, UK: John Wiley & Sons;2009. p. 117.
23. Jang DH, Shin IS. The relationship between research self-efficacy and other research constructs: synthesizing evidence and developing policy implications through meta-analysis. KEDI Journal of Educational Policy. 2011; 8(2):279–301.
24. Sirin SR. Socioeconomic status and academic achievement: a meta-analytic review of research. Review of Educational Research. 2005; 75(3):417–453. DOI: 10.3102/00346543075003417.
crossref
25. Cohen J. Statistical power analysis for the behavioral sciences. 2nd ed. Hillsdale, NJ: Erlbaum Associates;1988.
26. Morala DT, Shiomi T, Maruyama H. Factors associated with the functional status of community-dwelling elderly. Journal of Geriatric Physical Therapy. 2006; 29(3):101–106.
crossref pmid
27. Yesavage JA, Brink TL, Rose TL, Lum O, Huang V, Adey M, et al. Development and validation of a geriatric depression screening scale: a preliminary report. Journal of Psychiatric Research. 1982; 17(1):37–49. DOI: 10.1016/0022-3956(82)90033-4.
crossref pmid
28. Radloff LS. The CES-D scale: a self-report depression scale for research in the general population. Applied Psychological Measurement. 1977; 1(3):385–401. DOI: 10.1177/014662167700100306.
TOOLS
ORCID iDs

Myoungjin Kwon
https://orcid.org/0000-0003-2364-0863

Sun-Ae Kim
https://orcid.org/0000-0002-6896-7459

Kawoun Seo
https://orcid.org/0000-0003-4956-0626

Similar articles