

 PDF
PDF ePub
ePub Citation
 Print
Print


INTRODUCTION
Prostate cancer (Pca) is one of the most frequent cancers in men worldwide.1 The incidence of Pca is consistently increasing with aging societies. Pca has been the most frequent urological cancer since 2004. The number of patients who are diagnosed with Pca has remained greater than the sum of patients who are diagnosed with bladder and renal cancers since 2008.2 Moreover, the mortality of Pca has sharply increased about 12 times, as of 2002, compared to 1983. Pca is the most rapidly increasing cancer among all cancers in South Korea.3,4
The social burden of Pca, including medical cost, has increased consistently. This is associated with the increasing prevalence of Pca due to not only the increased incidence of Pca, but also due to an increased survival rate among Pca patients.5 In the United States, the cost burden of Pca treatment was estimated to be 10 billion dollars in 2006. In Japan, it was 174.5 billion yen in 2002. The cost is expected to be much higher in 2020.6,7
Compared to other treatments, radical prostatectomy (RP) is chosen more for younger and less morbid patients who are less likely to have peri-operative or post-operative complications than for older patients.8 However, about 80% of Pca patients are over 65 years of age. Age at diagnosis of Pca has increased consistently over the last 10 years.9,10 This phenomenon could be explained by age structural change and decreased Pca screening test. Recent evidence suggests that patients are undergoing RP at a higher age than before. However, RP rate are decreasing compared to rates for other treatments, including watchful waiting, active surveillance, radiation therapy, and hormone therapy.11,12 This phenomenon could be more prominent in South Korea, considering that this country has the highest speed of age structural change and a relatively high proportion of RP, compared to the United States, which has other treatment options. Thus, determining the trend of Pca prevalence according to age structural change is important for estimating the future disease burden of Pca.12,13
To date, there are no standard guidelines for screening for Pca, including performance of prostate-specific antigen (PSA), in South Korea. Regarding the performance of prostate biopsy, indicated criteria include more than 5 years of remnant life expectancy and patients with symptoms.14
South Korea is now facing the issue of an aging society. It has the lowest fertility rate among all Organization for Economic Cooperation and Development (OECD) countries. The proportion of South Korea's population over 65 years was more than 10% in 2008 and 15% in 2015. It is expected to increase to about 30% by 2030.15,16
Because healthcare budgets are limited, it is important to allocate the budget in consideration of the balanced benefit of healthcare. If there is a decreasing trend for RP in Pca and if the possible phenomenon could be explained by aging changes, medical and healthcare funding can be distributed appropriately, and other treatments, such as watchful waiting, active surveillance, radiation therapy, and hormone therapy, should be considered.
Our previous study revealed that age structural changes can affect the performance of urologic diagnostic tools.17 Considering an increasing socioeconomic burden due to an increased prevalence of Pca and the lack of studies on age structural changes in Pca patients, the objective of this study was to investigate trends in Pca prevalence and frequency of surgical treatment according to age structural change using National Health Insurance Data covering 99% of all South Korean men.
MATERIALS AND METHODS
Data collection
Annual reports of cancer statistics from National Health Insurance Service (NHIS) of South Korea between 2005 and 2015 were used. The National Health Insurance (NHI) program in South Korea was started in 1970s; this program came to offer universal health care in 1989. The NHIS covers 99% of all South Koreans and provides information about the number of patients with each type of cancer registered in NHI, including age, gender, diagnosis, medical procedures, and so on.17 Pca (C61) was coded according to the Korean standard classification of disease and cause of death, 6th edition (KCD-6). We collected the number of males in South Korea from 2005 to 2015 from the Korean Statistical Information Service (KOSIS). The KOSIS collects economic, social, and medical statistics for South Korea. Among patients who had a code of C61 from 2005 to 2015, we selected patients who had received primary treatment for Pca, such as surgical treatment. This work was approved by the Institutional Review Board of Soonchunhyang University Seoul Hospital (SCHUH 2018-12-020).
Surgical treatment included radical prostatectomy, such as retropubic RP, perineal RP, laparoscopic RP, and robot-assisted laparoscopic prostatectomy (RALP). Reimbursement codes of RP in NHIS were R3950, R3960, and RZ512. RALP had no code because it was not reimbursed by NHIS. An alternative defining method was used to detect RALP using codes of general anesthesia (L1211) and postoperative pathologic examination (C5500, C5501, C5502, C5503, C5504, C5505, C5506, C5507, C5508, C5509, C5911, C5912, C5913, C5914, C5915, C5916, C5917, C5918, C5919).18
Measurement outcomes
The primary outcomes of this study were the following two relationships: 1) between annual Pca prevalence and age structural change, and 2) between annual trend in operation rate and age structural change. To investigate these two outcomes, cumulative age-standardized prevalence rates per year according to age groups, cumulative age-standardized operation rates per year according to age groups, age-standardized operation rates/patients per year according to age groups, correlation between Pca patient rates per year and percentage of population, correlation between operation rates per year and percentage of population, and correlation between operations/patients rates per year and percentage of population were measured. We subdivided age into the following groups: less than 40 years old, 40s, 50s, 60s, and over 70 years old. We described all outcomes as rates standardized as per 100000 males using real general population of the relevant year.
Data analysis
The total number of males per year was calculated for each age group in South Korea using data of National Statistical Office. The total number of Pca patients and total number of operations per year according to age groups were calculated based on diagnosis codes. Cumulative patient and operation rates according to year were analyzed. Cumulative age-standardized patients and operations according to year and age groups were also analyzed. For analysis, generalized linear models were used. Results are displayed as estimates with standard errors and were plotted as a line graph. Analysis was performed for cumulative age-standardized patient rates per 100000 people, operation rates per 100000 people, and operation/patient rates according to year and age groups. Piecewise linear regression model was used to compare trends before and after 2011. Analysis was performed for correlation coefficients between patient rates and percentage of population, between operation rates and percentage of population, and between operation rates/patient rates and percentage of population per year. Statistically significant differences were considered when p was less than 0.05. All data were analyzed using R software (v3.1.2; R Foundation, Vienna, Austria).
RESULTS
Annual trends in prevalence, operation rate, and operation rate/patient rates
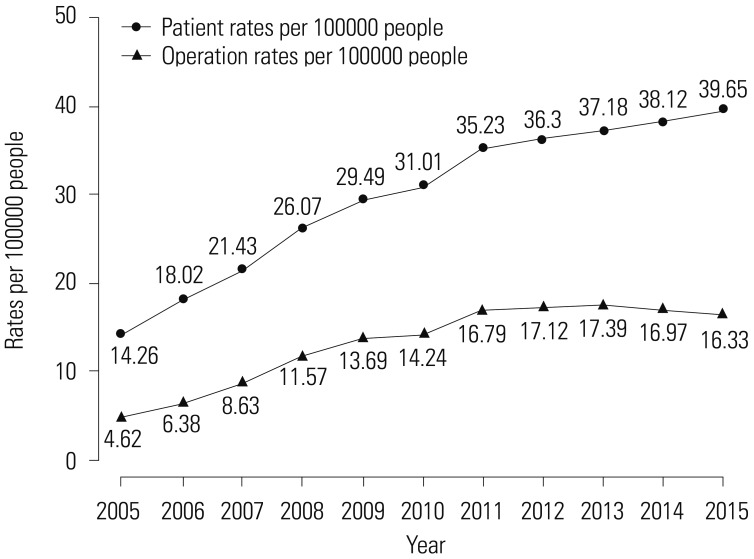
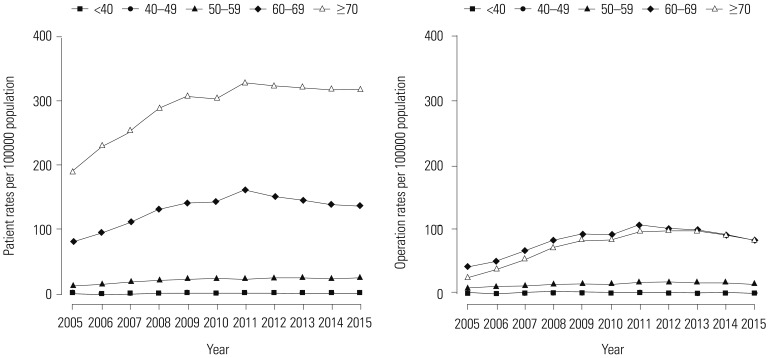
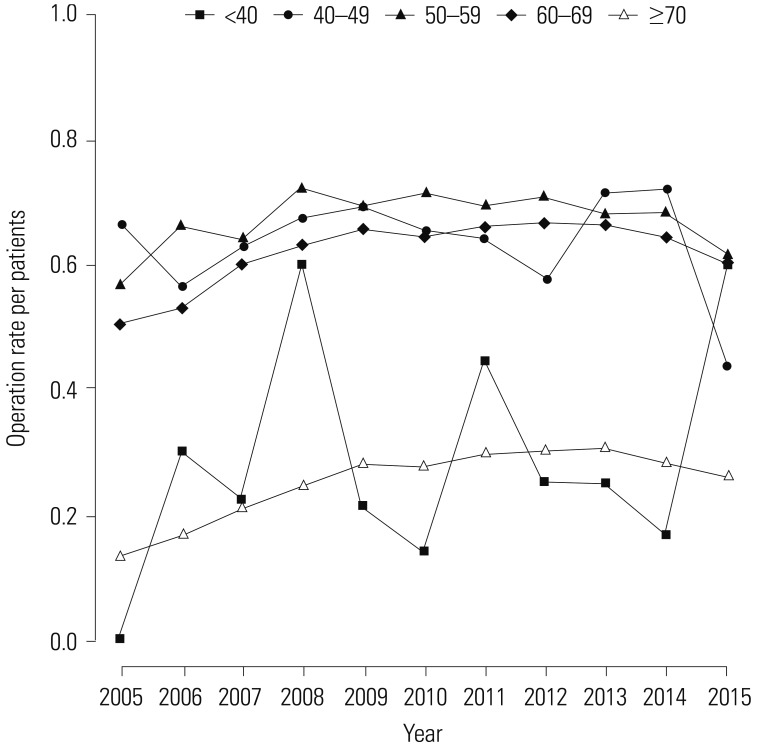
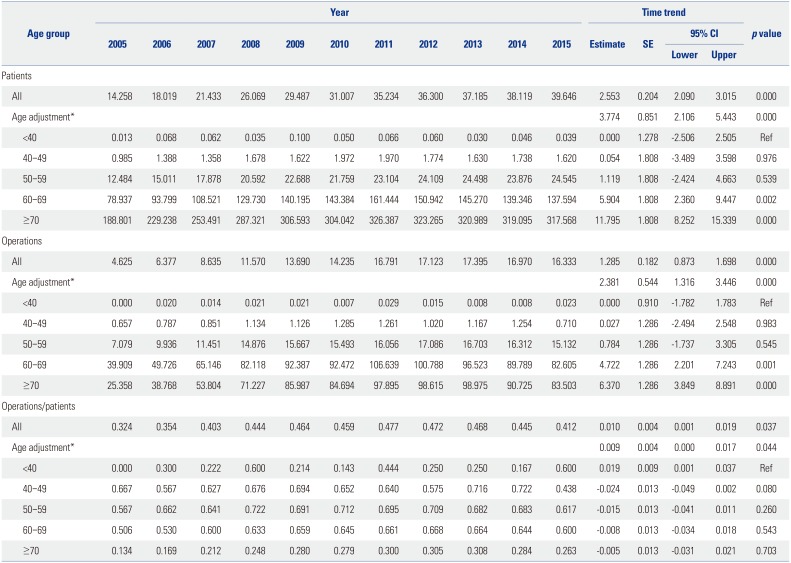
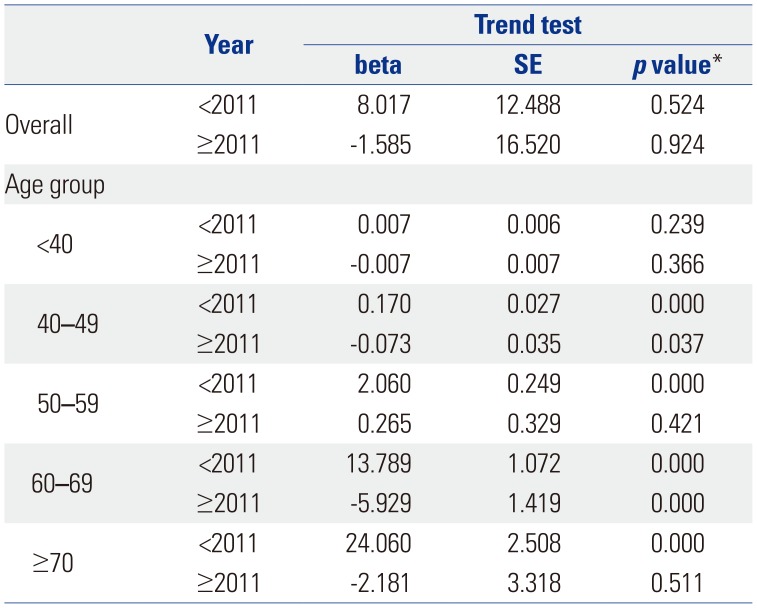
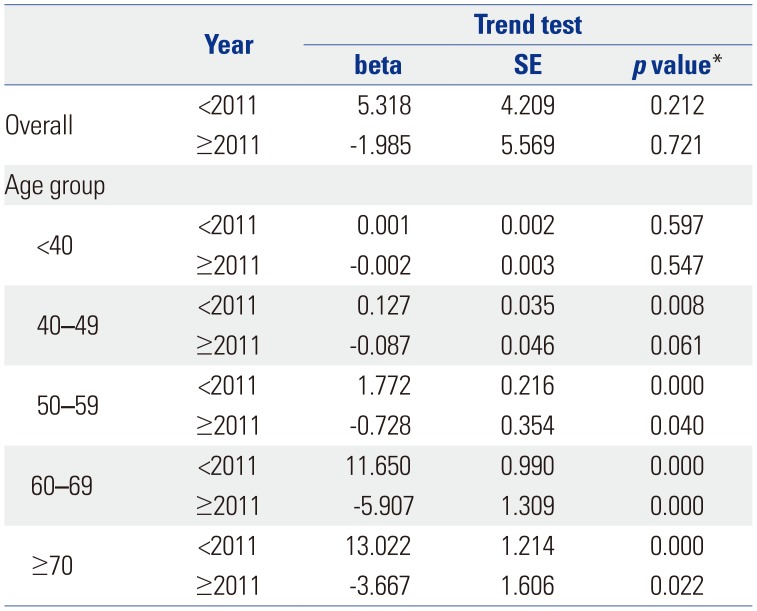
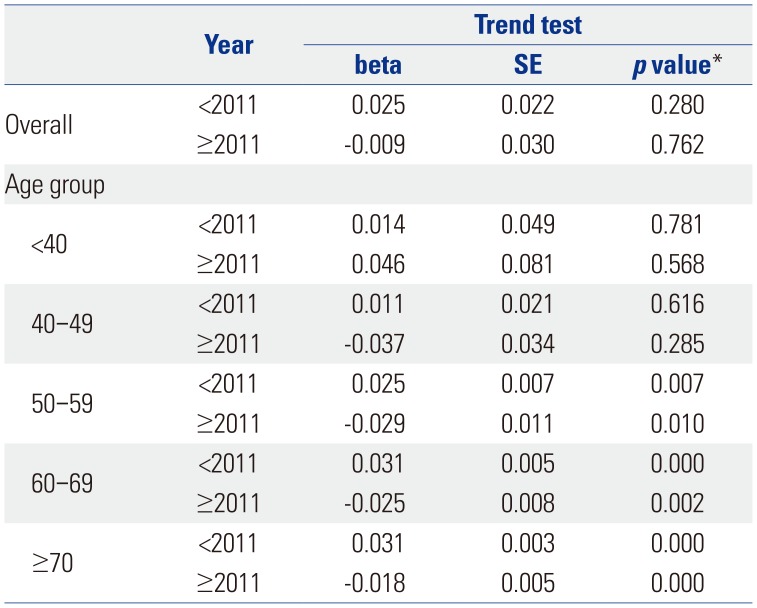
Table 1 shows the trend test results for Pca patients, operations, and operations/patients of all Pca patients after age adjustment according to age groups. Overall trends in patients and operations showed increases over the study period (β=2.553, p=0.000; and β=1.285, p=0.000, respectively). However, the overall trend in operations/patients nearly did not change (β=0.01, p=0.037). Remarkably, trends in patients in the age groups of 60 and over 70 years showed increasing patterns in the study period (β=5.904, p=0.002; and β=11.795, p=0.000, respectively). Trends in operations in the 60s and over 70s age groups also showed increasing patterns (β=4.722, p=0.001; and β=6.37, p=0.000, respectively). However, trends in operations/patients in age groups of 60s and over 70s showed statistically insignificant patterns (β=-0.008, p=0.543; and β=−0.005, p=0.703, respectively). Table 2 shows piecewise linear regression results of Pca patients in the overall population according to age grouping and trend test results before and after 2011. Trends in Pca patients followed an increasing pattern before 2011 and a decreasing pattern after 2011 in the 60s age group (β=13.789, p=0.000 before 2011; and β=−5.929, p=0.000 after 2011). Table 3 shows the results of piecewise linear regression of operations in the overall population according to age groups. Trends in operations also had an increasing pattern before 2011 and a decreasing pattern after 2011 in the age groups of 50s, 60s, and over 70s (β=1.772, p=0.000 before 2011 and β=−0.728, p=0.040 after 2011 in 50s; β=11.65, p=0.000 before 2011 and β=−5.907, p=0.000 after 2011 in 60s; β=13.022, p=0.000 before 2011 and β=−3.667, p=0.022 after 2011 in over 70s). Table 4 shows the results of piecewise linear regression of operations/patients in the overall population according to age groups. Trends in operations/patients followed an increasing pattern before 2011 and a decreasing pattern after 2011 in age groups of 50s, 60s, and over 70s (β=0.025, p=0.007 before 2011 and β=−0.029, p=0.010 after 2011 in 50s; β=0.031, p=0.000 before 2011 and β=−0.025, p=0.002 after 2011 in 60s; β=0.031, p=0.000 before 2011 and β=−0.018, p=0.000 after 2011 in over 70s). Fig. 1 shows patient rates and operation rates per 100000 people per year. Both showed increasing patterns during the study period. However, the increasing speed decreased after 2011. Fig. 2 shows cumulative age-standardized prevalence rates and operation rates per year according to age groups. The rates exhibited a plateau pattern that peaked in 2011, showing a decreasing pattern in age groups of 60s and over 70s. Fig. 3 shows age-standardized operation rates/patients per year according to age groups. These rates also had a plateau pattern. They increased until 2009 (46%), with a similar portion until 2013, and decreased (41%) in 2015.
Relationships between trends in Pca prevalence, operation rates, or operation rates/prevalence and age structural changes per year
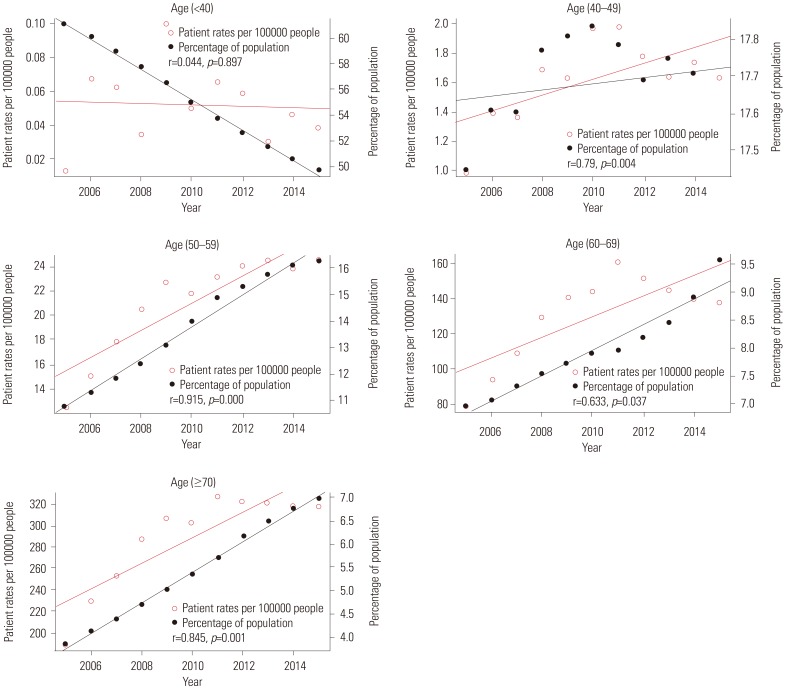
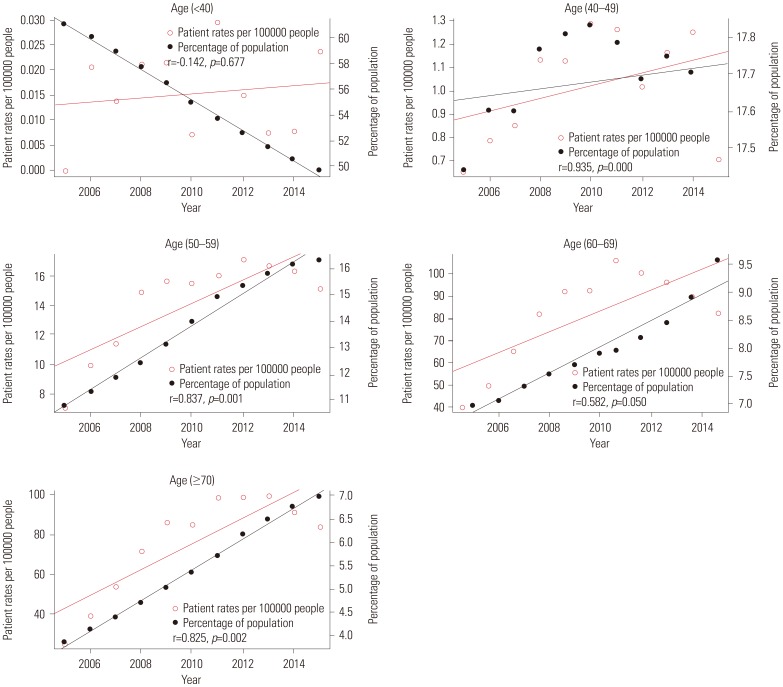
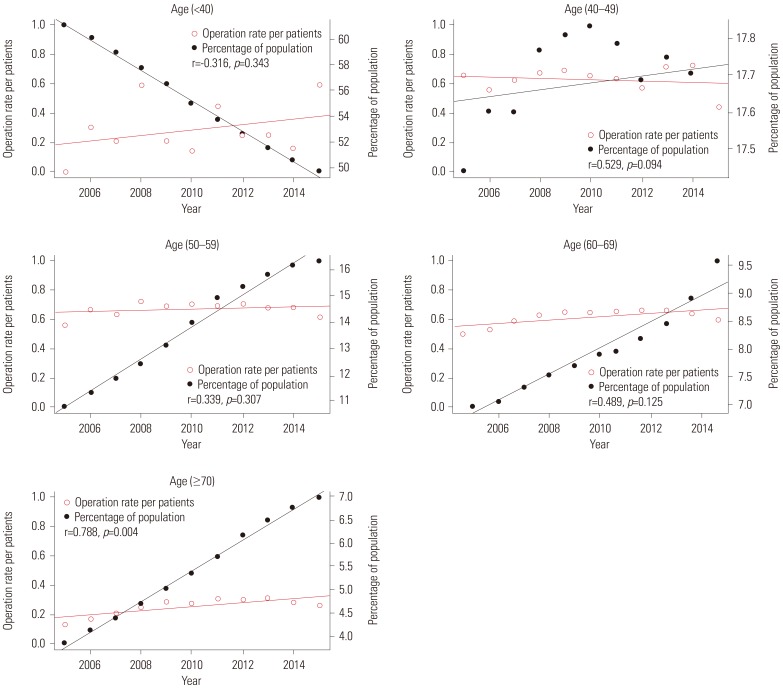
Fig. 4 shows the relationships between patient rates and percentage of population per year according to age groups. The red line represents trends in patient rates per year, while the black line represents trends in the percentage of population. Patient rate and percentage of population of each age group had a positive relationship (r=0.79, p=0.004 in 40s; r=0.915, p=0.000 in 50s; r=0.633, p=0.037 in 60s; r=0.845, p=0.001 in over 70s) except for the age group of under 40 years (r=0.044, p=0.897). Fig. 5 shows the relationship between operation rate and percentage of population per year according to age groups. The red line represents the trend in operation rate per year, while the black line represents the trend in percentage of population. The operation rate of Pca and percentage of population of each age group also had a positive relationship (r=0.935, p=0.000 in 40s; r=0.837, p=0.001 in 50s; r=0.582, p=0.050 in 60s; and r=0.825, p=0.002 in over 70s) except for the age group of under 40 (r=−0.142, p=0.677). Fig. 6 shows the relationship between operation rates/patients and the percentage of population per year according to age groups. The red line represents the trend of operation rates/patients per year, while the black line represents the trend of percentage of population. Operation rates/patients and percentage of population per year had no significant relationship (r=−0.316, p=0.343 in under 40 years; r=0.529, p=0.094 in 40s; r=0.339, p=0.307 in 50s; r=0.489, p=0.125 in 60s), except for the age group of over 70 years (r=0.788, p=0.004).
DISCUSSION
This is the first study to investigate trends in the prevalence of Pca and operation rates according to age structural change. Investigating such trends is an important issue because South Korea has become an aged society. This study provides useful evidence with which to predict future medical costs of Pca treatment. We had two main hypotheses: 1) Pca prevalence and surgical treatment rate would be affected by age structural changes; 2) considering rapid decreases in younger individuals, surgical treatment rates would decrease without showing correlations with the increasing age of the population. Hence, we used prevalence of Pca and age-specific operation rates of Pca. Prevalence was used as an indicator of real demand for Pca treatment, because it reflects the changing status of treatment patterns. Thus, it would be affected by recent age structural changes.
Due to the absence of standard guidelines for screening of Pca, the performance of PSA is generally done during a general health checkup or during an initial evaluation of benign prostatic hyperplasia. Considering the continuously rising phenomenon of Pca specific mortality in South Korea, the cost-effectiveness of Pca screening has to be refocused again.19
In the United States, over one-third of all patients who underwent operation treatment were patients aged over 65 years. Over half of the patients who underwent RP were aged over 65 years in 2007.20,21 According to demographic changes in an aging society, this trend will become of greater importance in future health care.
Due to age structural changes and decreased opportunities for screening tests for Pca, age at diagnosis has increased. Reportedly, patients underwent RP at a higher age than before, resulting in a decreasing portion of surgical treatments.11 Pca in South Korea had shown an increasing trend until 2011. After 2011, its increasing speed slowed. Song and Jeon2 have reported that the incidence of Pca rapidly increased in the age group of 55–59 years, showing a peak increasing rate in the age group of 70–74 years from 1999 to 2010. Considering South Korea is becoming an aging society at a high rate, older age groups could have a higher prevalence rate than relatively younger age groups. In our results, the prevalence of Pca increased until 2014, but decreased in 2015, while surgical treatments increased until 2013, but decreased from 2014. Unless Pca detection rates decreased, this meant that Pca patients chose other treatment options, such as watchful waiting, active surveillance, radiation therapy, and hormone therapy. Because Pca incidence was not decreased and Pca mortality was slightly increased in South Korea, the stabilization or decrease in Pca prevalence could be explained by a decrease in the utilization rate of medical services.22,23
Chen, et al.12 have studied national trends in Pca in the United States from 2004 to 2013, a study period similar to ours. Regarding operation rates, there were also about 35% of Pca patients who were treated by operation, showing a peak operation rate of 40% in 2007.12 The operation rate then began to decrease from 2013.12 Their study showed similar findings to our study in that the number of Pca patients increased with higher age at diagnosis, while the number of Pca patients who chose surgical treatment for Pca decreased with higher age at diagnosis.12 They concluded that the trend was that younger patients had more proper surgical treatment, while older patients sought non-surgical treatment, although surgical technique had improved.
The decreasing Pca prevalence might reflect several possibilities. First, the number of screening tests performed for Pca decreased. In South Korea, almost 15% of all male South Koreans over 50 years old undergo PSA screening, compared to 75% of all males in the United States. Additionally, in 2011, the USPSTF recommended restrict routine screening test for Pca using PSA, because it might cause over-diagnosis and overtreatment.24 Many urologists might be influenced by this recommendation, especially when they treat older patients. Second, medical utilization rates decreased among older patients due to various reasons, including financial dependence on their supporters. Failure to maintain financial independence in older adults can cause a reduction in individual medical expenditures and eventually decrease medical utilization rates.25 The decreasing trend in RP could be explained by patient preference for safer and more convenient treatment strategies, including watchful waiting, active surveillance, radiation therapy, and hormone therapy over surgical therapy.26,27
Tamada, et al.27 have reported that treatment outcomes are similar between radiation therapy and surgical treatment. They compared the two using overall survival, cancer-specific survival, and biochemical failure-free survival. Cancer-specific survival was similar between the two groups, although surgical treatment was superior to radiation therapy in overall survival. Otherwise, radiation therapy was superior to surgical treatment in biochemical failure-free survival. Post-treatment complications, including urinary incontinence and erectile dysfunction, occurred less in the radiation therapy group than in the surgical treatment group both in the short and long term.27 Considering the relatively long survival of Pca patients after treatment of Pca and the quality of life in Pca patients, fewer complications are crucial. When new Pca patients decide the type of treatment, they might choose one that has less peri-operative and post-operative complications.28,29
Pca patients tend to decide to undergo other treatment options, including radiation therapy and active surveillance due to their similar oncologic results, with less or no risk, because morbidity increases with complications of general anesthesia or a huge operation.30 Hamdy, et al.31 reported that the metastasis and progression rates of Pca are higher in active surveillance groups than in RP and radiotherapy groups, although mortality rates are not significantly different among these groups. Wilt, et al.30 also reported that there is no significant difference in all-cause or Pca mortality between surgical treatment and active surveillance groups of localized Pca patients with over 10 years of follow up; meanwhile, surgical treatment elicited higher adverse events than active surveillance.30,31 Nevertheless, active surveillance is rarely used in South Korea, because the portion of localized Pca is 54%, compared to 82% in the US.29 Pathological results for half of Pca patients who were treated by surgical treatment showed aggravated features, compared to prostate biopsy pathology results in South Korea.32 Surgical treatment including RP comprised a higher portion (60%) of total Pca treatment in South Korea from 2000 to 2010 than (35%) in the US from 2004 to 2013.12,13
In our study, Pca prevalence and surgical treatment including RP showed a decreasing trend due to age structural change, because South Korea has become an aging society. Based on our study results, we need guidelines for Pca screening and treatment considering South Korea has the fastest age structural change speed among OECD countries. More advanced studies are needed to verify our results.
Androgen deprivation therapy (ADT) was first introduced for Pca treatment in 1942. ADT can be used as an adjuvant therapy or combine therapy for advanced Pca. Even if it has no benefit for localized Pca, it can improve cancer-free survival and overall survival in advanced Pca. Considering this advantage of ADT, it should be used more for high-risk patients in the future.33
This study has several limitations. First, there was no statistical indicator of Pca incidence. Therefore, we could not differentiate patients who were newly diagnosed and those who were previously diagnosed. However, prevalence is more important than incidence itself because prevalence can reflect the real medical utilization rate and predict socioeconomic burden of Pca treatment and post-treatment. Second, there was no statistical information on other treatment options, including watchful waiting, active surveillance, radiation therapy, or hormone therapy. Our study was based on NHIS data that had no definite information on other treatments. The most difficult point that could be raised with using National Health Claim Data was that we could not define cases undergoing robotic surgeries. However, unlike other cancers, there is a validated method for identifying cases for robotic-assisted laparoscopic surgery for Pca.18 In South Korea, national health insurance covers Pca treatments, except stereotactic body radiation and robotic surgery. It covered 22.4% of all cancer patients in 2011; private insurance covered Pca treatments, including stereotactic body radiation and robotic surgery.34 Our previous study reported that radiation therapy for Pca, including stereotactic body radiation, had continuously increased from 2005 to 2014. Considering these two factors, economic burden did not affect the choice of Pca treatment.35
This study revealed age structural change to be a unique feature of South Korea that could affect trends in the prevalence and surgical treatment rate of Pca, both of which were predicted to follow a decreasing trend according to age structural change. Future studies are needed to investigate underlying causes of the decreasing prevalence of Pca and surgical treatment rates for Pca. Possible socioeconomic and cultural factors affecting patient preferences for specific treatment options also need to be determined in the future.
 XML Download