Journal List > Yonsei Med J > v.60(3) > 1116824

Bae and Kwon: Current State of Research on the Risk of Morbidity and Mortality Associated with Air Pollution in Korea

Abstract

Purpose

The effects of air pollution on health can vary regionally. Our goal was to comprehensively review previous epidemiological studies on air pollution and health conducted in Korea to identify future areas of potential study.

Materials and Methods

We systematically searched all published epidemiologic studies examining the association between air pollution and occurrence of death, diseases, or symptoms in Korea. After classifying health outcomes into mortality, morbidity, and health impact, we summarized the relationship between individual air pollutants and health outcomes.

Results

We analyzed a total of 27 studies that provided 104 estimates of the quantitative association between risk of mortality and exposure to air pollutants, including particulate matter with aerodynamic diameter less than 10 µm, particulate matter with aerodynamic diameter less than 2.5 µm, sulfur dioxide, nitrogen dioxide, ozone, and carbon monoxide in Korea between January 1999 and July 2018. Regarding the association with morbidity, there were 38 studies, with 98 estimates, conducted during the same period. Most studies examined the short-term effects of air pollution using a time series or case-crossover study design; only three cohort studies that examined long-term effects were found. There were four health impact studies that calculated the attributable number of deaths or disability-adjusted life years due to air pollution.

Conclusion

There have been many epidemiologic studies in Korea regarding air pollution and health. However, the present review shows that additional studies, especially cohort and experimental studies, are needed to provide more robust and accurate evidence that can be used to promote evidence-based policymaking.

INTRODUCTION

The effect of air pollution on mortality and the burden of disease increases as air pollution increases, although estimates can vary from region to region. According to the Global Burden of Disease Study, ambient air pollution accounted for 7.5% of deaths globally in 2016 and was the sixth leading contributor to attributable disability-adjusted life years (DALYs) in that year.1 Korea has experienced rapid economic growth in the last century, and the quality of the atmosphere has worsened. Air pollution reduction policies, such as the Special Law on Air Quality in the Seoul metropolitan area, have had limited effect on particulate matter (PM) pollution, and the overall air quality remains poor. Concentrations of PM with aerodynamic diameter less than 10 µm (PM10) have improved over the past decade, reaching the lowest national average of 45 µg/m3 in 2012, and then rebounding to a level of 47 µg/m3 in 2016. However, the concentration of nitrogen dioxide (NO2) has remained relatively constant, with no large changes. The average values of ozone (O3) concentration are continuously increasing.2
Epidemiological studies on the health effects of air pollution have been actively conducted in many countries. In particular, time series studies to examine the short-term effects of air pollution have been conducted worldwide and have yielded relatively consistent results.34 However, cohort studies to assess the long-term effects of air pollution have been primarily conducted in Western countries that have relatively low concentrations of air pollutants. Due to a lack of direct evidence at higher global concentrations, the integrated expose–response (IER) model was developed. The IER combines information on PM-mortality associations from non-outdoor sources, including secondhand smoke, active smoking, and household air pollution,5 and has been used to estimate the disease burden attributable to PM with aerodynamic diameter less than 2.5 µm (PM2.5).1 As the use of IER requires a strict assumption of equal toxicity per unit dose across these non-outdoor sources, cohort studies are needed that reflect the different air pollution concentrations in different regions.6
The health effects of air pollution can vary regionally depending on the composition of pollutants or characteristics of the population at risk. The regional differences in PM2.5 mortality risk estimates can likely be attributed to geographic variation in particle composition or the spatial heterogeneity of constituents,7 as well as differences in the total air pollution mixture.8 Regional differences of topography, which may lead to regional differences of exposure error, can contribute to regional differences in PM risk estimates.9
To accurately understand the impact of air pollution on health in Korea, the results of research performed specifically for Korea are needed. Since the publication of time series research starting in 1999 in Korea,10 many epidemiological studies have been conducted; however, the results of these studies have not been systematically summarized. To accurately assess the impact of air pollution in Korea and to clarify future research directions, systematic sorting of epidemiological studies on air pollution conducted in Korea is required. The aim of the present analysis was to comprehensively review previous epidemiological studies on air pollution and health conducted in Korea to identify future study needs.

LITERATURE SEARCH

We conducted a literature search in PubMed using the search terms (“air pollution”[MeSH Terms] OR (“air”[All Fields] AND “pollution”[All Fields]) OR “air pollution”[All Fields]) AND (“mortality”[Subheading] OR “mortality”[All Fields] OR “mortality”[MeSH Terms]) AND (“Korea”[MeSH Terms] OR “Korea”[All Fields]) and ((“air pollution”[MeSH Terms] OR (“air”[All Fields] AND “pollution”[All Fields]) OR “air pollution” [All Fields]) AND (“epidemiology”[Subheading] OR “epidemiology” [All Fields] OR “morbidity”[All Fields] OR “morbidity” [MeSH Terms]) AND (“Korea”[MeSH Terms] OR “Korea”[All Fields])) NOT (“mortality”[Subheading] OR “mortality” [MeSH Terms]) to find published studies on the associations of air pollution with mortality and morbidity respectively in Korea, between January 1990 and July 2018.
We also searched for health impact assessment studies using the same search engine and the search terms (“number” [All Fields] AND (“death”[MeSH Terms] OR “death”[All Fields] OR “deaths”[All Fields])) OR “burden of disease”[All Fields] OR “health impact assessment”[All Fields] AND “Korea”[All Fields] AND (“air pollution”[All Fields] OR “ambient”[All Fields]).
After reviewing the title and abstract of each article, we selected epidemiological studies that reported associations between exposure to air pollution and mortality or morbidity. We then summarized these articles according to their characteristics and results.
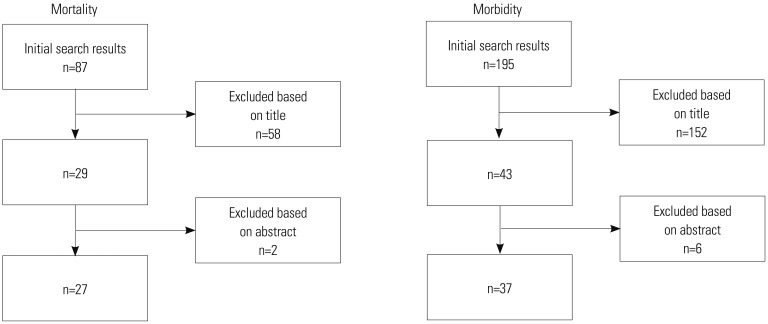
The initial search for mortality and morbidity returned 87 and 195 results, respectively. After excluding articles that did not meet the inclusion criteria (Fig. 1), there remained 27 (Table 1) and 37 studies (Table 2) on mortality and morbidity, respectively. One of the mortality study also reported morbidity results, so a total of 38 studies were included in the present review. The search for health impact analyses returned 22 studies; four articles remained after a review of titles and abstracts.

Air pollution and mortality

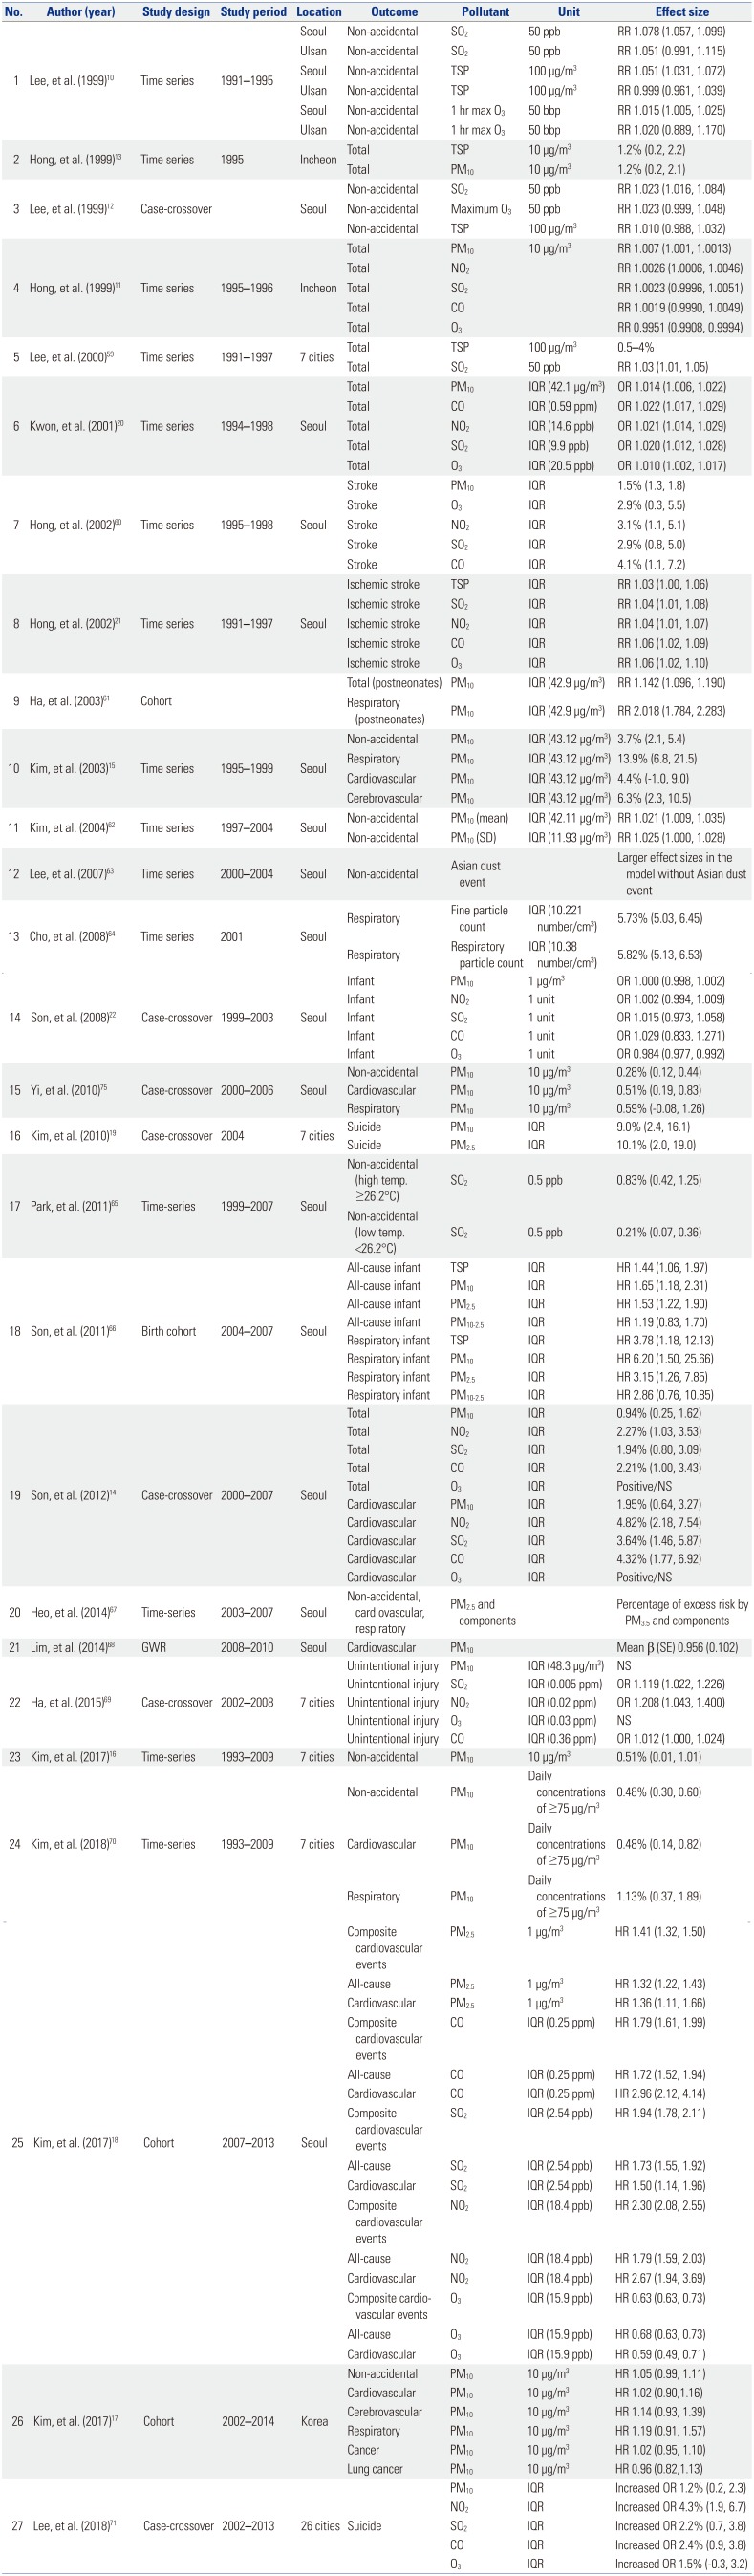
Among the included studies, the earliest reports regarding an association between air pollution and mortality in Korea were published in 1999.10111213 Three of these were time series studies and one was a case-crossover study. Both time series and case-crossover designs are suitable for analysis of acute effects (in days) of short-term exposure to air pollution. One time series analysis was conducted in Seoul and Ulsan. That study reported that the daily variation of ambient concentrations of sulfur dioxide (SO2), total suspended particles (TSP), and O3 in Seoul were significantly associated with increased non-accidental mortality.10 In the same year, the results of reanalysis of Seoul data from the previous time series using a case-crossover approach, in which each participant became its own control, were reported, showing that only SO2 was significantly associated with non-accidental mortality.12 Another time series study conducted in Incheon showed that, in addition to TSP, a 10-µg/m3 increase in the daily mean concentration of PM10 was also associated with a 1.2% increase in total mortality.13 The remaining study was the first to examine the effects of all five criteria pollutants [PM10, SO2, NO2, carbon monoxide (CO), and O3] on mortality in Seoul. That study reported that the previous day's concentrations of PM10 and NO2 were significantly associated with increased daily mortality [relative risks (RRs) of 1.0007 and 1.0026 for PM10 and NO2, respectively].11
After 1999, most subsequent studies examined the associations between air pollutants and total or non-accidental mortality using time series analysis and a case-crossover design. However, the effect sizes varied according to different studies. For instance, the percent increase in mortality for an interquartile range (IQR) increment in PM10 ranged between 0.9%14 and 3.7%.15 This may be due to different factors of these studies, including the study period and area, and a multi-city study may provide more robust effect size. There were few multi-city studies and even fewer reported associations with total mortality. The most recent such study stated that a 10-µg/m3 increase in daily ambient PM10 was associated with a 0.51% increase in mortality.16
The effects of air pollution are not only acute but also chronic, and long-term exposure is generally expected to have a much higher effect size than short-term exposure. However, the chronic effect of air pollution has rarely been examined in Korea. In fact, there were only two studies reporting long-term effects of PM exposure on mortality among our search results, one each for PM10 and PM2.5. Kim, et al.17 analyzed a sample cohort of the National Health Insurance Service and reported a marginally significant 5% increase in mortality per a 10-µg/m3 increase in annual PM10 concentration. Another study reported a hazard ratio (HR) of 1.32 for all-cause mortality with an increment of 1 µg/m3 in PM2.5.18 Long-term exposure to other gaseous pollutants was also found to be associated with increased risk of mortality, and CO, SO2, and NO2 showed HRs of 1.72, 1.73, and 1.79 for each IQR increase, respectively.
The effect of air pollution exposure on mortality is cause-specific, and the related cardiovascular and respiratory effects are well known. There have been several reports on cardiovascular and respiratory mortality owing to air pollution in Korea. An interesting cause of death that shows an association with air pollution is suicide. In a case-crossover study conducted using data from seven metropolitan cities in Korea (Seoul, Incheon, Daejeon, Gwangju, Daegu, Busan, and Ulsan), the authors reported that an IQR increase of PM2.5 was associated with a 10.1% increase in the number of suicides.19
Most gaseous air pollutants (SO2, NO2, and CO) showed consistently significant associations with increased mortality. For acute exposure, an IQR increase of SO2, NO2, and CO increased daily mortality about 2%, and an IQR increase in chronic exposure to those three pollutants showed consistent RRs of around 1.7 (Table 1). However, the association between ambient O3 concentration and mortality seems inconclusive. Two studies reported significant positive associations of O3 concentration with total mortality20 and ischemic stroke mortality.21 However, we also found reports of significant negative associations with all-cause,1318 cardiovascular,18 and infant mortality.22

Air pollution and morbidity

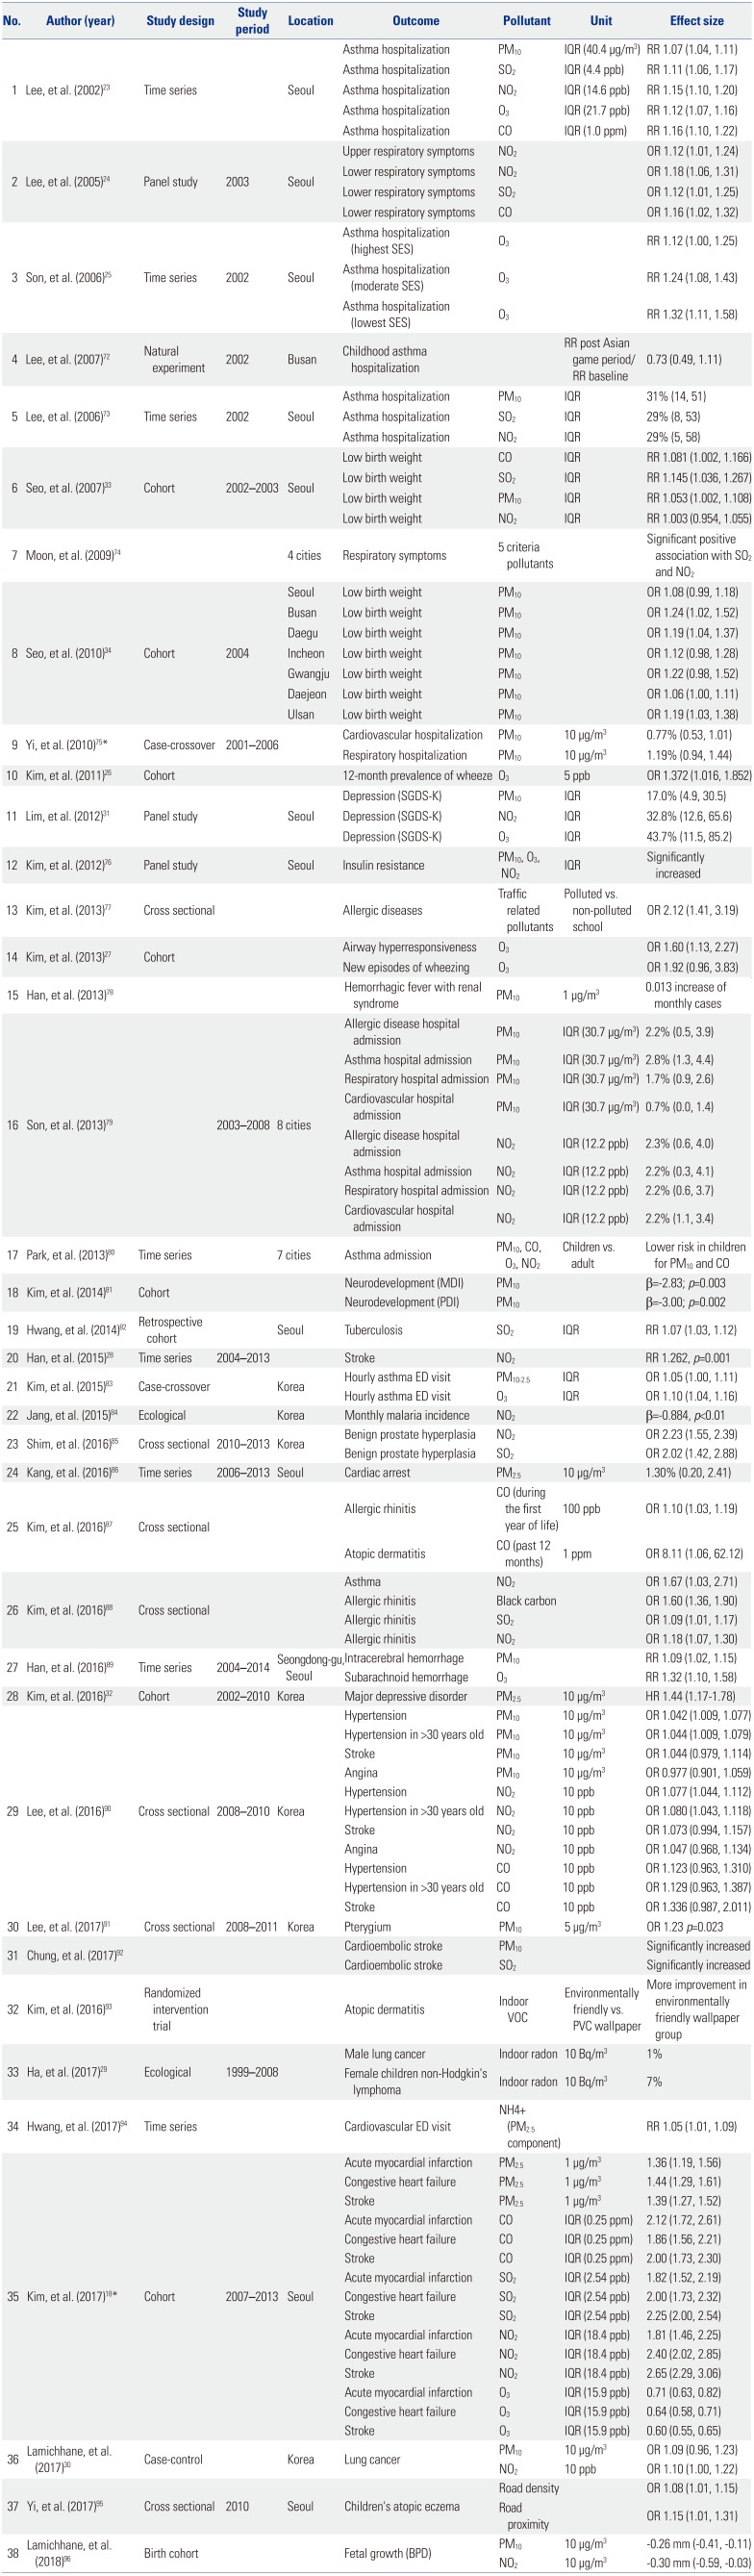
Asthma and respiratory diseases were among the first specific disorders analyzed in Korea. A time series analysis conducted in Seoul reported that an IQR increase in PM10, SO2, NO2, CO, and O3 showed significant RRs for children's asthma hospitalization of 1.07, 1.11, 1.15, 1.16 and 1.12, respectively.23 Another study reported the results of a children's panel for NO2 exposure showing an OR of 1.12 for upper respiratory symptoms and ORs for lower respiratory symptoms of 1.18, 1.12, and 1.16 for increased exposures to NO2, SO2, and CO, respectively.24 O3 was also associated with children's asthma hospitalization, especially in groups with lower socioeconomic status (RR: 1.32, 95% CI: 1.11, 1.58).25 In a cohort study, O3 concentration was associated with a 12-month prevalence of wheeze26 and airway hyperresponsiveness27 in children. Other allergic disorders, such as allergic rhinitis and atopic dermatitis, were also associated with air pollution (Table 2).
Similar to the association between air pollution and cardiovascular mortality, the morbidity of cardiovascular and cerebrovascular diseases, such as stroke, myocardial infarction, and hypertension, were also significantly associated with increased exposure to air pollution. A time series analysis reported that NO2 increased stroke (RR=1.2, p-value=0.001),28 and a cohort study reported that long-term exposure to PM2.5, CO, SO2, and NO2 increased the risk of acute myocardial infarction, congestive heart failure, and stroke (Table 2).18
We found two studies examining the association of air pollution with cancer. In these recent studies, indoor radon concentrations were associated with an increased risk of male lung cancer and non-Hodgkin's lymphoma in girls,29 and conventional air pollutants (PM10 and NO2) were associated with lung cancer with marginal significance.30
Similar to the association of suicide with air pollution, depressive symptoms were also found to be associated with air pollution in Korea. A panel study examining air pollution and depressive symptoms was one of the first to report such an association.31 An association between PM2.5 and major depressive disorder was also found in a community-based urban cohort.32
Birth outcome has been another subject of analysis. PM10, SO2, and CO exposures were reported to have significant associations with low birth weight in a cohort study.3334

Health impact assessment

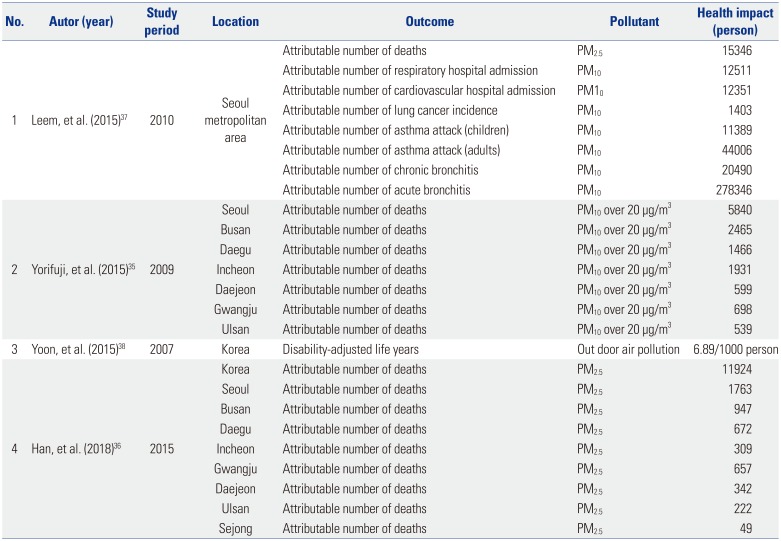
Among four studies (Table 3), two calculated the attributable number of deaths,3536 one calculated the attributable number of deaths and morbidity,37 and a fourth calculated DALYs.38
There were substantial differences in the attributable number of deaths among the study results. For instance, Leem, et al.37 estimated the number of deaths attributable to PM2.5 to be 15346 in the Seoul metropolitan area, whereas Han, et al.36 estimated this number to be 1763. Yorifuji, et al.35 estimated the number of deaths attributable to PM10 over 20 µg/m3 at 5840 in Seoul. These numbers are substantially different, even when considering the differences in study area, study period, and pollutants investigated.

DISCUSSION

Beginning in 1999, many studies have been conducted to elucidate the health effects of air pollution in Korea. These studies have reported associations with mortality (all-cause, respiratory, cerebrovascular, cardiovascular, infant, injury, and suicide) and morbidity (allergic, respiratory, cardiovascular, cerebrovascular, adverse birth outcomes, depression, and cancer). Most studies examined the short-term effects of air pollution using a time series or case-crossover study design; we found only three cohort studies that examined long-term effects. There were four studies that estimated the health impacts of air pollution, and except for one study that reported DALYs, three studies had inconsistent estimations of the attributable number of deaths.
Estimating health impacts is usually conducted later than other research as previously estimated associations between exposure and outcome, or concentration-response function (C-R function) are required.39 Naturally, the estimated health impact depends on the C-R function used. We suspect that differences in the attributable number of deaths estimated in the three studies reviewed here is partly due to the different C-R functions applied by the authors. Specifically, Yorifuji, et al.35 and Leem, et al.37 used C-R functions for mortality derived from epidemiological studies conducted in the United States (U.S.), whereas Han, et al.36 used an IER function developed for the Global Burden of Disease 2010 and 2013. The C-R function derived from U.S. studies only accounted for a relatively low level of PM; thus, it may be inadequate for estimation of health impacts in Korea where exposure to higher concentrations of PM is observed. The IER function was developed by integrating various C-R functions of other exposures, such as tobacco smoke and burning of indoor solid fuel, to fill the gap in exposure range.36 However, it remains uncertain whether the C-R function is comparable to the higher exposure range observed in Korea. Considering this, it is important to produce C-R functions using Korean data to accurately estimate the health impacts of exposure to air pollution.
As mentioned above, the effect of air pollution exposure can be divided into short-term and long-term effects. Typically, short-term effects are examined using time series and case-crossover studies, and long-term effects are investigated in cohort studies. The most recent time series study in Korea reported a 0.51% increase in mortality for each 10-µg/m3 increase in PM10.16 This is comparable to the results of a recent meta-analysis of studies from East Asian cities, including Seoul and Incheon, which reported a 0.47% increase in total mortality for the same amount of increase in PM10.40 Similarly, although we could not find health impact assessment studies regarding air pollutants other than PM, we believe that previous epidemiological studies can provide relatively robust C-R functions for NO2 and SO2 to estimate health impacts.
Previous studies have reported inconsistent associations between O3 exposure and mortality. Some published studies have reported a negative association, and the cause of this negative association has been an intriguing subject for additional analysis. One hypothesis is that the C-R function between O3 concentration and mortality is not linear.41 Time series analyses conducted in Korea and Japan support this hypothesis in short-term associations.4243 However, such non-linearity has not been observed in other studies,4445 and the shape of the C-R function between O3 concentration and acute mortality is still controversial. Nevertheless, studies analyzing the C-R function for long-term exposure of O3 and mortality consistently report no evidence of a threshold.4647 However, these studies may not have accounted for lower concentrations of O3; this may be the reason for not observing a non-linear association, as the reported threshold of non-linear associations tends to be at lower concentrations. The negative association reported in a cohort study conducted by Kim, et al.18 may suggest the existence of a non-linear C-R function between long-term exposure to O3 and mortality because Korea has lower concentrations of O3 than the U.S.;43 however, no analysis has been conducted using Korean data, as far as we know.
Among the two cohort studies on air pollution and mortality, one study examined the long-term health effects of PM2.5 exposure. Although it is a valuable addition to the current knowledge, the results of that study seem inconsistent with previous reports. For instance, Kim, et al.18 reported an HR of 1.32 for all-cause mortality for a 1-µg/m3 increment of PM2.5 in a cohort constructed using the National Health Insurance Service database, and a recent U.S. study analyzing a cohort constructed from a Medicare database reported an HR of 1.073 for a 10-µg/m3 increment of PM2.5.47 Kim, et al.18 suggested possible differences in the effect and composition of PM2.5, genetic characteristics, and range of exposure between these studies, although we find a more than 30-fold greater HR difficult to explain. The largest difference between these two studies was in exposure assessment. Kim, et al.18 linked the concentration measured at a fixed monitoring station to the addresses of participants, whereas Di, et al.47 used a model-based estimation of individual exposure. Another cohort study examined the long-term effect of PM10 exposure.17 Those authors reported similar effects for PM10 exposure, although the association was not statistically significant. However, this latter study applied an exposure assessment strategy, which could alleviate the effect of misclassification caused by participant mobility and exposure measurement at fixed monitoring stations.
Conventionally, air pollution studies use concentrations measured at fixed monitoring stations for exposure, which is an advantage for providing a large amount of data for a wide range of pollutants. However, data linked to study participants' addresses may not reflect individual exposure, especially when the mobility pattern of individuals is not accounted for.48 This limitation may lead to misclassification, which may have substantial implications for the interpretation of results.49 In recent years, advanced sensor and modeling technologies have facilitated individual exposure measurement in air pollution studies with the use of personal sensors and various exposure models based on dispersion models, geographical information, and satellite images.485051 Estimation of exposure using these methods in Korea has been reported recently,52 and these individual exposure estimation methods should be applied in future studies to reduce uncertainty.
In addition to observational studies, there have been many intervention studies on air pollution and its health effects. Recent intervention studies have explored the benefits of exposure reduction using devices, such as an air purifier5354 and facemasks,55 in randomized controlled trials. The strength of intervention studies is two-fold: First, intervention studies may provide more robust evidence regarding the health effects of exposure to air pollution. Second, these trials may provide evidence regarding the effectiveness of personal measures that can be used to reduce the effects of air pollution. However, due to ethical and practical limitations, randomized controlled trials can only be applied to evaluate acute effects of exposure to air pollution. For instance, it may be unfeasible and unethical to design a study in which a portion of study participants are asked to wear facemasks for a long period (e.g., years). Causal modeling is a method that has been proposed to mitigate the shortcomings of observational studies without the need to conduct a randomized trial. This approach includes marginal structure modeling, instrumental variable analysis, and negative exposure control.56 The causal modeling approach provides associations that are free of confounding under certain assumptions, which can be interpreted as causal, similar to the results of a trial. To date, there had been reports on the causal associations of PM2.5, black carbon, and NO2 in various circumstances.5758 Such experimental studies are necessary so as to correctly assess the effects of air pollution on health and to facilitate more effective interventions through which to reduce exposure and to mitigate the health effects of air pollution.
Finally, despite our best efforts to comprehensively summarize the study results regarding the health effects of air pollution exposure in Korea, it is possible that we did not compile a complete list of all relevant research, which should be considered a limitation of the present review.

CONCLUSION

In the present review, we presented epidemiological studies conducted in Korea examining the health effects of exposure to air pollution. For the past 2 decades, there has been a considerable accumulation of knowledge regarding air pollution and health in Korea. However, the present review highlights that additional studies, especially cohort and experimental studies, are needed to provide more robust and accurate evidence that can be used to promote evidence-based policymaking.

ACKNOWLEDGEMENTS

The present research was conducted by the research fund of Dankook University in 2016.

Notes

AUTHOR CONTRIBUTIONS:

  • Conceptualization: S Bae, H Kwon.

  • Data curation: S Bae.

  • Formal analysis: S Bae.

  • Funding acquisition: H Kwon.

  • Investigation: S Bae, H Kwon.

  • Methodology: S Bae, H Kwon.

  • Project administration: H Kwon.

  • Resources: S Bae, H Kwon.

  • Software: S Bae, H Kwon.

  • Supervision: H Kwon.

  • Validation: S Bae, H Kwon.

  • Visualization: S Bae, H Kwon.

  • Writing—original draft: S Bae, H Kwon.

  • Writing—review & editing: S Bae, H Kwon.

The authors have no potential conflicts of interest to disclose.

References

1. GBD 2016 Risk Factors Collaborators. Global, regional, and national comparative risk assessment of 84 behavioural, environmental and occupational, and metabolic risks or clusters of risks, 1990-2016: a systematic analysis for the Global Burden of Disease Study 2016. Lancet. 2017; 390:1345–1422. PMID: 28919119.
2. National Institute of Environmental Research. Annual report of air quality in Korea 2016. Incheon: National Institute of Environmental Research;2017.
3. Anderson HR, Atkinson RW, Peacock JL, Marston L, Konstantinou K. Meta-analysis of time-series studies and panel studies of particulate matter (PM) and ozone (O3): report of a WHO task group. Copenhagen: WHO Regional Office for Europe;2004.
4. Wong CM, Vichit-Vadakan N, Kan H, Qian Z. Public Health and Air Pollution in Asia (PAPA): a multicity study of short-term effects of air pollution on mortality. Environ Health Perspect. 2008; 116:1195–1202. PMID: 18795163.
crossref
5. Burnett RT, Pope CA 3rd, Ezzati M, Olives C, Lim SS, Mehta S, et al. An integrated risk function for estimating the global burden of disease attributable to ambient fine particulate matter exposure. Environ Health Perspect. 2014; 122:397–403. PMID: 24518036.
crossref
6. Burnett R, Chen H, Szyszkowicz M, Fann N, Hubbell B, Pope CA 3rd, et al. Global estimates of mortality associated with long-term exposure to outdoor fine particulate matter. Proc Natl Acad Sci U S A. 2018; 115:9592–9597. PMID: 30181279.
crossref
7. Levy JI, Diez D, Dou Y, Barr CD, Dominici F. A meta-analysis and multisite time-series analysis of the differential toxicity of major fine particulate matter constituents. Am J Epidemiol. 2012; 175:1091–1099. PMID: 22510275.
crossref
8. Baxter LK, Duvall RM, Sacks J. Examining the effects of air pollution composition on within region differences in PM2.5 mortality risk estimates. J Expo Sci Environ Epidemiol. 2013; 23:457–465. PMID: 23250195.
9. Davis JA, Meng Q, Sacks JD, Dutton SJ, Wilson WE, Pinto JP. Regional variations in particulate matter composition and the ability of monitoring data to represent population exposures. Sci Total Environ. 2011; 409:5129–5135. PMID: 21908016.
crossref
10. Lee JT, Shin D, Chung Y. Air pollution and daily mortality in Seoul and Ulsan, Korea. Environ Health Perspect. 1999; 107:149–154. PMID: 9924011.
crossref
11. Hong YC, Leem JH, Ha EH, Christiani DC. PM10 exposure, gaseous pollutants, and daily mortality in Inchon, South Korea. Environ Health Perspect. 1999; 107:873–878.
12. Lee JT, Schwartz J. Reanalysis of the effects of air pollution on daily mortality in Seoul, Korea: a case-crossover design. Environ Health Perspect. 1999; 107:633–636. PMID: 10417360.
crossref
13. Hong YC, Leem JH, Ha EH. Air pollution and daily mortality in Inchon, Korea. J Korean Med Sci. 1999; 14:239–244. PMID: 10402164.
crossref
14. Son JY, Lee JT, Kim H, Yi O, Bell ML. Susceptibility to air pollution effects on mortality in Seoul, Korea: a case-crossover analysis of individual-level effect modifiers. J Expo Sci Environ Epidemiol. 2012; 22:227–234. PMID: 22395258.
crossref
15. Kim H, Kim Y, Hong YC. The lag-effect pattern in the relationship of particulate air pollution to daily mortality in Seoul, Korea. Int J Biometeorol. 2003; 48:25–30. PMID: 12728364.
crossref
16. Kim SE, Honda Y, Hashizume M, Kan H, Lim YH, Lee H, et al. Seasonal analysis of the short-term effects of air pollution on daily mortality in Northeast Asia. Sci Total Environ. 2017; 576:850–857. PMID: 27833062.
crossref
17. Kim OJ, Kim SY, Kim H. Association between long-term exposure to particulate matter air pollution and mortality in a South Korean National Cohort: comparison across different exposure assessment approaches. Int J Environ Res Public Health. 2017; 14:1103.
crossref
18. Kim H, Kim J, Kim S, Kang SH, Kim HJ, Kim H, et al. Cardiovascular effects of long-terrm exposure to air pollution: a population-based study with 900 845 person-years of follow-up. J Am Heart Assoc. 2017; 6:e007170. PMID: 29118034.
crossref
19. Kim C, Jung SH, Kang DR, Kim HC, Moon KT, Hur NW, et al. Ambient particulate matter as a risk factor for suicide. Am J Psychiatry. 2010; 167:1100–1107. PMID: 20634364.
crossref
20. Kwon HJ, Cho SH, Nyberg F, Pershagen G. Effects of ambient air pollution on daily mortality in a cohort of patients with congestive heart failure. Epidemiology. 2001; 12:413–419. PMID: 11416779.
crossref
21. Hong YC, Lee JT, Kim H, Kwon HJ. Air pollution: a new risk factor in ischemic stroke mortality. Stroke. 2002; 33:2165–2169. PMID: 12215581.
22. Son JY, Cho YS, Lee JT. Effects of air pollution on postneonatal infant mortality among firstborn infants in Seoul, Korea: case-crossover and time-series analyses. Arch Environ Occup Health. 2008; 63:108–113. PMID: 18980873.
crossref
23. Lee JT, Kim H, Song H, Hong YC, Cho YS, Shin SY, et al. Air pollution and asthma among children in Seoul, Korea. Epidemiology. 2002; 13:481–484. PMID: 12094105.
crossref
24. Lee BE, Ha EH, Park HS, Kim H, Lee HJ, Lee YK, et al. [Air pollution and respiratory symptoms of school children in a panel study in Seoul]. J Prev Med Public Health. 2005; 38:465–472. PMID: 16358834.
25. Son JY, Kim H, Lee JT, Kim SY. [Relationship between the exposure to ozone in Seoul and the childhood asthma-related hospital admissions according to the socioeconomic status]. J Prev Med Public Health. 2006; 39:81–86. PMID: 16613076.
26. Kim BJ, Kwon JW, Seo JH, Kim HB, Lee SY, Park KS, et al. Association of ozone exposure with asthma, allergic rhinitis, and allergic sensitization. Ann Allergy Asthma Immunol. 2011; 107:214–219. PMID: 21875539.
crossref
27. Kim BJ, Seo JH, Jung YH, Kim HY, Kwon JW, Kim HB, et al. Air pollution interacts with past episodes of bronchiolitis in the development of asthma. Allergy. 2013; 68:517–523. PMID: 23347096.
crossref
28. Han MH, Yi HJ, Kim YS, Kim YS. Effect of seasonal and monthly variation in weather and air pollution factors on stroke incidence in Seoul, Korea. Stroke. 2015; 46:927–935. PMID: 25669311.
crossref
29. Ha M, Hwang SS, Kang S, Park NW, Chang BU, Kim Y. Geographical correlations between indoor radon concentration and risks of lung cancer, non-Hodgkin’s lymphoma, and leukemia during 1999-2008 in Korea. Int J Environ Res Public Health. 2017; 14:344.
crossref
30. Lamichhane DK, Kim HC, Choi CM, Shin MH, Shim YM, Leem JH, et al. Lung cancer risk and residential exposure to air pollution: a Korean population-based case-control study. Yonsei Med J. 2017; 58:1111–1118. PMID: 29047234.
crossref
31. Lim YH, Kim H, Kim JH, Bae S, Park HY, Hong YC. Air pollution and symptoms of depression in elderly adults. Environ Health Perspect. 2012; 120:1023–1028. PMID: 22514209.
crossref
32. Kim KN, Lim YH, Bae HJ, Kim M, Jung K, Hong YC. Long-term fine particulate matter exposure and major depressive disorder in a community-based urban cohort. Environ Health Perspect. 2016; 124:1547–1553. PMID: 27129131.
crossref
33. Seo JH, Ha EH, Kim OJ, Kim BM, Park HS, Leem JH, et al. [Environmental health surveillance of low birth weight in Seoul using air monitoring and birth data]. J Prev Med Public Health. 2007; 40:363–370. PMID: 17917484.
crossref
34. Seo JH, Leem JH, Ha EH, Kim OJ, Kim BM, Lee JY, et al. Population-attributable risk of low birthweight related to PM10 pollution in seven Korean cities. Paediatr Perinat Epidemiol. 2010; 24:140–148. PMID: 20415770.
35. Yorifuji T, Bae S, Kashima S, Tsuda T, Doi H, Honda Y, et al. Health impact assessment of PM10 and PM2.5 in 27 Southeast and East Asian cities. J Occup Environ Med. 2015; 57:751–756. PMID: 26147543.
36. Han C, Kim S, Lim YH, Bae HJ, Hong YC. Spatial and temporal trends of number of deaths attributable to ambient PM2.5 in the Korea. J Korean Med Sci. 2018; 33:e193. PMID: 30034305.
crossref
37. Leem JH, Kim ST, Kim HC. Public-health impact of outdoor air pollution for 2nd air pollution management policy in Seoul metropolitan area, Korea. Ann Occup Environ Med. 2015; 27:7. PMID: 25866666.
crossref
38. Yoon SJ, Kim HS, Ha J, Kim EJ. Measuring the environmental burden of disease in South Korea: a population-based study. Int J Environ Res Public Health. 2015; 12:7938–7948. PMID: 26184265.
crossref
39. Künzli N, Kaiser R, Medina S, Studnicka M, Chanel O, Filliger P, et al. Public-health impact of outdoor and traffic-related air pollution: a European assessment. Lancet. 2000; 356:795–801. PMID: 11022926.
crossref
40. Park HY, Bae S, Hong YC. PM10 exposure and non-accidental mortality in Asian populations: a meta-analysis of time-series and case-crossover studies. J Prev Med Public Health. 2013; 46:10–18. PMID: 23407325.
41. Moolgavkar SH, McClellan RO, Dewanji A, Turim J, Luebeck EG, Edwards M. Time-series analyses of air pollution and mortality in the United States: a subsampling approach. Environ Health Perspect. 2013; 121:73–78. PMID: 23108284.
crossref
42. Kim SY, Lee JT, Hong YC, Ahn KJ, Kim H. Determining the threshold effect of ozone on daily mortality: an analysis of ozone and mortality in Seoul, Korea, 1995-1999. Environ Res. 2004; 94:113–119. PMID: 14757374.
crossref
43. Bae S, Lim YH, Kashima S, Yorifuji T, Honda Y, Kim H, et al. Non-linear concentration-response relationships between ambient ozone and daily mortality. PLoS One. 2015; 10:e0129423. PMID: 26076447.
crossref
44. Bell ML, Peng RD, Dominici F. The exposure-response curve for ozone and risk of mortality and the adequacy of current ozone regulations. Environ Health Perspect. 2006; 114:532–536. PMID: 16581541.
crossref
45. Atkinson RW, Yu D, Armstrong BG, Pattenden S, Wilkinson P, Doherty RM, et al. Concentration-response function for ozone and daily mortality: results from five urban and five rural U.K. populations. Environ Health Perspect. 2012; 120:1411–1417. PMID: 22814173.
crossref
46. Jerrett M, Burnett RT, Pope CA 3rd, Ito K, Thurston G, Krewski D, et al. Long-term ozone exposure and mortality. N Engl J Med. 2009; 360:1085–1095. PMID: 19279340.
crossref
47. Di Q, Wang Y, Zanobetti A, Wang Y, Koutrakis P, Choirat C, et al. Air pollution and mortality in the medicare population. N Engl J Med. 2017; 376:2513–2522. PMID: 28657878.
crossref
48. Steinle S, Reis S, Sabel CE. Quantifying human exposure to air pollution--moving from static monitoring to spatio-temporally resolved personal exposure assessment. Sci Total Environ. 2013; 443:184–193. PMID: 23183229.
crossref
49. Zeger SL, Thomas D, Dominici F, Samet JM, Schwartz J, Dockery D, et al. Exposure measurement error in time-series studies of air pollution: concepts and consequences. Environ Health Perspect. 2000; 108:419–426. PMID: 10811568.
crossref
50. Zou B, Wilson JG, Zhan FB, Zeng Y. Air pollution exposure assessment methods utilized in epidemiological studies. J Environ Monit. 2009; 11:475–490. PMID: 19280026.
crossref
51. van Donkelaar A, Martin RV, Brauer M, Boys BL. Use of satellite observations for long-term exposure assessment of global concentrations of fine particulate matter. Environ Health Perspect. 2015; 123:135–143. PMID: 25343779.
crossref
52. Kim SY, Song I. National-scale exposure prediction for long-term concentrations of particulate matter and nitrogen dioxide in South Korea. Environ Pollut. 2017; 226:21–29. PMID: 28399503.
crossref
53. Li H, Cai J, Chen R, Zhao Z, Ying Z, Wang L, et al. Particulate matter exposure and stress hormone levels: a randomized, double-blind, crossover trial of air purification. Circulation. 2017; 136:618–627. PMID: 28808144.
crossref
54. Morishita M, Adar SD, D’Souza J, Ziemba RA, Bard RL, Spino C, et al. Effect of portable air filtration systems on personal exposure to fine particulate matter and blood pressure among residents in a low-income senior facility: a randomized clinical trial. JAMA Intern Med. 2018; 178:1350–1357. PMID: 30208394.
55. Guan T, Hu S, Han Y, Wang R, Zhu Q, Hu Y, et al. The effects of facemasks on airway inflammation and endothelial dysfunction in healthy young adults: a double-blind, randomized, controlled crossover study. Part Fibre Toxicol. 2018; 15:30. PMID: 29973251.
crossref
56. Schwartz J, Austin E, Bind MA, Zanobetti A, Koutrakis P. Estimating causal associations of fine particles with daily deaths in Boston. Am J Epidemiol. 2015; 182:644–650. PMID: 26346544.
57. Schwartz J, Bind MA, Koutrakis P. Estimating causal effects of local air pollution on daily deaths: effect of low levels. Environ Health Perspect. 2017; 125:23–29. PMID: 27203595.
crossref
58. Schwartz J, Fong K, Zanobetti A. A national multicity analysis of the causal effect of local pollution, NO2, and PM2.5 on mortality. Environ Health Perspect. 2018; 126:087004.
59. Lee JT, Kim H, Hong YC, Kwon HJ, Schwartz J, Christiani DC. Air pollution and daily mortality in seven major cities of Korea, 1991-1997. Environ Res. 2000; 84:247–254. PMID: 11097798.
crossref
60. Hong YC, Lee JT, Kim H, Ha EH, Schwartz J, Christiani DC. Effects of air pollutants on acute stroke mortality. Environ Health Perspect. 2002; 110:187–191. PMID: 11836148.
crossref
61. Ha EH, Lee JT, Kim H, Hong YC, Lee BE, Park HS, et al. Infant susceptibility of mortality to air pollution in Seoul, South Korea. Pediatrics. 2003; 111:284–290. PMID: 12563052.
crossref
62. Kim H, Lee JT, Hong YC, Yi SM, Kim Y. Evaluating the effect of daily PM10 variation on mortality. Inhal Toxicol. 2004; 16(Suppl 1):55–58. PMID: 15204793.
63. Lee JT, Son JY, Cho YS. A comparison of mortality related to urban air particles between periods with Asian dust days and without Asian dust days in Seoul, Korea, 2000-2004. Environ Res. 2007; 105:409–413. PMID: 17659273.
crossref
64. Cho YS, Lee JT, Jung CH, Chun YS, Kim YS. Relationship between particulate matter measured by optical particle counter and mortality in Seoul, Korea, during 2001. J Environ Health. 2008; 71:37–43. PMID: 18807823.
65. Park AK, Hong YC, Kim H. Effect of changes in season and temperature on mortality associated with air pollution in Seoul, Korea. J Epidemiol Community Health. 2011; 65:368–375. PMID: 20696849.
crossref
66. Son JY, Bell ML, Lee JT. Survival analysis of long-term exposure to different sizes of airborne particulate matter and risk of infant mortality using a birth cohort in Seoul, Korea. Environ Health Perspect. 2011; 119:725–730. PMID: 21169127.
crossref
67. Heo J, Schauer JJ, Yi O, Paek D, Kim H, Yi SM. Fine particle air pollution and mortality: importance of specific sources and chemical species. Epidemiology. 2014; 25:379–388. PMID: 24718091.
68. Lim YR, Bae HJ, Lim YH, Yu S, Kim GB, Cho YS. Spatial analysis of PM10 and cardiovascular mortality in the Seoul metropolitan area. Environ Health Toxicol. 2014; 29:e2014005. PMID: 25116367.
69. Ha KH, Cho J, Cho SK, Kim C, Shin DC. Air pollution and unintentional injury deaths in South Korea. Environ Sci Pollut Res Int. 2015; 22:7873–7881. PMID: 25598159.
crossref
70. Kim SE, Bell ML, Hashizume M, Honda Y, Kan H, Kim H. Associations between mortality and prolonged exposure to elevated particulate matter concentrations in East Asia. Environ Int. 2018; 110:88–94. PMID: 29097051.
crossref
71. Lee H, Myung W, Kim SE, Kim DK, Kim H. Ambient air pollution and completed suicide in 26 South Korean cities: effect modification by demographic and socioeconomic factors. Sci Total Environ. 2018; 639:944–951. PMID: 29929333.
crossref
72. Lee JT, Son JY, Cho YS. Benefits of mitigated ambient air quality due to transportation control on childhood asthma hospitalization during the 2002 summer Asian games in Busan, Korea. J Air Waste Manag Assoc. 2007; 57:968–973. PMID: 17824287.
crossref
73. Lee JT, Son JY, Kim H, Kim SY. Effect of air pollution on asthma-related hospital admissions for children by socioeconomic status associated with area of residence. Arch Environ Occup Health. 2006; 61:123–130. PMID: 17672354.
crossref
74. Moon JS, Kim YS, Kim JH, Son BS, Kim DS, Yang W. Respiratory health effects among schoolchildren and their relationship to air pollutants in Korea. Int J Environ Health Res. 2009; 19:31–48. PMID: 19241245.
crossref
75. Yi O, Hong YC, Kim H. Seasonal effect of PM10 concentrations on mortality and morbidity in Seoul, Korea: a temperature-matched case-crossover analysis. Environ Res. 2010; 110:89–95. PMID: 19819431.
76. Kim JH, Hong YC. GSTM1, GSTT1, and GSTP1 polymorphisms and associations between air pollutants and markers of insulin resistance in elderly Koreans. Environ Health Perspect. 2012; 120:1378–1384. PMID: 22732554.
77. Kim HH, Lee CS, Jeon JM, Yu SD, Lee CW, Park JH, et al. Analysis of the association between air pollution and allergic diseases exposure from nearby sources of ambient air pollution within elementary school zones in four Korean cities. Environ Sci Pollut Res Int. 2013; 20:4831–4846. PMID: 23299970.
crossref
78. Han SS, Kim S, Choi Y, Kim S, Kim YS. Air pollution and hemorrhagic fever with renal syndrome in South Korea: an ecological correlation study. BMC Public Health. 2013; 13:347. PMID: 23587219.
crossref
79. Son JY, Lee JT, Park YH, Bell ML. Short-term effects of air pollution on hospital admissions in Korea. Epidemiology. 2013; 24:545–554. PMID: 23676269.
crossref
80. Park M, Luo S, Kwon J, Stock TH, Delclos G, Kim H, et al. Effects of air pollution on asthma hospitalization rates in different age groups in metropolitan cities of Korea. Air Qual Atmos Health. 2013; 6:543–551.
crossref
81. Kim E, Park H, Hong YC, Ha M, Kim Y, Kim BN, et al. Prenatal exposure to PM10 and NO2 and children’s neurodevelopment from birth to 24 months of age: mothers and Children’s Environmental Health (MOCEH) study. Sci Total Environ. 2014; 481:439–445. PMID: 24631606.
82. Hwang SS, Kang S, Lee JY, Lee JS, Kim HJ, Han SK, et al. Impact of outdoor air pollution on the incidence of tuberculosis in the Seoul metropolitan area, South Korea. Korean J Intern Med. 2014; 29:183–190. PMID: 24648801.
crossref
83. Kim J, Kim H, Kweon J. Hourly differences in air pollution on the risk of asthma exacerbation. Environ Pollut. 2015; 203:15–21. PMID: 25845357.
crossref
84. Jang JH, Lee JH, Je MK, Cho MJ, Bae YM, Son HS, et al. Correlations between the incidence of national notifiable infectious diseases and public open data, including meteorological factors and medical facility resources. J Prev Med Public Health. 2015; 48:203–215. PMID: 26265666.
crossref
85. Shim SR, Kim JH, Song YS, Lee WJ. Association between air pollution and benign prostatic hyperplasia: an ecological study. Arch Environ Occup Health. 2016; 71:289–292. PMID: 26378867.
crossref
86. Kang SH, Heo J, Oh IY, Kim J, Lim WH, Cho Y, et al. Ambient air pollution and out-of-hospital cardiac arrest. Int J Cardiol. 2016; 203:1086–1092. PMID: 26646382.
crossref
87. Kim J, Han Y, Seo SC, Lee JY, Choi J, Kim KH, et al. Association of carbon monoxide levels with allergic diseases in children. Allergy Asthma Proc. 2016; 37:e1–e7. PMID: 26831837.
crossref
88. Kim HH, Lee CS, Yu SD, Lee JS, Chang JY, Jeon JM, et al. Near-road exposure and impact of air pollution on allergic diseases in elementary school children: a cross-sectional study. Yonsei Med J. 2016; 57:698–713. PMID: 26996571.
crossref
89. Han MH, Yi HJ, Ko Y, Kim YS, Lee YJ. Association between hemorrhagic stroke occurrence and meteorological factors and pollutants. BMC Neurol. 2016; 16:59. PMID: 27146603.
crossref
90. Lee WH, Choo JY, Son JY, Kim H. Association between long-term exposure to air pollutants and prevalence of cardiovascular disease in 108 South Korean communities in 2008-2010: a cross-sectional study. Sci Total Environ. 2016; 565:271–278. PMID: 27177133.
crossref
91. Lee KW, Choi YH, Hwang SH, Paik HJ, Kim MK, Wee WR, et al. Outdoor air pollution and pterygium in Korea. J Korean Med Sci. 2017; 32:143–150. PMID: 27914144.
crossref
92. Chung JW, Bang OY, Ahn K, Park SS, Park TH, Kim JG, et al. Air pollution is associated with ischemic stroke via cardiogenic embolism. Stroke. 2017; 48:17–23. PMID: 27899751.
crossref
93. Kim J, Kim H, Lim D, Lee YK, Kim JH. Effects of indoor air pollutants on atopic dermatitis. Int J Environ Res Public Health. 2016; 13:1220.
crossref
94. Hwang SH, Lee JY, Yi SM, Kim H. Associations of particulate matter and its components with emergency room visits for cardiovascular and respiratory diseases. PLoS One. 2017; 12:e0183224. PMID: 28813509.
crossref
95. Yi SJ, Shon C, Min KD, Kim HC, Leem JH, Kwon HJ, et al. Association between exposure to traffic-related air pollution and prevalence of allergic diseases in children, Seoul, Korea. Biomed Res Int. 2017; 2017:4216107. PMID: 29057259.
crossref
96. Lamichhane DK, Ryu J, Leem JH, Ha M, Hong YC, Park H, et al. Air pollution exposure during pregnancy and ultrasound and birth measures of fetal growth: a prospective cohort study in Korea. Sci Total Environ. 2018; 619-620:834–841. PMID: 29734629.
crossref
Fig. 1

Selection of papers.

ymj-60-243-g001
Table 1

Epidemiological Studies on Air Pollution and Mortality in Korea between 1999 and 2018

ymj-60-243-i001
No. Author (year) Study design Study period Location Outcome Pollutant Unit Effect size
1 Lee, et al. (1999)10 Time series 1991–1995 Seoul Non-accidental SO2 50 ppb RR 1.078 (1.057, 1.099)
Ulsan Non-accidental SO2 50 ppb RR 1.051 (0.991, 1.115)
Seoul Non-accidental TSP 100 μg/m3 RR 1.051 (1.031, 1.072)
Ulsan Non-accidental TSP 100 μg/m3 RR 0.999 (0.961, 1.039)
Seoul Non-accidental 1 hr max O3 50 bbp RR 1.015 (1.005, 1.025)
Ulsan Non-accidental 1 hr max O3 50 bbp RR 1.020 (0.889, 1.170)
2 Hong, et al. (1999)13 Time series 1995 Incheon Total TSP 10 μg/m3 1.2% (0.2, 2.2)
Total PM10 10 μg/m3 1.2% (0.2, 2.1)
3 Lee, et al. (1999)12 Case-crossover Seoul Non-accidental SO2 50 ppb RR 1.023 (1.016, 1.084)
Non-accidental Maximum O3 50 ppb RR 1.023 (0.999, 1.048)
Non-accidental TSP 100 μg/m3 RR 1.010 (0.988, 1.032)
4 Hong, et al. (1999)11 Time series 1995–1996 Incheon Total PM10 10 μg/m3 RR 1.007 (1.001, 1.0013)
Total NO2 RR 1.0026 (1.0006, 1.0046)
Total SO2 RR 1.0023 (0.9996, 1.0051)
Total CO RR 1.0019 (0.9990, 1.0049)
Total O3 RR 0.9951 (0.9908, 0.9994)
5 Lee, et al. (2000)59 Time series 1991–1997 7 cities Total TSP 100 μg/m3 0.5–4%
Total SO2 50 ppb RR 1.03 (1.01, 1.05)
6 Kwon, et al. (2001)20 Time series 1994–1998 Seoul Total PM10 IQR (42.1 μg/m3) OR 1.014 (1.006, 1.022)
Total CO IQR (0.59 ppm) OR 1.022 (1.017, 1.029)
Total NO2 IQR (14.6 ppb
Total SO2 IQR (9.9 ppb) OR 1.020 (1.012, 1.028)
Total O3 IQR (20.5 ppb) OR 1.010 (1.002, 1.017)
7 Hong, et al. (2002)60 Time series 1995–1998 Seoul Stroke PM10 IQR 1.5% (1.3, 1.8)
Stroke O3 IQR 2.9% (0.3, 5.5)
Stroke NO2 IQR 3.1% (1.1, 5.1)
Stroke SO2 IQR 2.9% (0.8, 5.0)
Stroke CO IQR 4.1% (1.1, 7.2)
8 Hong, et al. (2002)21 Time series 1991–1997 Seoul Ischemic stroke TSP IQR RR 1.03 (1.00, 1.06)
Ischemic stroke SO2 RR 1.04 (1.01, 1.08)
Ischemic stroke NO2 IQR RR 1.04 (1.01, 1.07)
Ischemic stroke CO IQR RR 1.06 (1.02, 1.09)
Ischemic stroke O3 IQR RR 1.06 (1.02, 1.10)
9 Ha, et al. (2003)61 Cohort Total (postneonates) PM10 IQR (42.9 μg/m3) RR 1.142 (1.096, 1.190)
Respiratory (postneonates) PM10 IQR (42.9 μg/m3) RR 2.018 (1.784, 2.283)
10 Kim, et al. (2003)15 Time series 1995–1999 Seoul Non-accidental PM10 IQR (43.12 μg/m3) 3.7% (2.1, 5.4)
Respiratory PM10 IQR (43.12 μg/m3) 13.9% (6.8, 21.5)
Cardiovascular PM10 IQR (43.12 μg/m3) 4.4% (-1.0, 9.0)
Cerebrovascular PM10 IQR (43.12 μg/m3) 6.3% (2.3, 10.5)
11 Kim, et al. (2004)62 Time series 1997–2004 Seoul Non-accidental PM10 (mean) IQR (42.11 μg/m3) RR 1.021 (1.009, 1.035)
Non-accidental PM10 (SD) IQR (11.93 μg/m3) RR 1.025 (1.000, 1.028)
12 Lee, et al. (2007)63 Time series 2000–2004 Seoul Non-accidental Asian dust event Larger effect sizes in the model without Asian dust event
13 Cho, et al. (2008)64 Time series 2001 Seoul Respiratory Fine particle count IQR (10.221 number/cm3) 5.73% (5.03, 6.45)
Respiratory Respiratory particle count IQR (10.38 number/cm3) 5.82% (5.13, 6.53)
14 Son, et al. (2008)22 Case-crossover 1999–2003 Seoul Infant PM10 1 μg/m3 OR 1.000 (0.998, 1.002)
Infant NO2 1 unit OR 1.002 (0.994, 1.009)
Infant SO2 1 unit OR 1.015 (0.973, 1.058)
Infant CO 1 unit OR 1.029 (0.833, 1.271)
Infant O3 1 unit OR 0.984 (0.977, 0.992)
15 Yi, et al. (2010)75 Case-crossover 2000–2006 Seoul Non-accidental PM10 10 μg/m3 0.28% (0.12, 0.44)
Cardiovascular PM10 10 μg/m3 0.51% (0.19, 0.83)
Respiratory PM10 10 μg/m3 0.59% (-0.08, 1.26)
16 Kim, et al. (2010)19 Case-crossover 2004 7 cities Suicide PM10 IQR 9.0% (2.4, 16.1)
Suicide PM2.5 IQR 10.1% (2.0, 19.0)
17 Park, et al. (2011)65 Time-series 1999–2007 Seoul Non-accidental (high temp. ≥26.2℃) SO2 0.5 ppb 0.83% (0.42, 1.25)
Non-accidental (low temp. <26.2℃) SO2 0.5 ppb 0.21% (0.07, 0.36)
18 Son, et al. (2011)66 Birth cohort 2004–2007 Seoul All-cause infant TSP IQR HR 1.44 (1.06, 1.97)
All-cause infant PM10 IQR HR 1.65 (1.18, 2.31)
All-cause infant PM2.5 IQR HR 1.53 (1.22, 1.90)
All-cause infant PM10-2.5 IQR HR 1.19 (0.83, 1.70)
Respiratory infant TSP IQR HR 3.78 (1.18, 12.13)
Respiratory infant PM10 IQR HR 6.20 (1.50, 25.66)
Respiratory infant PM2.5 IQR HR 3.15 (1.26, 7.85)
Respiratory infant PM10-2.5 IQR HR 2.86 (0.76, 10.85)
19 Son, et al. (2012)14 Case-crossover 2000–2007 Seoul Total PM10 IQR 0.94% (0.25, 1.62)
Total NO2 IQR 2.27% (1.03, 3.53)
Total SO2 IQR 1.94% (0.80, 3.09)
Total CO IQR 2.21% (1.00, 3.43)
Total O3 IQR Positive/NS
Cardiovascular PM10 IQR 1.95% (0.64, 3.27)
Cardiovascular NO2 IQR 4.82% (2.18, 7.54)
Cardiovascular SO2 IQR 3.64% (1.46, 5.87)
Cardiovascular CO IQR 4.32% (1.77, 6.92)
Cardiovascular O3 IQR Positive/NS
20 Heo, et al. (2014)67 Time-series 2003–2007 Seoul Non-accidental, cardiovascular, respiratory PM2.5 and components Percentage of excess risk by PM3.5 and components
21 Lim, et al. (2014)68 GWR 2008–2010 Seoul Cardiovascular PM10 Mean β (SE) 0.956 (0.102)
22 Ha, et al. (2015)69 Case-crossover 2002–2008 7 citie Unintentional injury PM10 IQR (48.3 μg/m3) NS
Unintentional injury SO2 IQR (0.005 ppm) OR 1.119 (1.022, 1.226)
Unintentional injury NO2 IQR (0.02 ppm) OR 1.208 (1.043, 1.400)
Unintentional injury O3 IQR (0.03 ppm) NS
Unintentional injury CO IQR (0.36 ppm) OR 1.012 (1.000, 1.024)
23 Kim, et al. (2017)16 Time-series 1993–2009 7 cities Non-accidental PM10 10 μg/m3 0.51% (0.01, 1.01)
24 Kim, et al. (2018)70 Time-series 1993–2009 7 cities Non-accidental PM10 Daily concentrations of ≥75 μg/m3 0.48% (0.30, 0.60)
Cardiovascular PM10 Daily concentrations of ≥75 μg/m3 0.48% (0.14, 0.82)
Respiratory PM10 Daily concentrations of ≥75 μg/m3 1.13% (0.37, 1.89)
25 Kim, et al. (2017)18 Cohort 2007–2013 Seoul Composite cardiovascular events PM2.5 1 μg/m3 HR 1.41 (1.32, 1.50)
All-cause PM2.5 1 μg/m3 HR 1.32 (1.22, 1.43)
Cardiovascular PM2.5 1 μg/m3 HR 1.36 (1.11, 1.66)
Composite cardiovascular events CO IQR (0.25 ppm) HR 1.79 (1.61, 1.99)
All-cause CO IQR (0.25 ppm) HR 1.72 (1.52, 1.94)
Cardiovascular CO IQR (0.25 ppm) HR 2.96 (2.12, 4.14)
Composite cardiovascular events SO2 IQR (2.54 ppb) HR 1.94 (1.78, 2.11)
All-cause SO2 IQR (2.54 ppb) HR 1.73 (1.55, 1.92)
Cardiovascular SO2 IQR (2.54 ppb) HR 1.50 (1.14, 1.96)
Composite cardiovascular events NO2 IQR (18.4 ppb) HR 2.30 (2.08, 2.55)
All-cause NO2 IQR (18.4 ppb) HR 1.79 (1.59, 2.03)
Cardiovascular NO2 IQR (18.4 ppb) HR 2.67 (1.94, 3.69)
Composite cardiovascular events O3 IQR (15.9 ppb) HR 0.63 (0.63, 0.73)
All-cause O3 IQR (15.9 ppb) HR 0.68 (0.63, 0.73)
Cardiovascular O3 IQR (15.9 ppb) HR 0.59 (0.49, 0.71)
26 Kim, et al. (2017)17 Cohort 2002–2014 Korea Non-accidental PM10 10 μg/m3 HR 1.05 (0.99, 1.11)
Cardiovascular PM10 10 μg/m3 HR 1.02 (0.90,1.16)
Cerebrovascular PM10 10 μg/m3 HR 1.14 (0.93, 1.39)
Respiratory PM10 10 μg/m3 HR 1.19 (0.91, 1.57)
Cancer PM10 10 μg/m3 HR 1.02 (0.95, 1.10)
Lung cancer PM10 10 μg/m3 HR 0.96 (0.82,1.13)
27 Lee, et al. (2018)71 Case-crossover 2002–2013 26 cities Suicide PM10 IQR Increased OR 1.2% (0.2, 2.3)
NO2 IQR Increased OR 4.3% (1.9, 6.7)
SO2 IQR Increased OR 2.2% (0.7, 3.8)
CO IQR Increased OR 2.4% (0.9, 3.8)
O3 IQR Increased OR 1.5% (-0.3, 3.2)

TSP, total suspended particles; IQR, interquartile range; OR, odds ratio; RR, relative risk; HR, hazard ratio; NS, not significant; GWR, geographically weighted regression; 7 cities, Seoul, Incheon, Daejeon, Gwangju, Daegu, Busan, Ulsan.

Table 2

Epidemiological Studies on Air Pollution and Morbidity in Korea between 1999 and 2018

ymj-60-243-i002
No. Author (year) Study design Study period Location Outcome Pollutant Unit Effect size
1 Lee, et al. (2002)23 Time series Seoul Asthma hospitalization PM10 IQR (40.4 µg/m3) RR 1.07 (1.04, 1.11)
Asthma hospitalization SO2 IQR (4.4 ppb) RR 1.11 (1.06, 1.17)
Asthma hospitalization NO2 IQR (14.6 ppb) RR 1.15 (1.10, 1.20)
Asthma hospitalization O3 IQR (21.7 ppb) RR 1.12 (1.07, 1.16)
Asthma hospitalization CO IQR (1.0 ppm) RR 1.16 (1.10, 1.22)
2 Lee, et al. (2005)24 Panel study 2003 Seoul Upper respiratory symptoms NO2 OR 1.12 (1.01, 1.24)
Lower respiratory symptoms NO2 OR 1.18 (1.06, 1.31)
Lower respiratory symptoms SO2 OR 1.12 (1.01, 1.25)
Lower respiratory symptoms CO OR 1.16 (1.02, 1.32)
3 Son, et al. (2006)25 Time series 2002 Seoul Asthma hospitalization (highest SES) O3 RR 1.12 (1.00, 1.25)
Asthma hospitalization (moderate SES) O3 RR 1.24 (1.08, 1.43)
Asthma hospitalization (lowest SES) O3 RR 1.32 (1.11, 1.58)
4 Lee, et al. (2007)72 Natural experiment 2002 Busan Childhood asthma hospitalization RR post Asian game period/RR baseline 0.73 (0.49, 1.11)
5 Lee, et al. (2006)73 Time series 2002 Seoul Asthma hospitalization PM10 IQR 31% (14, 51)
Asthma hospitalization SO2 IQR 29% (8, 53)
Asthma hospitalization NO2 IQR 29% (5, 58)
6 Seo, et al. (2007)33 Cohort 2002–2003 Seoul Low birth weight CO IQR RR 1.081 (1.002, 1.166)
Low birth weight SO2 IQR RR 1.145 (1.036, 1.267)
Low birth weight PM10 IQR RR 1.053 (1.002, 1.108)
Low birth weight NO2 IQR RR 1.003 (0.954, 1.055)
7 Moon, et al. (2009)74 4 cities Respiratory symptoms 5 criteria pollutants Significant positive association with SO2 and NO2
8 Seo, et al. (2010)34 Cohort 2004 Seoul Low birth weight PM10 OR 1.08 (0.99, 1.18)
Busan Low birth weight PM10 OR 1.24 (1.02, 1.52)
Daegu Low birth weight PM10 OR 1.19 (1.04, 1.37)
Incheon Low birth weight PM10 OR 1.12 (0.98, 1.28)
Gwangju Low birth weight PM10 OR 1.22 (0.98, 1.52)
Daejeon Low birth weight PM10 OR 1.06 (1.00, 1.11)
Ulsan Low birth weight PM10 OR 1.19 (1.03, 1.38)
9 Yi, et al. (2010)75* Case-crossover 2001–2006 Cardiovascular hospitalization PM10 10 μg/m3 0.77% (0.53, 1.01)
Respiratory hospitalization PM10 10 μg/m3 1.19% (0.94, 1.44)
10 Kim, et al. (2011)26 Cohort 12-month prevalence of wheeze O3 5 ppb OR 1.372 (1.016, 1.852)
11 Lim, et al. (2012)31 Panel study Seoul Depression (SGDS-K) PM10 IQR 17.0% (4.9, 30.5)
Depression (SGDS-K) NO2 IQR 32.8% (12.6, 65.6)
Depression (SGDS-K) O3 IQR 43.7% (11.5, 85.2)
12 Kim, et al. (2012)76 Panel study Seoul Insulin resistance PM10, O3, NO2 IQR Significantly increased
13 Kim, et al. (2013)77 Cross sectional Allergic diseases Traffic related pollutants Polluted vs. non-polluted school OR 2.12 (1.41, 3.19)
14 Kim, et al. (2013)27 Cohort Airway hyperresponsiveness O3 OR 1.60 (1.13, 2.27)
New episodes of wheezing O3 OR 1.92 (0.96, 3.83)
15 Han, et al. (2013)78 Hemorrhagic fever with renal syndrome PM10 1 μg/m3 0.013 increase of monthly cases
16 Son, et al. (2013)79 2003–2008 8 cities Allergic disease hospital admission PM10 IQR (30.7 μg/m3) 2.2% (0.5, 3.9)
Asthma hospital admission PM10 IQR (30.7 μg/m3) 2.8% (1.3, 4.4)
Respiratory hospital admission PM10 IQR (30.7 μg/m3) 1.7% (0.9, 2.6)
Cardiovascular hospital admission PM10 IQR (30.7 μg/m3)
Allergic disease hospital admission NO2 IQR (12.2 ppb) 2.3% (0.6, 4.0)
Asthma hospital admission NO2 IQR (12.2 ppb) 2.2% (0.3, 4.1)
Respiratory hospital admission NO2 IQR (12.2 ppb) 2.2% (0.6, 3.7)
Cardiovascular hospital admission NO2 IQR (12.2 ppb) 2.2% (1.1, 3.4)
17 Park, et al. (2013)80 Time series 7 cities Asthma admission PM10, CO, O3, NO2 Children vs. adult Lower risk in children for PM10 and CO
18 Kim, et al. (2014)81 Cohort Neurodevelopment (MDI) PM10 β=-2.83; p=0.003
19 Hwang, et al. (2014)82 Retrospective cohort Seoul Neurodevelopment (PDI) PM10 β=-3.00; p=0.002
20 Han, et al. (2015)28 Time series 2004–2013 Tuberculosis SO2 IQR RR 1.07 (1.03, 1.12)
21 Kim, et al. (2015)83 Case-crossover Korea Hourly asthma ED visit PM10-2.5 IQR OR 1.05 (1.00, 1.11)
Hourly asthma ED visit O3 IQR OR 1.10 (1.04, 1.16)
22 Jang, et al. (2015)84 Ecological Korea Monthly malaria incidence NO2 β=-0.884, p<0.01
23 Shim, et al. (2016)85 Cross sectional 2010–2013 Korea Benign prostate hyperplasia NO2 OR 2.23 (1.55, 2.39)
Benign prostate hyperplasia SO2 OR 2.02 (1.42, 2.88)
24 Kang, et al. (2016)86 Time series 2006–2013 Seoul Cardiac arrest PM2.5 10 μg/m3 1.30% (0.20, 2.41)
25 Kim, et al. (2016)87 Cross sectional Allergic rhinitis CO (during the first year of life) 100 ppb OR 1.10 (1.03, 1.19)
Atopic dermatitis CO (past 12 months) 1 ppm OR 8.11 (1.06, 62.12)
26 Kim, et al. (2016)88 Cross sectional Asthma NO2 OR 1.67 (1.03, 2.71)
Allergic rhinitis Black carbon OR 1.60 (1.36, 1.90)
Allergic rhinitis SO2 OR 1.09 (1.01, 1.17)
Allergic rhinitis NO2 OR 1.18 (1.07, 1.30)
27 Han, et al. (2016)89 Time series 2004–2014 Seongdong-gu, Seoul Intracerebral hemorrhage PM10 RR 1.09 (1.02, 1.15)
Subarachnoid hemorrhage O3 RR 1.32 (1.10, 1.58)
28 Kim, et al. (2016)32 Cohort 2002–2010 Korea Major depressive disorder PM2.5 10 μg/m3 HR 1.44 (1.17-1.78)
29 Lee, et al. (2016)90 Cross sectional 2008–2010 Korea Hypertension PM10 10 μg/m3 OR 1.042 (1.009, 1.077)
Hypertension in >30 years old PM10 10 μg/m3 OR 1.044 (1.009, 1.079)
Stroke PM10 10 μg/m3 OR 1.044 (0.979, 1.114)
Angina PM10 10 μg/m3 OR 0.977 (0.901, 1.059)
Hypertension NO2 10 ppb OR 1.077 (1.044, 1.112)
Hypertension in >30 years old NO2 10 ppb OR 1.080 (1.043, 1.118)
Stroke NO2 10 ppb OR 1.073 (0.994, 1.157)
Angina NO2 10 ppb OR 1.047 (0.968, 1.134)
Hypertension CO 10 ppb OR 1.123 (0.963, 1.310)
Hypertension in >30 years old CO 10 ppb OR 1.129 (0.963, 1.387)
Stroke CO 10 ppb OR 1.336 (0.987, 2.011)
30 Lee, et al. (2017)91 Cross sectional 2008–2011 Korea Pterygium PM10 5 μg/m3 OR 1.23 p=0.023
31 Chung, et al. (2017)92 Cardioembolic stroke PM10 Significantly increased
Cardioembolic stroke SO2 Significantly increased
32 Kim, et al. (2016)93 Randomized intervention trial Atopic dermatitis Indoor VOC Environmentally friendly vs. PVC wallpaper More improvement in environmentally friendly wallpaper group
33 Ha, et al. (2017)29 Ecological 1999–2008 Male lung cancer Indoor radon 10 Bq/m3 0.01
Female children non-Hodgkin's lymphoma Indoor radon 10 Bq/m3 0.07
34 Hwang, et al. (2017)94 Time series Cardiovascular ED visit NH4+ (PM2.5 component) RR 1.05 (1.01, 1.09)
35 Kim, et al. (2017)18* Cohort 2007–2013 Seoul Acute myocardial infarction PM2.5 1 μg/m3 1.36 (1.19, 1.56)
Congestive heart failure PM2.5 1 μg/m3 1.44 (1.29, 1.61)
Stroke PM2.5 1 μg/m3 1.39 (1.27, 1.52)
Acute myocardial infarction CO IQR (0.25 ppm) 2.12 (1.72, 2.61)
Congestive heart failure CO IQR (0.25 ppm) 1.86 (1.56, 2.21)
Stroke CO IQR (0.25 ppm) 2.00 (1.73, 2.30)
Acute myocardial infarction SO2 IQR (2.54 ppb) 1.82 (1.52, 2.19)
Congestive heart failure SO2 IQR (2.54 ppb) 2.00 (1.73, 2.32)
Stroke SO2 IQR (2.54 ppb) 2.25 (2.00, 2.54)
Acute myocardial infarction NO2 IQR (18.4 ppb) 1.81 (1.46, 2.25)
Congestive heart failure NO2 IQR (18.4 ppb) 2.40 (2.02, 2.85)
Stroke NO2 IQR (18.4 ppb) 2.65 (2.29, 3.06)
Acute myocardial infarction O3 IQR (15.9 ppb) 0.71 (0.63, 0.82)
Congestive heart failure O3 IQR (15.9 ppb) 0.64 (0.58, 0.71)
Stroke O3 IQR (15.9 ppb) 0.60 (0.55, 0.65)
36 Lamichhane, et al. (2017)30 Case-control Korea Lung cancer PM10 10 μg/m3 OR 1.09 (0.96, 1.23)
NO2 10 ppb OR 1.10 (1.00, 1.22)
37 Yi, et al. (2017)95 Cross sectional 2010 Seoul Children's atopic eczema Road density OR 1.08 (1.01, 1.15)
Road proximity OR 1.15 (1.01, 1.31)
38 Lamichhane, et al. (2018)96 Birth cohort Fetal growth (BPD) PM10 10 μg/m3 -0.26 mm (-0.41, -0.11)
NO2 10 μg/m3 -0.30 mm (-0.59, -0.03)

SES, socioeconomic status; SGDS-K, Short Geriatric Depression Scale-Korean; MDI, mental developmental index; PDI, psychomotor developmental index; BPD, biparietal diameter; VOC, volatile organic carbon; PVC: polyvinyl chloride; IQR, interquartile range; OR, odds ratio; RR, relative risk; HR, hazard ratio; 7 cities, Seoul, Incheon, Daejeon, Gwangju, Daegu, Busan, Ulsan.

*From the search results of mortality studies.

Table 3

Studies Estimating Health Impact of Air Pollution Conducted in Korea

ymj-60-243-i003
No. Autor (year) Study period Location Outcome Pollutant Health impact (person)
1 Leem, et al. (2015)37 2010 Seoul metropolitan area Attributable number of deaths PM2.5 15346
Attributable number of respiratory hospital admission PM10 12511
Attributable number of cardiovascular hospital admission PM10 12351
Attributable number of lung cancer incidence PM10 1403
Attributable number of asthma attack (children) PM10 11389
Attributable number of asthma attack (adults) PM10 44006
Attributable number of chronic bronchitis PM10 20490
Attributable number of acute bronchitis PM10 278346
2 Yorifuji, et al. (2015)35 2009 Seoul Attributable number of deaths PM10 over 20 μg/m3 5840
Busan Attributable number of deaths PM10 over 20 μg/m3 2465
Daegu Attributable number of deaths PM10 over 20 μg/m3 1466
Incheon Attributable number of deaths PM10 over 20 μg/m3 1931
Daejeon Attributable number of deaths PM10 over 20 μg/m3 599
Gwangju Attributable number of deaths PM10 over 20 μg/m3 698
Ulsan Attributable number of deaths PM10 over 20 μg/m3 539
3 Yoon, et al. (2015)38 2007 Korea Disability-adjusted life years Out door air pollution 6.89/1000 person
4 Han, et al. (2018)36 Korea Attributable number of deaths PM2.5 11924
Seoul Attributable number of deaths PM2.5 1763
Busan Attributable number of deaths PM2.5 947
Daegu Attributable number of deaths PM2.5 672
Incheon Attributable number of deaths PM2.5 309
Gwangju Attributable number of deaths PM2.5 657
Daejeon Attributable number of deaths PM2.5 342
Ulsan Attributable number of deaths PM2.5 222
Sejong Attributable number of deaths PM2.5 49
TOOLS
Similar articles