

 PDF
PDF ePub
ePub Citation
 Print
Print


INTRODUCTION
Sjögren's syndrome (SS) is a chronic autoimmune rheumatic disease that primarily affects the exocrine glands, in particular the salivary and lacrimal glands, resulting in hyposalivation. The criteria for SS diagnosis proposed by the American-European consensus group (AECG) in 2002 are widely accepted (1). The AECG criteria consist of ocular and oral syndromes, positive histopathological findings, salivary hypofunction and presence of serum autoantibodies. Thus, the reliable detection of impaired salivary function is critical for the diagnosis of SS. Parotid glands are the largest salivary glands and make a relatively greater contribution to the whole-mouth saliva composition during gustatory stimulation compared to other salivary glands, such as submandibular and sublingual glands (2). Thus, an objective evaluation of parotid gland function is very important.
Salivary gland scintigraphy has been widely used for evaluating salivary gland function and has also been accepted by the AECG in 2002 as an objective assessment method for SS. However, salivary gland scintigraphy uses radiation and cannot provide detailed morphological features of salivary glands.
Magnetic resonance imaging (MRI) is a technique that provides high resolution images of parotid glands, as well as great internal contrast of the parotid gland ducts and acinus due to its high sensitivity to the protons in saliva. Two-dimensional (2D) sequences have been applied in the functional evaluation of parotid gland (34). With technical advances, three-dimensional (3D) sequences provide better conspicuity, virtual endoscopy and contrast-to-noise ratio of the duct (5). In addition, MRI fast imaging enables a reasonable temporal resolution for 3D magnetic resonance (MR) ductal imaging (67). Thus, 3D MRI is a potential modality for both the functional evaluation and morphological imaging of salivary glands.
Recently, several researchers have evaluated the morphological features of salivary glands with MR sialography (89). However, few researchers have evaluated the secretion function of salivary glands by MRI under normal and pathological states. The aim of this study was to explore the possibility of noninvasively and quantitatively evaluating the secretion function of parotid glands with dynamic MR sialography and to evaluate clinical performance of MRI in diagnosing and evaluating SS patients.
MATERIALS AND METHODS
This prospective study was approved by the Institutional Review Board. Informed consent for participation was obtained from all participants.
Patient Populations
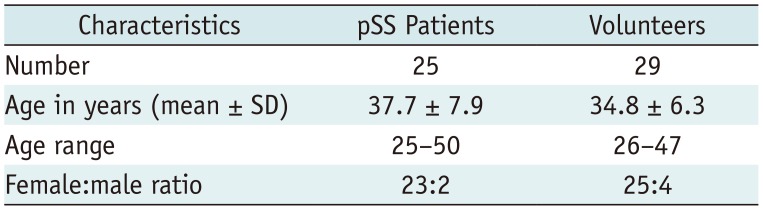
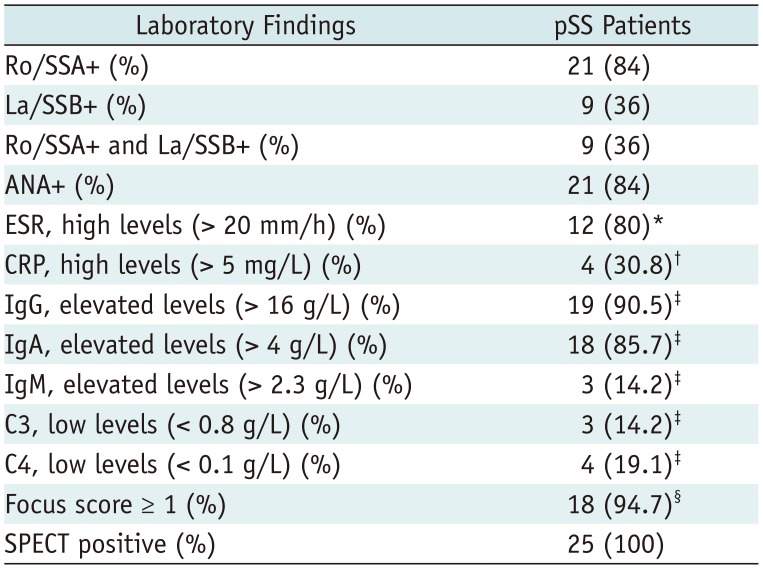
In the control group, there were 29 healthy volunteers (25 women and 4 men; mean age, 34.8 ± 6.3 years; age range, 26–47 years). In the case group, there were 25 consecutive primary SS (pSS) patients (23 women and 2 men; mean age, 37.7 ± 7.9 years; age range, 25–50 years) enrolled between October 2014 and January 2018. All of the pSS patients were diagnosed as having pSS based on the criteria proposed by the AECG in 2002 (1). The demographics of the volunteers and pSS patients are shown in Table 1 and the laboratory data of pSS patients are shown in Table 2.
All pSS patients enrolled in the study underwent single-photon emission computed tomography (SPECT) and were confirmed as having hypofunctional parotid glands; none of the pSS patients had received any head or neck irradiation, chemotherapy or underwent an operation. Meanwhile, hepatitis C virus (HCV) infection, IgG4-related disease, sarcoidosis and amyloidosis were considered as exclusion criteria. The volunteers were assessed by a clinician as non-SS. None of the control group had any sicca symptoms or signs, nor had any form of oral and connective tissue disease, nor had received any head or neck irradiation. None of the control group participants had a long-term smoking history, drug abuse or HCV infection.
MRI Examinations
All 29 volunteers and 25 pSS patients underwent dynamic MR sialography of the parotid glands with a 3T MR scanner (Magneton Skyra; Siemens Healthineers, Erlangen, Germany). Dynamic MR sialography was performed using 3D-SPACE sequence with the following parameters: repetition time/echo time, 2400/696 ms; matrix, 376 × 384; slice thickness, 1.2 mm; field of view, 200 mm; number of excitations, 1.7; imaging time per phase, 86 seconds; and total imaging time, 602 seconds. The images of the parotid ducts were acquired before (1 phase) and after (phase 1–6 without time interval) vitamin C tablets (300 mg) were administered on the tongue. Dynamic MR sialography of all participants was performed between the hours of 12 and 14, because the un-stimulated whole mouth saliva flow rate was subject to a circadian variation (10). All of the participants fasted for 3 hours before the MRIs were performed. Only unilateral parotid gland ducts were chosen for the MR scan in the study. The side of the parotid gland to be imaged was decided upon in a randomized manner for both the volunteers and the pSS patients. This was determined by the pre-experiment results and analysis, in which we performed dynamic MRI on bilateral parotid glands in two separate scans with an interval of 24 hours in 5 volunteers and 5 pSS patients. The data showed no significant differences between the two sides of the parotid gland in both volunteers and pSS patients. Considering the tolerance of the participants, and in order to minimize the examination time, dynamic MRI was performed on one side of the parotid gland duct.
Image Analysis
The volume of parotid gland duct of each phase was precisely measured by using the ImageJ software (https://imagej.nih.gov/ij/) for all participants in both groups. The 3D volume of interest (3D-VOI) was manually placed by tracing the contours of the parotid gland duct on consecutive images of a phase. All of the measurements were performed by two radiologists with 10 and 15 years of individual experience independently.
The volume changing-ratio of the parotid gland duct was calculated as follows:

n refers to the number of the phase; CR refers to the changing-ratio of the parotid gland duct; V refers to the volume of the parotid gland duct; and V0 refers to the duct volume before administration of vitamin C.
Then, a curve was plotted to demonstrate the relationship between time and volume changing-ratio of the parotid gland duct post-gustatory stimulation.
Based on the curve, the slope of the increase in the first post-stimulation phase (slope1st), peak value, time-to-peak and total saliva secretion post-stimulation were calculated to quantify the secretion function of the parotid gland. The slope1st was calculated according to the following formula:

CR1, changing-ratio in the first post-stimulation phase; CR0, changing-ratio in the pre-stimulation phase; and t corresponded to the time of the first post-stimulation phase. Peak value refers to the maximum volume changing-ratio post-stimulation. Time-to-peak refers to the time starting from when the subject takes vitamin C to the time of maximum volume changing-ratio. Total saliva secretion post-stimulation was calculated as the accumulation of the total volume of 6 post-stimulation phases, and this was due to two aspects. First, the parotid secretion was a continuous process from the acini to the oral cavity. Second, the parotid gland duct was an elastic pipeline structure, and its volume at any particular time depended on the quantity of saliva secreted by the parotid gland. Thus, during one-phase imaging time, the volume of the duct was the same as the increased saliva quantity secreted by the gland after stimulation.
Statistical Analyses
The statistical analysis was performed by using SPSS v. 19.0 software for windows (IBM Corp., Armonk, NY, USA). The Fisher's exact test and the Mann-Whitney U test were used to evaluate the sex and age differences between the volunteer and pSS patients. The intraclass correlation coefficient (ICC) was applied to evaluate the inter-observer's agreement. If the ICC indicate good inter-observer's agreements which was set to greater than 0.75, the average of the two readers' measurements were used for data analysis in the following analysis. The descriptive analysis was used to evaluate the distribution of the quantitative parameters, which were used to evaluate the function of the parotid gland between the volunteers and pSS patients. The repeated measurement analysis of variance was applied to evaluate the difference of time-dependent volume changing-ratio between the volunteers and pSS patients. The paired t test was applied to evaluate the difference of quantitative parameters with a normal distribution, and the Mann-Whitney U test was applied to evaluate the difference of quantitative parameters with an abnormal distribution. The logistic regression was applied to find the discriminators between healthy volunteers and pSS patients, and the area under the curve (AUC) of the receiver operating characteristic (ROC) curve was used to assess the diagnostic values of the discriminators.
RESULTS
The age and sex of the participants exhibited no statistically significant differences between both groups (age, p = 0.161; sex, p = 0.675).
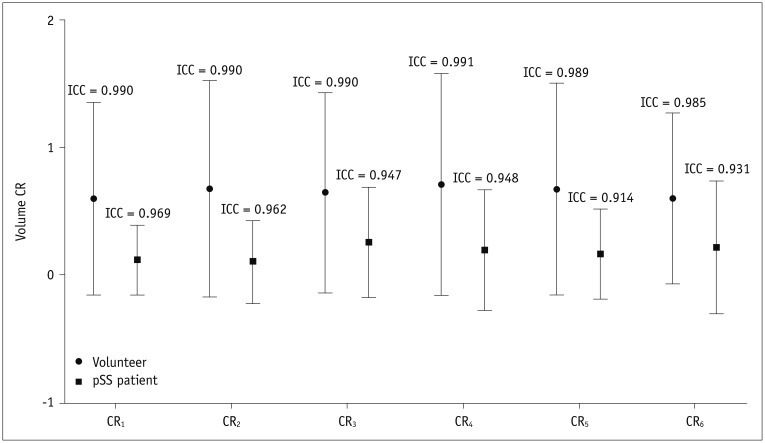
The ICC of CRn of the two groups were recorded with an excellent agreement between the two readers (Fig. 1).
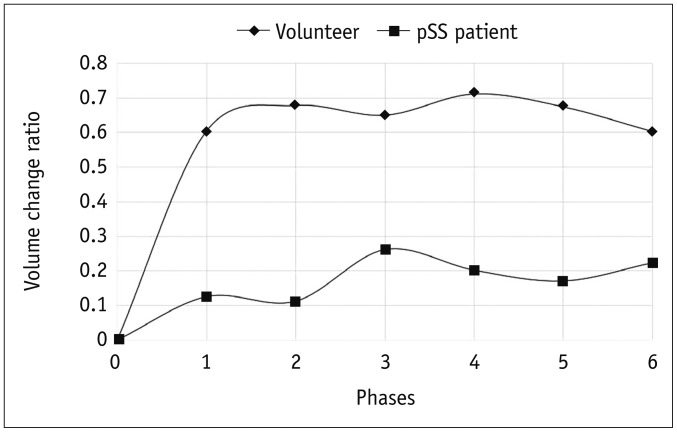
The parotid gland duct was identified as a bright tree-like ductal structure on the dynamic MR sialography images, as shown in Figure 2. The parotid gland duct of the volunteers became rapidly brighter and thicker in the first post-stimulation phase and retained a higher signal intensity during the rest phases, despite slight fluctuations (Fig. 2A). In contrast, the parotid gland duct of the pSS patients became brighter in a slower and more subtle manner (Fig. 2B). Accordingly, the volunteers and the pSS patients showed completely different types of time-dependent volume change ratio curves (Fig. 3). The volunteers demonstrated a fast-rising curve, which showed the salivary secretion increasing significantly in the first post-stimulation phase, and retained a higher secretion level during the remaining 5 phases. In contrast, the pSS patients showed a slow-rising curve, demonstrated by a narrow range of changing-ratio fluctuations and lower extents and flow rates of salivary secretion. The time-dependent volume change ratio curve of the two groups showed a significant difference (F = 8.750, p = 0.005).
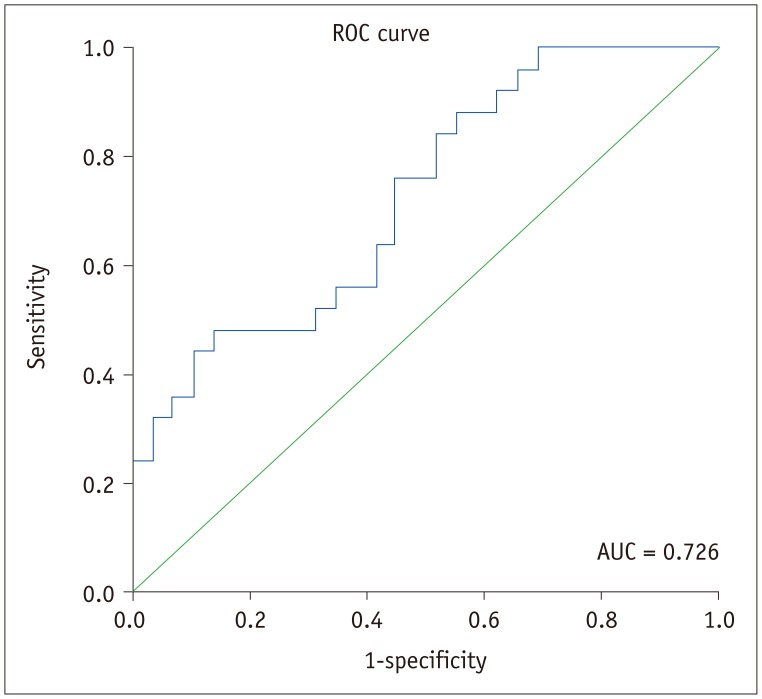
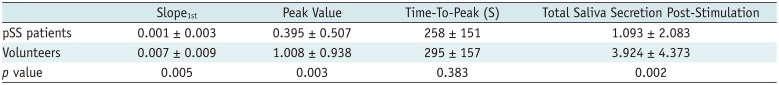
As shown in Table 3, pSS patients showed a lower slope1st (0.001 vs. 0.007; p = 0.005), peak value (0.395 vs. 1.008; p = 0.003) and total saliva secretion post-stimulation (1.093 vs. 3.924; p = 0.002). The time-to-peak between the two groups exhibited no significant difference (258 vs. 295 seconds; p = 0.383). According to logistic regression analysis and ROC curve (Fig. 4), slope1st can be used as a discriminator to diagnose SS patients (p = 0.015, odds ratio = 4.234, 95% confidence interval: 1.321–13.567, and AUC = 0.726, p = 0.005), while peak values and total saliva secretion post-stimulation showed no significant value in diagnosing pSS (p = 0.321 and p = 0.310, respectively).
DISCUSSION
In this study, we successfully used dynamic MR sialography for the evaluation of the secretion function of parotid glands by assessing the time-dependent volume change ratio curve of the parotid gland duct. Compared with healthy volunteers, pSS patients demonstrated a slower and more subtle curve of time-dependent volume change ratio, resulting in significantly lower slope1st value, peak value, and total saliva secretion post-stimulation.
MRI, which provides images with a high resolution and great internal contrast for soft tissues, is an ideal technique for the morphological imaging of the salivary gland. 3T MRI has to be outplaying 1.5T MRI in higher signal-to-noise ratio, which can serve to reduce the acquisition time or improve spatial resolution (6). Moreover, Compared with 2D fast asymmetric spin-echo (2D-FASE) used in the previous study (34), 3D-SPACE sequence, featuring with variable-flip-angle and great turbo factor, reduces the blurring effect caused by T2 decay and eliminate ghosting artifacts while maintaining better image quality and sufficient contrast to noise ratio (61112). Furthermore, 3D MR ductal imaging enables us to calculate the volume of the duct by drawing 3D-VOIs. As the ductal system underwent constant contraction and dilation during saliva secretion, the max diameter of detectable area of the duct is also constantly changing during saliva secretion, which makes the maximal diameter of detectable contraction (13) not so accurate in assessing the secretion function of the gland. 3D-VOIs calculate the total duct volume in a single scan phase, which effectively avoid the interference of the shape changes of the duct.
Parotid gland secretion is a continuous process, which includes the production of saliva in the acini, the transportation of saliva in the ductal system and finally the release into the oral cavity. The ductal system is similar to a two open-ended elastic pipeline whose volume largely depend on the inputs, therefore, the volume of the parotid gland duct depends on the quantity of saliva secreted by parotid glands and the measured volume of the parotid gland duct reflects the secretory function of parotid glands. The secretion rate of parotid glands shows a wide variation between subjects and a wide fluctuation during the day, where it is lower under resting (un-stimulated) conditions and higher when responding to the reflective salivary secretion evoked by gustatory stimulation (210). To eliminate the individual saliva secretion differences between subjects, pre-stimulation volumes of the parotid gland ducts were used as an internal reference in calculating changing-ratios in this study.
The time-dependent volume change ratio curve of the parotid gland duct was calculated to quantify the secretary function of parotid glands in this study. The coordinate origin of the curve indicated the secretion of parotid glands under resting states. Meanwhile, slope1st and peak value directly related to how fast and how much parotid glands secrete after gustatory stimulation. Based on our results, the pSS patients demonstrated an apparently weaker secretory function compared with the healthy volunteers, manifesting as a flat curve and significantly lower values of slope1st, peak value and total saliva secretion post-stimulation. The secretory dysfunction of parotid glands in pSS patient may relate to acinar cell damage and decreased normal gland architecture (1415). Our findings were coinciding with previous MR sialography study (34) which showed the decrease of parotid gland secretory function in SS patients. Although the time-dependent volume change ratio curve in our study showed similar trend with the previous study, there was difference between the curves. The SS patient sample size in the previous study was small (5 SS patients) and the changing curve is about a single volunteer and a single patient, while in the present study, larger sample size (25 SS patients) were enrolled and the curve demonstrated the average changing-ratio of the whole volunteer and patient group. In addition, the 3D-VOIs based on the thin section greatly reduced the interference of artifacts and volume effects. Among the three parameters, slope1st can be used as a diagnostic indicator for the diagnosis of pSS patients. Time-to-peak parameters did not exhibit any significant difference between pSS patients and volunteers which is coincide with the previous study (3). There might be two possible reasons for this finding. First, the decrement of both total saliva production and secretion rate in pSS patients making the difference of time-to-peak (TTP) less significant. Second, the relatively long acquisition time per phase (86 seconds) lowered the diagnostic sensitivity of TTP.
This study has several limitations. First, the sample sizes of the pSS patients and volunteers were relatively small, thus we were unable to clinically sub-group the participants. Second, the volunteer group did not receive SPECT. Third, the pSS patients were diagnosed based on the criteria proposed by the AECG in 2002, which now has a new 2016 American College of Rheumatology/European League Against Rheumatism criterion (16) which is more sensitive and more specific in diagnosing SS. Finally, this study mainly focused on dynamic MR sialography without assessing the signal change of the parotid gland on conventional sequences. Future case-controlled studies with larger samples are required to detect the secretary function of parotid glands and compare the diagnostic performance of MR sialography and the signal change on conventional sequences in different sub-groups of pSS patients.
In conclusion, dynamic MR sialography is proven to be a valuable and effective method in evaluating parotid gland secretory function by employing time-dependent volume change ratio curves. slope1st can be used as a quantitative indicator to differentiate normal salivary secretion in healthy people and salivary hypofunction in pSS patients. Dynamic MR sialography has a great potential to be used as a non-ionizing and non-invasive method to evaluate the secretion function of parotid glands in patients with pSS.

 XML Download