INTRODUCTION
With its high spatial resolution and excellent soft-tissue contrast, high-resolution magnetic resonance imaging (HR-MRI) for the visualization of vessel walls and contours is of substantial interest (
1). Intracranial vessel wall MRI is a useful adjunct to digital subtraction angiography for differentiating intracranial artery disease and identifying symptomatic non-stenotic disease (
1234). However, the long imaging acquisition time of HR-MRI of the vessel wall is an important issue in daily clinical practice. A long acquisition time can lead to degradation of image quality due to the higher probability of motion artifacts, especially in elderly patients or those who have recently had a stroke. Conventional parallel imaging techniques such as sensitivity encoding (SENSE) or generalized autocalibrating partial parallel acquisition have been developed (
56); however, they can adversely affect image quality and the visualization of target diseases. Although a two-dimensional spatially selective radiofrequency excitation pulse can achieve an acceptable reduction in scan time, this may be achieved at the cost of limited scan coverage (
2). Therefore, a novel sequence for vessel HR-MRI is required, to reduce image acquisition time while maintaining image quality and vessel delineation.
Lustig et al. (
7) developed compressed sensing for rapid MRI, and demonstrated accelerated acquisition times and improved spatial resolution in multi-slice fast spin echo brain imaging and three-dimensional (3D) contrast-enhanced angiography. Compressed sensing enables accelerated MRI by using wavelet transformations and nonlinear iterative reconstruction from variable-density random undersampling of k-space data (
7). Conventional parallel imaging techniques also reduce scanning time by undersampling, but the undersampling is done uniformly and images are reconstructed using surface coil information. Different undersampling and reconstruction methods may have different influences on image quality and spatial resolution. Previous studies suggest that compressed sensing can be successfully applied to vessel MRI for intracranial and extracranial arteries, resulting in reduced image acquisition time while maintaining image quality and vessel wall delineation (
89). To our knowledge however, to date no study investigating the application of compressed sensing to intracranial vessel HR-MRI and evaluating compressed sensing in comparison with conventional parallel imaging (SENSE) has been reported.
The aim of the current study was to compare SENSE with compressed sensing plus SENSE (CS) for HR-MRI of intracranial and extracranial arteries, including the evaluation of a number of different acceleration factors.
Go to :

MATERIALS AND METHODS
The relevant Institutional Review Board approved this study, and informed consent was obtained from all subjects.
Study Population
Fourteen healthy volunteers underwent HR-MRI for delineation of intracranial and extracranial arteries between September 2017 and November 2017. Of these 14 patients, 7 were men (mean age, 58.6 years; age range, 40–67 years) and 7 were women (mean age, 55.3 years; age range, 33–65 years), and the overall mean age was 56.9 years (age range, 33–67 years).
Image Acquisition
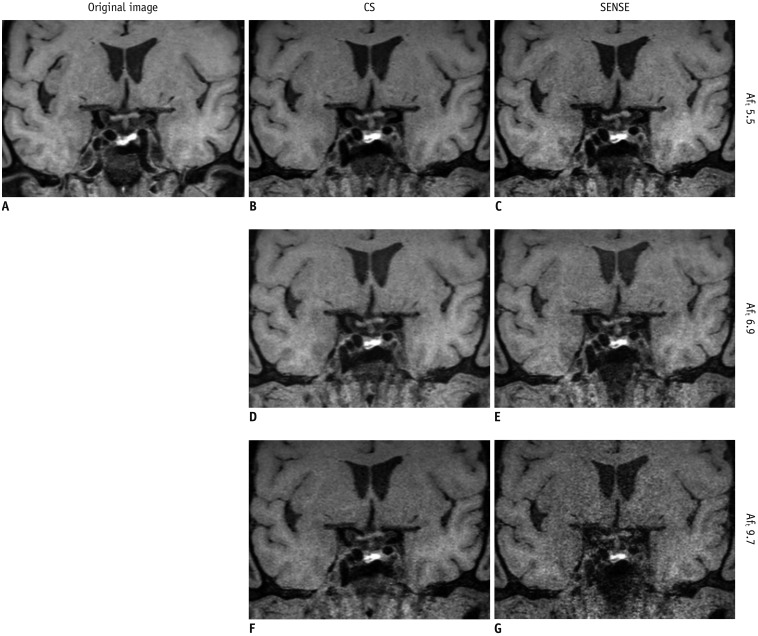
All MRI examinations were performed using a 3T system (Ingenia CX; Philips Medical Systems, Best, the Netherlands) with a 32-channel head coil, and 3D T1-weighted imaging (T1WI) and proton density-weighted imaging (PD) were acquired. CS is a newly developed technique combining compressed sensing and SENSE. For comparison purposes, T1WI with CS and SENSE (total acceleration factors [AFt] 5.5, 6.8, and 9.7), and PD with CS and SENSE (AFt 3.2, 4.0, and 5.8) were also acquired to achieve reduced scanning times in comparison with the original imaging sequence (SENSE T1WI with AFt 3.5 and SENSE PD with AFt 2.0). For the T1WI, compressed sensing factors of 1.6, 2.0, and 2.9 resulted in the CS T1WI having respective AFt values of 5.5, 6.8, and 9.7. For the PD, compressed sensing factors of 1.6, 2.0, and 2.9 resulted in the CS PD having respective AFt values of 3.2, 4.0, and 5.8. The imaging parameters for the original T1WI were echo time 15 ms, repetition time 900 ms, flip angle 90°, matrix 320 × 320 × 333, field of view 192 × 192 × 200 mm, voxel size 0.6 × 0.6 × 0.6 mm, acceleration factor 3.5, and acquisition time 9 minutes 18 seconds. The imaging parameters for the original PD were echo time 35 ms, repetition time 2000 ms, flip angle 90°, matrix 300 × 300 × 75, field of view 120 × 120 × 30 mm, voxel size 0.4 × 0.4 × 0.4 mm, acceleration factor 2, and acquisition time 12 minutes 36 seconds.
The total acquisition times for the T1WI were 9 minutes 18 seconds for the original sequence, 5 minutes 46 seconds (62% of the original scanning time) for CS and SENSE with AFt 5.5, 4 minutes 39 seconds (50% of the original scanning time) for CS and SENSE with AFt 6.8, and 3 minutes 15 seconds (35% of the original scanning time) for CS and SENSE with AFt 9.7. The total acquisition times for the PD were 12 minutes 36 seconds for the original sequence, 7 minutes 52 seconds (62% of the original scanning time) for CS and SENSE with AFt 3.2, 6 minutes 18 seconds (50% of the original scanning time) for CS and SENSE with AFt 4.0, and 4 minutes 22 seconds (35% of the original scanning time) for CS and SENSE with AFt 5.8.
Image Analysis
Two neuroradiologists who were blinded to the sequence information, one with 1 year of experience and the other with 7 years of experience independently assessed the images both qualitatively and quantitatively. In qualitative analyses, each T1WI acquisition was rated using a 4-point visual scoring system for image quality and vessel wall delineation (
10). Overall image quality and artifact were graded as follows: 0, poor image quality with large artifact; 1, moderate image quality with moderate artifact; 2, good image quality with slight artifact; 3, excellent image quality without artifact (
Fig. 1). Vessel wall delineation was graded as follows: 0, less than 50% of the vessel wall is visible; 1, more than 50% of the vessel wall is visible; 2, the vessel wall is delineated with adequate signal and contrast to the lumen and cerebrospinal fluid (CSF); 3, the vessel wall is delineated with excellent signal and sharp contrast to the lumen and CSF (
10). Each PD acquisition was rated for image quality using the same scoring system as for the T1WI, and vessel delineation of the outer contour and branching arteries were graded as follows: 0, less than 50% of the vessel is visible; 1, more than 50% of the vessel is visible; 2, the vessel is delineated with adequate signal and contrast to the lumen and CSF; 3, the vessel is delineated with excellent signal and sharp contrast to the lumen and CSF (
Fig. 2). Acceptable images were defined as those with scores ≥ 2 for both image quality and vessel delineation.
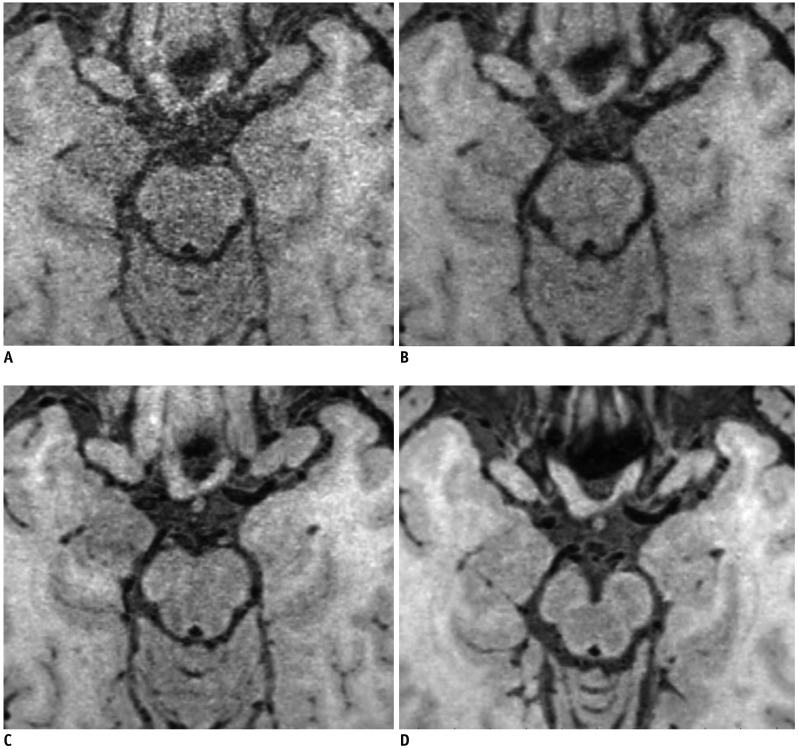 | Fig. 1
Overall image quality and artifact were graded as follows.
(A) Grade 0, poor image quality with large artifact, (B) grade 1, moderate image quality with moderate artifact, (C) grade 2, good image quality with slight artifact, and (D) grade 3, excellent image quality without artifact.

|
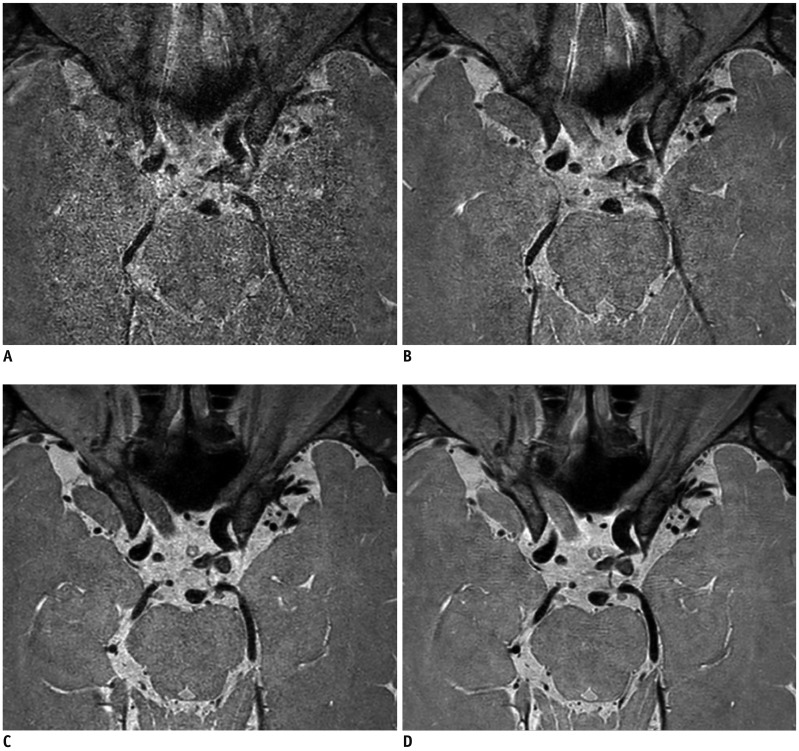 | Fig. 2
Vessel delineations of outer contour and branching arteries were graded as follows.
(A) Grade 0, less than 50% of vessel is visible, (B) grade 1, more than 50% of vessel is visible, (C) grade 2, vessel is delineated with adequate signal and contrast to lumen and CSF, and (D) grade 3, vessel is delineated with excellent signal and sharp contrast to lumen and CSF. CSF = cerebrospinal fluid

|
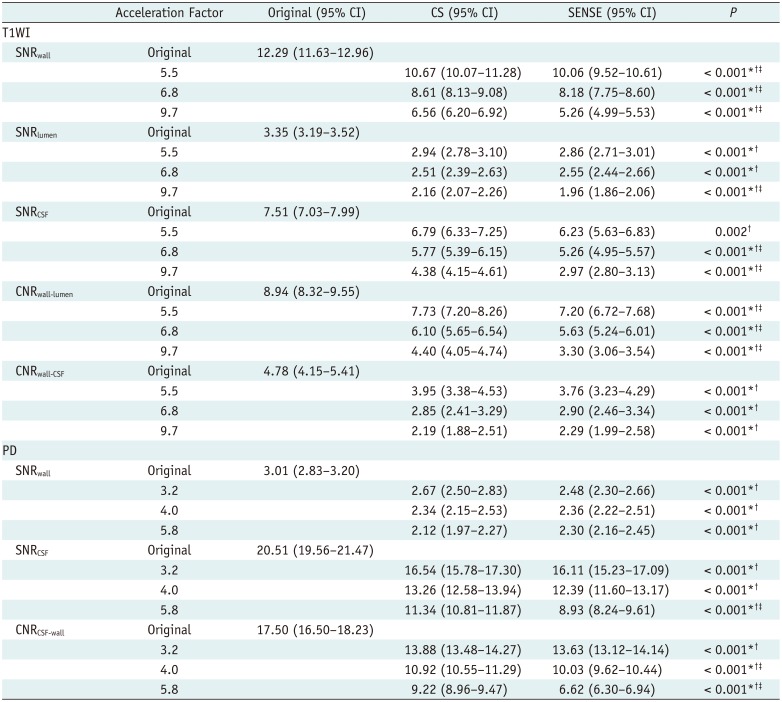
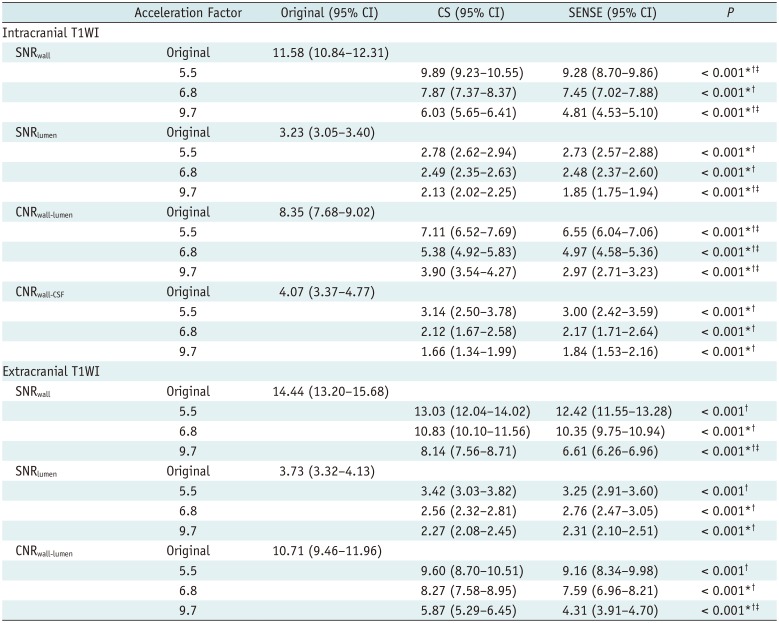
In quantitative analyses, signal-to-noise ratio (SNR) and contrast-to-noise ratio (CNR) measurements were obtained for the middle cerebral artery, basilar artery, terminal internal carotid artery, and carotid bulb. Digital Imaging and Communications in Medicine data derived from the magnetic resonance images were loaded into the “AsanJ” software developed in-house, which is based on a plug-in package for ImageJ (Bethesda, MD, USA;
http://rsbweb.nih.gov/ij/) for lesion segmentation. The regions of interest (ROIs) used in the analysis were drawn by two neuroradiologists. An amplitude segmentation technique based on histogram features and the following formula was used to automatically place the ROIs (
1112):
where r
i,j is the resulting pixel at coordinate (i,j), p
i,j is the corresponding pixel in the input image, and T is the threshold value. When the user places an initial region contour around a vessel wall and double-clicks the mouse, the software automatically calculates the threshold (T
min, T
max), and delineates the vessel wall to quantify its SNR. SNR
wall, SNR
lumen, and SNR
CSF for T1WI, and SNR
wall and SNR
CSF for PD were calculated as follows: SNR = 0.695 × (signal intensity) / (noise), with noise measured as the standard deviation (SD) of the white matter signal (ROI area > 200 mm
2). Due to the inhomogeneous noise distribution as a result of parallel imaging, we could not directly measure the noise simply in the air. Instead, we used the SD of the white matter (
1314). CNR
wall-lumen and CNR
wall-CSF for T1WI, and CNR
CSF-wall for PD were calculated via the following formula (
10):
Statistical Analysis
We combined the data-sets from both readers and performed all the analyses. For comparisons between original, CS, and SENSE images, the Kolmogorov-Smirnov test was used to determine whether the continuous variables were normally distributed. Based on the results of the Kolmogorov-Smirnov test, repeated measures analysis of variance or Friedman tests were used to compare the visual scoring systems, SNR, and CNR of the original, CS, and SENSE images for both intracranial and extracranial arteries. Cochran's Q test was used to compare the proportions of acceptable images of each sequence. Post-hoc tests were performed using Bonferroni correction. We also compared acceptability, SNR, and CNR on T1WI for intracranial and extracranial arteries. Interobserver agreements for the original, CS, and SENSE images were assessed using intraclass correlation coefficients (ICCs) and weighted kappa. Two-way random models and consistency assumptions were used for ICC (
15). The strength of interobserver agreement was categorized according to the ICC and weighted kappa values as follows: < 0.20, poor; 0.21–0.40, fair; 0.41–0.60, moderate; 0.61–0.80, good; 0.81–1.00, excellent (
16). All statistical analyses were performed using SPSS software (version 20; IBM Corp., Armonk, NY, USA).
Go to :

DISCUSSION
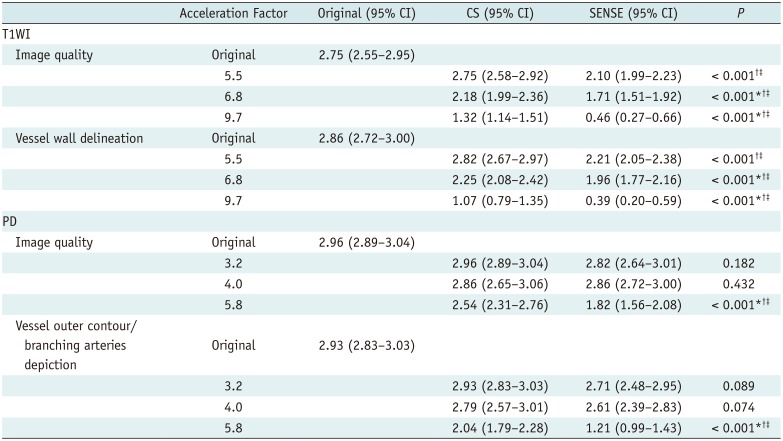
In the current study, HR-MRI of intracranial and extracranial vessels using CS was superior to that using SENSE, yielding higher image quality, better vessel delineation, SNR, and CNR, and a greater proportion of images deemed acceptable. In comparison with the original sequence, CS may be a reliable method for vessel HR-MRI, with comparable image quality and vessel delineation even though T1WI images were acquired in 62% of the original image acquisition time, and PD images were acquired in 50% of the original image acquisition time. CS also yielded acceptable T1WI images at AFt 5.5 and 6.8, and acceptable PD images at AFt 3.2, 4.0, and 5.8.
Reducing the imaging acquisition time may be crucial for expanding the clinical use of vessel wall HR-MRI in daily practice. Of the various sparse reconstruction techniques available, it has been proposed that CS has promise for intracranial and extracranial vessel wall MRI because it can markedly reduce image acquisition time while preserving image quality. In CS, undersampling of k-space data is achieved via a variable-density random method, which means denser sampling in the central k-space than in the peripheral k-space (
1718). The sparsity in the k-space data is compensated for by a sparsifying transformation-such as a wavelet transformation-and iterative reconstruction (
17). Differences in the undersampling of k-space data and the specified reconstruction methods may contribute to improved image quality and reduced scanning time compared with conventional parallel imaging. Nonlinear iterative reconstruction has been used to reconstruct magnetic resonance images from fewer phase encodings, thereby resulting in a marked reduction in image acquisition time (
7).
A previous study demonstrated that a black-blood fast spin echo sequence with CS facilitated a 37% shorter image acquisition time than conventional T1-weighted sampling perfection with application optimized contrasts using different flip angle evolution, while maintaining comparable image quality for intracranial arteries (
9). In the present study, T1WI with CS also yielded image quality and vessel wall delineation that were comparable to those of original imaging sequences, with an image acquisition time that was 38% shorter (62% of the original scanning time). In another study, CS-based simultaneous 3D black-blood and gray-blood imaging yielded image quality that was comparable to that of a fully sampled acquisition for carotid artery visualization, and achieved it in a shorter scanning time (
7). The authors stated that the “signal-to-tissue” and “contrast-to-tissue” ratios did not differ significantly between CS images with AF
t values of 2–5 and original images. In contrast, in the current study SNR and CNR were significantly lower in CS images than in original images, even though image quality and vessel delineation did not differ significantly between them based on results derived from the visual scoring systems. The differences between the results of the two studies may be due to the parameters chosen. The “signal-to-tissue” and “contrast-to-tissue” ratios may reflect the visual assessment more than the quantitative measurements used in the current study (i.e., SNR and CNR).
CS yielded image quality and vessel delineation that were comparable to the original sequences in the present study, with a reduction in image acquisition time of 50% for PD. Vessel HR-MRI generally focused on evaluating arterial walls using T1WI; however, PD imaging with a high SNR also provides useful information on definite vessel contours, detailed vessel anatomy, and small branching arteries (
119). Therefore, the use of CS PD sequences for vessel evaluation is worthy of further assessment. To our knowledge, to date no previous study has evaluated CS PD sequences for intracranial vessel HR-MRI.
In the present study, CS T1WI with AFt 5.5 and 6.8, and SENSE T1WI with AFt 5.5 yielded respective acceptability rates of 100%, 96.4%, and 100%, while CS PD with AFt 3.2, 4.0, and 5.8, and SENSE PD with AFt 3.2 and 4.0 yielded respective acceptability rates of 100%, 92.9%, 82.1%, 92.9%, and 96.4%. At these AFt values, the proportions of acceptable images did not differ significantly from those of the original imaging. According to results derived via the visual scoring systems, acceptable images could be acquired at higher AFt values than would otherwise result in image quality comparable to the original sequences. Thus, in terms of clinical acceptability there may be scope to further shorten the acquisition times for both CS and SENSE sequences.
The present study had several limitations. First, it only included 14 healthy volunteers. Further studies including more patients and various clinical applications are required. Second, even the original T1WI and PD sequences included acceleration factors, which may be a limitation with regard to comparisons between original images and CS and SENSE images. Notably however, in clinical practice vessel wall HR-MRI generally includes an acceleration factor to reduce scanning time, and a previous study also compared CS images with original images that included acceleration factors (
9). Furthermore, we wished to focus on comparing clinically-used original imaging sequences with CS and SENSE imaging. Third, due to limits on available acquisition time, we only evaluated three different acceleration factors. Further efforts to optimize scanning parameters for CS HR-MRI of vessels are warranted. Fourth, because we only evaluated CS (i.e., compressed sensing combined with SENSE) compared to SENSE alone, it is unclear how the image quality of CS compares with that of compressed sensing alone at the same AF
t factors. Further study is warranted in this respect. Fifth, the study did not generate data for contrast-enhanced T1WI, because the use of gadolinium-based contrast agents is not justified in healthy volunteers.
In conclusion, CS was superior to SENSE with regard to image quality, vessel delineation, SNR, CNR, and acceptability in vessel HR-MRI. CS T1WI with AFt of 5.5 and CS PD with AFt of 3.2 and 4.0 may be reliable for HR-MRI of vessels.
Go to :






 PDF
PDF ePub
ePub Citation
 Print
Print


 XML Download