Journal List > Korean J Radiol > v.20(3) > 1116748

Kim, Kim, An, Han, Won, Kim, Kim, and Choi: Evaluation of Early Response to Treatment of Hepatocellular Carcinoma with Yttrium-90 Radioembolization Using Quantitative Computed Tomography Analysis

Abstract

Objective

To identify an imaging predictor for the assessment of early treatment response to yttrium-90 transarterial radioembolization (TARE) in patients with hepatocellular carcinoma (HCC), using a quantitative assessment of dynamic computed tomography (CT) images.

Materials and Methods

Dynamic contrast-enhanced CT was obtained pre- and 4 weeks post-TARE in 44 patients (34 men, 10 women; mean age, 60 years) with HCC. Computer software was developed for measuring the percentage increase in the combined delayed-enhancing area and necrotic area (pD + N) and the percentage increase in the necrotic area (pNI) in the tumor-containing segments pre- and post-TARE. Local progression-free survival (PFS) was compared between patient groups using Cox regression and Kaplan-Meier analyses.

Results

Post-TARE HCC with pD + N ≥ 35.5% showed significantly longer PFS than those with pD + N < 35.5% (p = 0.001). The local tumor progression hazard ratio was 17.3 (p = 0.009) for pD + N < 35.5% versus pD + N ≥ 35.5% groups. HCCs with a high pNI tended to have longer PFS, although this difference did not reach statistical significance.

Conclusion

HCCs with a larger pD + N are less likely to develop local progression after TARE.

INTRODUCTION

Transarterial radioembolization (TARE), using yttrium-90 (90Y) microspheres, is a treatment option for hepatocellular carcinoma (HCC) (12) particularly in intermediate and advanced stages. It produces disease control rates of 77–90% and is usually well-tolerated (3). Although TARE is increasingly popular, the imaging criteria best suited for assessing tumor response to TARE remain unknown.
Response Evaluation Criteria in Solid Tumors (RECIST) were considered the standard for evaluation of solid tumors, which defines responses according to changes in the target lesion size during imaging assessment (4). However, size metrics can be misleading when applied to locoregional therapies in HCC. Thus, the modified RECIST criteria (mRECIST) for HCC consider changes in the degree of tumor arterial enhancement (5). Response evaluation for TARE is difficult, particularly early during follow-up, as tumors shrink relatively slowly after TARE, and arterial enhancement decreases also require a long time before becoming observable (67). RECIST or mRECIST may thus not be adequate for assessment of the early response in TARE-treated HCC. Additional imaging predictors are needed for evaluating prognosis post-TARE.
Radiation reaction can lead to veno-occlusive disease of the liver at 1–3 months after external radiation therapy, and at this stage, portal venous phase or delayed-phase hyperenhancement on computed tomography (CT) is commonly seen due to decreased contrast clearance (89). Similar to external radiation, TARE can cause regional abnormal enhancement, corresponding to veno-occlusive changes (9). Although the therapeutic mechanism of action of TARE is not clearly understood, radiation reaction and necrosis induced by radioembolized material may play a major role. Thus, we postulated that a larger combined delayed-enhancing area and necrotic area (DN) in the tumor-containing segment could be a predictive imaging marker of favorable treatment response during early post-TARE follow-up. However, visual assessment is not suitable for differentiation of the delayed-enhancing area, due to its low contrast and the heterogeneous enhancement of the baseline cirrhotic liver. Therefore, we devised a quantitative method for measuring the DN in the tumor-containing segment.
This study aimed to identify an imaging predictor for assessment of early treatment responses to TARE in patients with HCC, using quantitative assessment of dynamic CT images.

MATERIALS AND METHODS

This study was approved by the Institutional Review Board of our institute, and informed consent was waived due to the study's retrospective nature.

Patients

The records of patients who were treated with 90Y-TARE for HCC at our institute from April 2011 until March 2016 were reviewed. Ninety-three consecutive patients were identified. 90Y-TARE was performed in patients with HCC unsuited to curative treatments, e.g., surgical resection, local ablative therapy (radiofrequency ablation or ethanol injection), and liver transplantation. Inclusion criteria included: patient age of ≥ 20 years, surgically unresectable HCC, single or multifocal measurable HCC without extra-hepatic metastasis, Eastern Cooperative Oncology Group performance status of 0 or 1, Child-Pugh class A or B, and adequate hematological (white blood cell count ≥ 2000/µL, hemoglobin level ≥ 10 g/dL, and platelet count ≥ 105/µL) and renal function (serum creatinine ≤ 1.5 mg/dL). The bilirubin cutoff was less than 2.0 mg/dL, but 3 patients with a bilirubin level exceeding the cutoff value were included, because the tumors were localized, minimizing normal hepatic parenchymal damage.
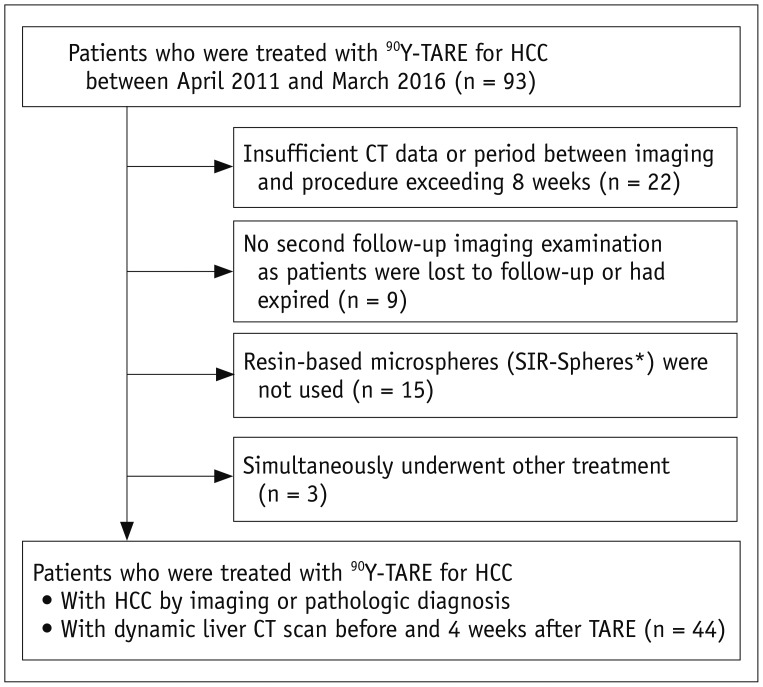
Patients were excluded from the study if they 1) had insufficient CT data or a period between imaging and the procedure exceeding 8 weeks (n = 22), 2) did not undergo a second follow-up imaging examination as they were lost to follow-up or had expired (n = 9), 3) were not treated with resin-based microspheres (n = 15), or 4) had simultaneously undergone other treatments (n = 3) (Fig. 1).
The study population comprised 44 patients (34 men and 10 women; mean age: 60 ± 12 years; age range: 33–91 years) who had undergone dynamic liver CT before and 4 weeks post-TARE (Fig. 1).

TARE with 90Y

All patients underwent diagnostic angiography for evaluating the suitability of the treatment and the dose calculation. Celiac, common hepatic arteriography, and cone-beam CT arteriography were performed to evaluate the tumor feeding artery distribution and to determine the target artery of radioembolization. Twelve patients underwent coil embolization of the cystic artery (n = 10), the accessory left gastric artery (n = 1), and both the right gastric and cystic arteries (n = 1), to avoid non-target embolization of 90Y. Depending upon the extent of tumor burden, patients were treated with either a segmental (n = 12), lobar (n = 20), or lobar and segmental (n = 12) approach. Hepato-pulmonary shunt was evaluated by injection of technetium-99m-labeled macroaggregated albumin at the target artery. We measured the liver and the tumor volume of each patient and the radiation dose was then determined based on the planning angiogram and hepato-pulmonary shuntogram, using a partition model (10), after calculating the proper tumor dose and the safety dose to the lung and normal liver. The target-absorbed radiation dose of the normal liver and lung was not to exceed 70 Gy and 25 Gy, respectively. 90Y was prepared in the Nuclear Medicine Department of our institution, according to the manufacturer's preparation guide. 90Y-resin microspheres (SIR-Spheres; Sirtex Medical, North Sydney, Australia) were infused at the feeding artery of the tumor as selectively as possible within 2 weeks after planning angiography by using a 3-French microcatheter (Terumo, Tokyo, Japan).

CT Imaging Protocol

Four-phase dynamic CT images were obtained before and 4 weeks post-TARE using the same imaging protocol with 16-, 64-, or 128-channel multidetector CT scanners. The CT scanners used pre- and post-procedure were not necessarily the same. First, a pre-contrast CT scan was performed. CT was performed after intravenous administration of 1.5–2.0 mL/kg of iodinated contrast media (300 mg I/mL) for a fixed injection duration of 30 seconds (rate, 2–4 mL/s), followed by a 20-mL saline chaser bolus injection. Injection velocity and duration were adjusted for the individual's vessel condition. Using a bolus-tracking technique, the late arterial phase was performed 18 seconds after the attenuation value reached 100 HU at the abdominal aorta. The portal venous phase and delayed phase were obtained with a scan delay of 30 seconds and 150 seconds after the end of the previous phase, respectively (Table 1).

Assessment of Response

After radioembolization, tumor progression was defined as the emergence of enhanced arterial phase areas, followed by washout in the portal phase, or when nodules had increased in size during the follow-up. When such patterns were observed next to the post-treatment zone, they were regarded as local tumor progression (LTP). LTP was reported for the largest tumor in each patient. LTP was evaluated at each follow-up CT scan, but early treatment response was evaluated 4 weeks post-TARE, based on the RECIST, mRECIST, and newly proposed quantitative criteria.
Two board-certified abdominal radiologists (with 20 and 5 years of experience in abdominal CT, respectively) retrospectively and qualitatively analyzed the pre-TARE CT images and achieved consensus on the following: the largest diameter of the tumor, the largest diameter of the arterial enhancing portion (DAE), number of tumors, bilobar involvement, portal vein invasion (PVI), and hepatic vein invasion.

Quantitative Analysis

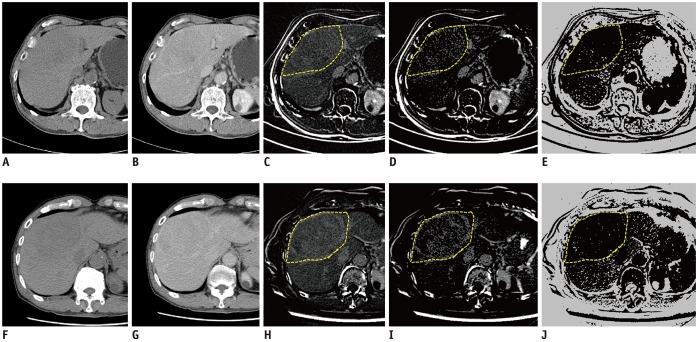
Quantitative analysis was performed using CT images before and 4 weeks post-TARE. Contrast-enhanced dynamic CT studies were retrieved from the institutional archive and loaded onto a standard workstation in digital imaging and communications in medicine format. We subtracted the pre-contrast images from the delayed-phase images to create the delayed-phase enhancement map (11). The delayed-enhancing area was defined as an area with an enhancement greater than the mean value + 2 times the standard deviation (SD) of the normal liver parenchymal enhancement. The necrotic area was defined as an area with an enhancement of 20 HU or less in the delayed phase. The area below the threshold value of the delayed enhancement was removed from the enhancement map. A freehand-drawn region of interest (ROI) was placed along the boundary of the tumor-containing hepatic segment in the cross-section showing the largest diameter of the largest tumor. The ROI was drawn for the whole tumor-containing segment, not for the tumor boundary, to reflect the peritumoral change after treatment and to increase reproducibility. The DN in the ROI was measured automatedly (Fig. 2) on images before and post-TARE, and differences were calculated. Specifically, the increase in the delayed-enhancing area (DI), the increase in the necrotic area (NI), and the increase in the DN (DNI) in the tumor-containing segment were calculated. The percentage increase in these areas (percentage DI [pDI], percentage NI [pNI], percentage DNI [pD + N]) was calculated, as these are more generalizable to clinical practice: percentage increase value = (post-TARE value - pre-TARE value) / pre-TARE value. All processes were performed by an abdominal radiologist with 5-years' experience, using in-house software written in Matlab (version 2017a, MathWorks Inc., Natick, MA, USA) (12). Quantitative analysis is described in full in the Supplementary Materials 1 (in the online-only Data Supplement). One additional radiologist performed measurement of the pD + N, pDI, and pNI to test interreader reproducibility.

Statistical Analysis

The descriptive variables are presented as mean (± SD) values or the median and interquartile range (IQR) values for non-normally distributed data. Local progression-free survival (PFS) was defined as the interval between TARE and death, last follow-up imaging, the most recent follow-up visit, or the date of LTP at post-therapeutic imaging. Patients who had undergone liver transplantation were censored at the date of transplantation. Patients with a lesion that had been additionally treated during the follow-up period, based on clinical considerations other than LTP imaging evidence, were censored. Differences in PFS between patient groups, based on Kaplan-Meier survival curves, were assessed with the log-rank test. Each continuous variable was dichotomized to determine the optimal cutoff value. This procedure considered all possible continuous variables values as potential cutoff points. The cutoff corresponding to the largest difference between the 2 groups was determined based on the log-rank statistic (1314). Univariate and multivariate Cox regression analyses were used for identifying PFS prognostic factors. Factors were entered into the multivariate Cox regression model using backward stepwise selection with the Akaike information criterion, and hazard ratios (HRs) and 95% confidence intervals (CIs) were estimated. The interreader reproducibility was evaluated in terms of the intraclass correlation coefficient (ICC). An ICC value higher than 0.75 indicates good reproducibility (1516). For all tests, statistical significance was set at p < 0.05. R (version 3.3.1, R Foundation for Statistical Computing, Vienna, Austria) was used for all statistical analysis.

RESULTS

Demographics and Patient Disease Characteristics

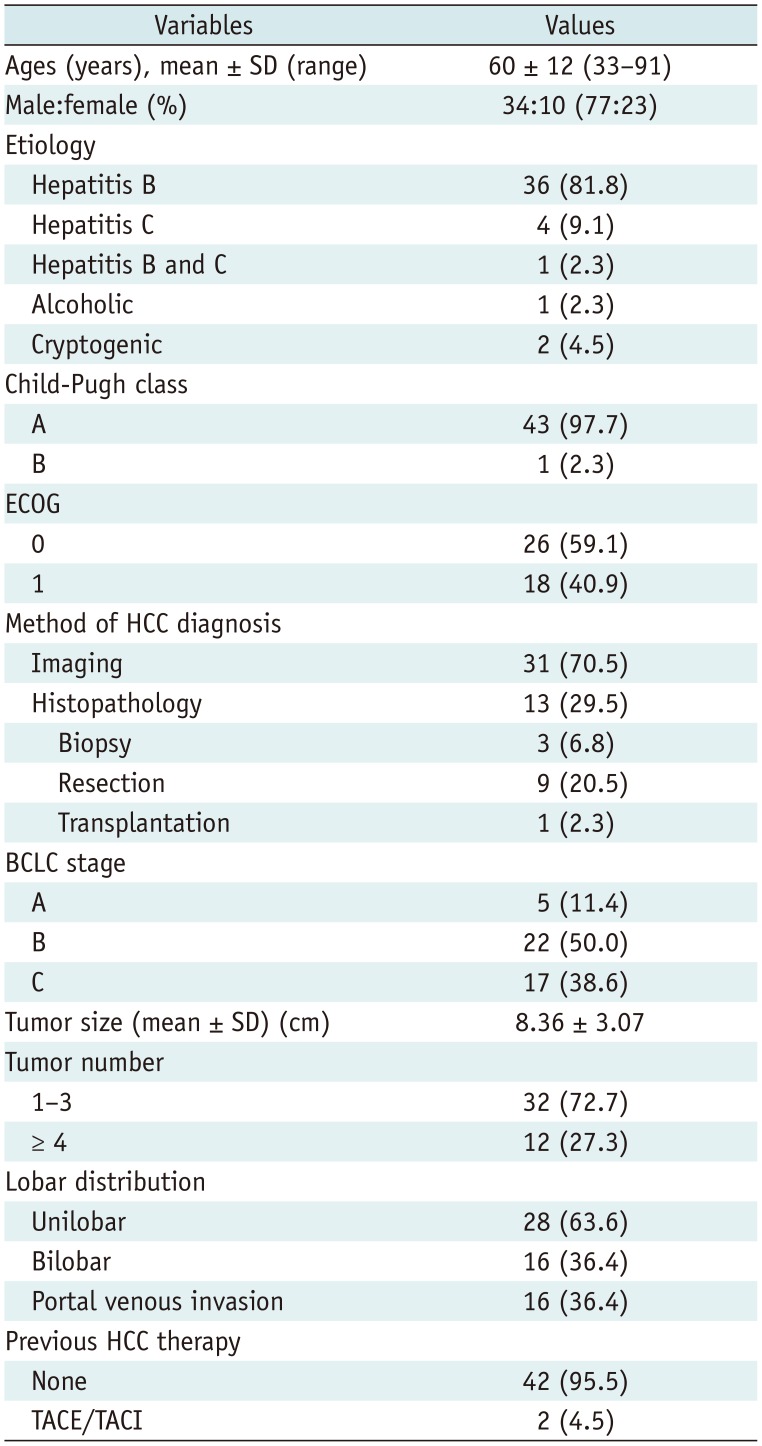
Patient characteristics are described in Table 2.
The first follow-up CT imaging was performed a median 23 days (IQR, 21–28 days) post-TARE. The mean diameters of the tumors were 8.36 ± 3.07 cm and 7.96 ± 3.37 cm before and at the first post-TARE follow-up, respectively, and the median diameter decrease was 2.8% (IQR −3.34% to 15.7%). The mean DAE in tumors were 7.47 ± 3.26 and 6.58 ± 3.50 cm before and at the first follow-up, respectively, and the median decrease in DAE was 10.2% (IQR 0.0–26.6%). The median pD + N was 17.9% (IQR −8.9% to 73.3%), and the median pDI and pNI were 28.7% (IQR −25.4% to 106.9%) and 12.8% (IQR −39.3% to 105.1%), respectively. At first follow-up, 3 (6.8%) and 10 patients (22.7%) showed partial response in RECIST and mRECIST, respectively, and all the other patients showed stable disease.

Patient Outcome

Of the 44 treated HCCs, estimated probabilities of PFSs were 70.6% and 33.5% for 1-year and 2-year post-TARE, respectively. Nine patients (20.5%) underwent hepatic resection and 1 (2.3%) had a liver transplantation post-TARE, with curative intent.
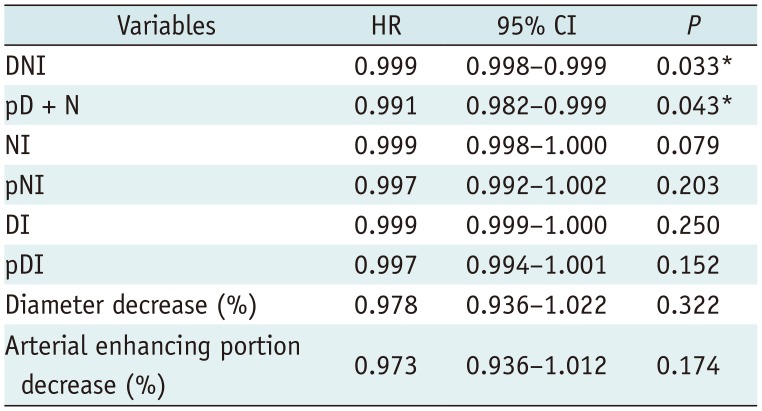
In univariate Cox regression analysis that included DNI, NI, DI, pD + N, pNI, pDI, the tumor diameter decrease (%), and the DAE decrease (%) as continuous variables, DNI and pD + N showed a statistically significant correlation with PFS (DNI, HR 0.999, p = 0.033; pD + N, HR 0.991, p = 0.043); other variables showed no statistical significance (Table 3).
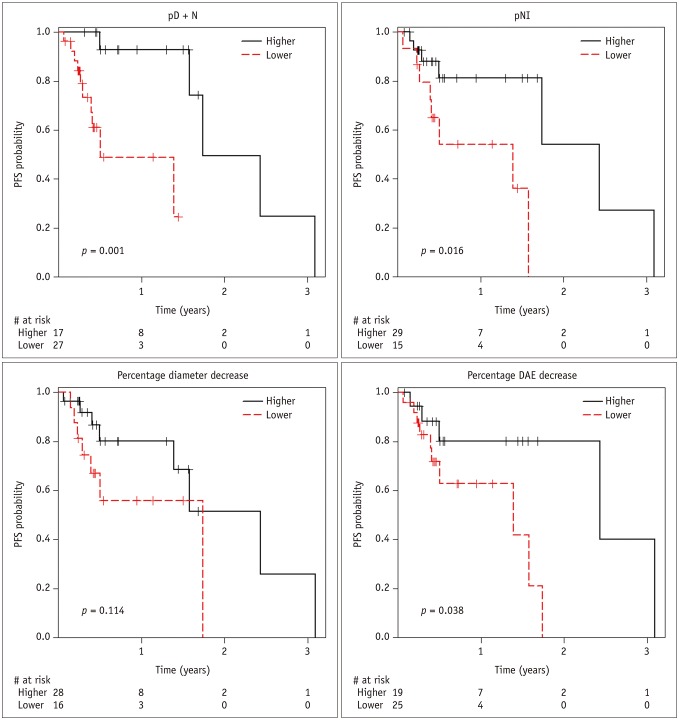
The optimal cutoff points for predicting PFS were 35.5%, −7.1%, 1.4%, and 17.3% for pD + N, pNI, diameter decrease, and DAE decrease, respectively, and each variable was dichotomized into 2 groups: those with values ≥ the optimal cutoff point, and those with values < the optimal cutoff point. In Kaplan-Meier curves, estimated probabilities of PFS were 93.0% at 1-year, and 50.0% at 2-years post-TARE for the higher pD + N group, and 48.9% at 1-year, and 0% at 2-years post-TARE for the lower pD + N group (median PFS, 21.2 months vs. 6.1 months) (Fig. 3). Estimated probabilities of PFS were 81.2% at 1-year, and 54.1% at 2-year post-TARE for the higher pNI group, and 54.2% at 1-year, and 0% at 2-year post-TARE for the lower pNI group (medial PFS, 29.6 months vs. 16.9 months). The PFS of the higher pD + N, higher pNI, and higher DAE decrease groups was significantly greater than that of the lower groups, respectively (pD + N, p = 0.001; pNI, p = 0.016; DAE, p = 0.038; log-rank test).
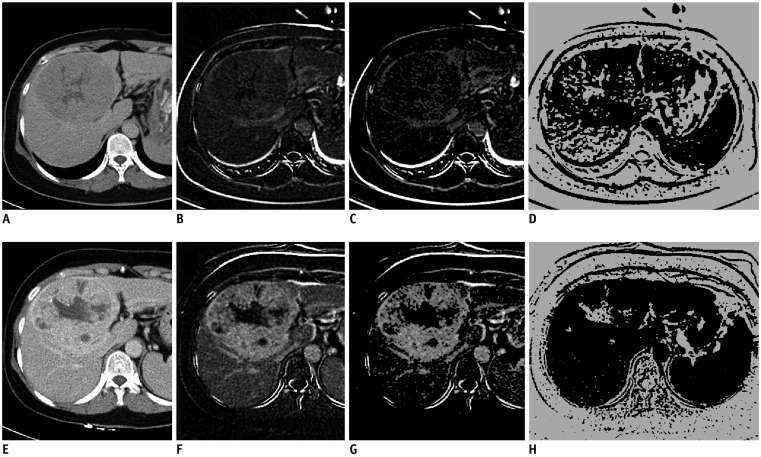
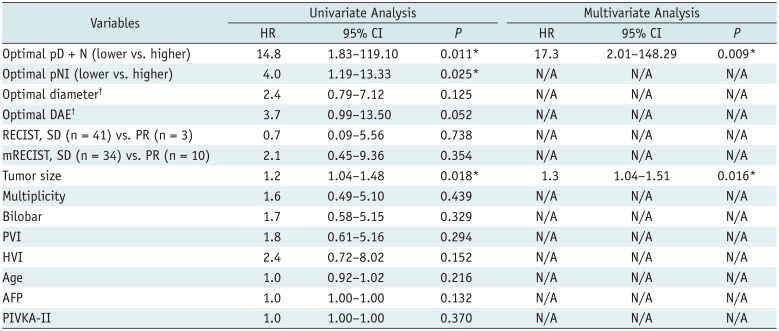
In univariate Cox regression analysis, pD + N (lower vs. higher, HR 14.8, p = 0.011), pNI (lower vs. higher, HR 4.0, p = 0.025) and pre-TARE tumor size (HR 1.2, p = 0.018) significantly predicted PFS (Table 4, Fig. 4). In multivariate analysis, pD + N (lower vs. higher, HR 17.3, p = 0.009) and pre-TARE tumor size (HR 1.3, p = 0.016) were identified as independent PFS predictors.
Measurement on the pD + N, pDI, and pNI showed good interreader reproducibility (ICC; 0.77, 0.86, and 0.84, respectively).

DISCUSSION

We demonstrated that HCCs with a larger pD + N are less likely to develop LTP post-TARE. More specifically, the TARE-treated HCC lesions with pD + N ≥ 35.5% showed a lower probability of PFS than lesions with pD + N < 35.5% (p = 0.001, log-rank test). Using the optimal pD + N cutoff, we could predict a statistically significant difference in PFS at the early follow-up in both univariate (HR 14.8, p = 0.011) and multivariate analysis (HR 17.3, p = 0.009). Neither the RECIST nor mRECIST could predict LTP in the early follow-up period. Thus, pD + N, with an optimal cutoff point, could be used as a predictor for evaluating early responses to TARE.
Radioembolization for hepatic tumor treatment produces some changes, e.g., necrosis, initial paradoxical enlargement, and regions of abnormal enhancement corresponding to veno-occlusive changes in the irradiated vascular territory (917). This is similar to focal active radiation reaction, usually seen as delayed enhancement upon external radiation to the liver (8). We therefore assumed that the delayed-enhancing area is associated with a good prognosis, reflecting an active reaction. Also, post-treatment necrosis indicates a good prognosis (5). Therefore, we analyzed the correlation of pDI, pNI, and pD + N with PFS. pD + N, but not pDI and pNI, correlated significantly with good prognosis, possibly because delayed enhancement may be transformed into necrosis over time. Therefore, measuring the DN may be useful for predicting prognosis at each time point.
The currently accepted standard for treatment response is tumor size, as determined by RECIST or World Health Organization criteria (1819). However, assessing morphological responses of liver malignancies based on size changes may require a long time or may not occur at all after local treatment (20). A recent study has shown that response evaluation models, including tumor enhancement comparisons (mRECIST and European Association for the Study of the Liver), more accurately predicted long-term survival of transcatheter arterial chemoembolization (TACE)-treated HCC patients (21). However, it remains controversial whether a significant decrease in arterial enhancement can be observed by 4 weeks post-TARE for HCC. A decrease in arterial enhancement in liver malignancies has been reported 4–5 weeks post-TARE or post-TACE (620222324). Moreover, significant changes in arterial perfusion of HCC could not be observed by 4 weeks post-TARE in a quantitative analysis of CT perfusion, possibly due to differences in the approach to assessing enhancement (quantitative versus qualitative) (20). In our study, neither the percentage change in diameter nor the DAE correlated with PFS, when using continuous values or a cutoff point, indicating that RECIST or mRECIST could not predict outcomes during the early follow-up period, even though the criteria for the percentage of mRECIST were optimized.
It has been proposed that the extent of necrosis post-TARE could be used for evaluating the early response and a combination of necrosis and tumor size could improve the accuracy of the response assessment in patients with liver metastases (24). However, a relatively long median time to response by necrosis criteria was reported in post-TARE HCCs, 34 days (95% CI: 29–43 days) (7), and response cannot be assessed by 4 weeks. Using pNI with an optimal cutoff correlated with PFS in univariate, but not in multivariate analysis in our study. Interestingly, in the present study, some cases showed a decrease in the necrotic area in the image taken 4 weeks after treatment (Supplementary Materials 2 in the online-only Data Supplement), likely because the initial tumor necrotic area changed to a delayed-enhancing area by contrast-pooling with veno-occlusive and inflammatory changes after TARE. This finding could be explained by abnormal enhancement with paradoxical enlargement, which has been previously reported (917). In particular, the post-TARE duration in the present study was very short, with a median duration of 23 days, suggesting that the early post-TARE change seemed to be dominant.
In the present study, the necrotic area was defined as an area showing an enhancement of 20 HU or less. Previously, an enhancement of 10 HU or more had been generally used as the threshold that defines viability in hepatic tumors (24). However, a recent study suggested that the threshold of 17.1 HU was the best threshold for the detection of pseudoenhancement of the hepatic cyst and that 17.1 HU could be used as the cutoff for nonenhancement in necrotic HCCs (25). Therefore, in the present study, we used 20 HU as the threshold.
Our study has several limitations. First, the number of patients is relatively small. The small sample size had the potential to mask the weak correlations. Further studies with a larger number of patients are needed to ensure clinical relevance. Second, histopathological data were not available, because most tumors were unresectable at diagnosis, or the time between imaging and surgery was too long. However, to the best of our knowledge, there have been few attempts to evaluate histopathologic change within 4 weeks after TARE. Consequently, radiologic findings could be more important during the aforementioned period. Third, in the presence of multiple tumors, only the largest tumor was selected and analyzed to reduce measurement errors. Multiple tumors were likely to be intrahepatic metastases, and as all tumors were treated in the same way, the largest tumor was likely to have a representative therapeutic effect. Fourth, a two-dimensional method was used for evaluating the quantitative measurement. Tumor response after treatment is heterogeneous within the tumor. Therefore, tumor response evaluation on a single CT section might not be representative of the entire tumor's response. However, in a recent study of apparent diffusion coefficient measurement methods for rectal cancer, the diagnostic performance of one slice measurement was comparable to that of three-dimensional (3D) whole tumor volumetry and showed better performance than that of three circular ROI measurements (26). Our study is expected to show similar results, but further studies on 3D measurement are required for accurate measurement. Fifth, the threshold value of the delayed enhancement was arbitrary. Because 2 SD is a commonly used threshold for statistical testing, the threshold value of this study was selected to obtain the area that was distinct from the surrounding hepatic parenchyma, however, further research is needed to determine the optimal threshold value.
In conclusion, quantitative analysis of the pD + N in the tumor-containing segment in early follow-up after TARE may predict PFS in patients with HCC. If the prognosis can be predicted in the early follow-up period, such as within 4 weeks after TARE, we may be able to increase the overall survival rate of the patients who are expected to have a poor prognosis, by allowing them to prepare for other treatments such as liver transplantation.

Notes

This study was supported by a faculty research grant of Yonsei University College of Medicine for 6-2011-0219.

Conflicts of Interest: The authors have no potential conflicts of interest to disclose.

References

1. Kennedy A, Coldwell D, Sangro B, Wasan H, Salem R. Integrating radioembolization ((90)Y microspheres) into current treatment options for liver tumors: introduction to the international working group report. Am J Clin Oncol. 2012; 35:81–90. PMID: 20938320.
2. Kennedy A, Nag S, Salem R, Murthy R, McEwan AJ, Nutting C, et al. Recommendations for radioembolization of hepatic malignancies using yttrium-90 microsphere brachytherapy: a consensus panel report from the radioembolization brachytherapy oncology consortium. Int J Radiat Oncol Biol Phys. 2007; 68:13–23. PMID: 17448867.
crossref
3. Sangro B, Iñarrairaegui M, Bilbao JI. Radioembolization for hepatocellular carcinoma. J Hepatol. 2012; 56:464–473. PMID: 21816126.
crossref
4. Therasse P, Arbuck SG, Eisenhauer EA, Wanders J, Kaplan RS, Rubinstein L, et al. New guidelines to evaluate the response to treatment in solid tumors. European Organization for Research and Treatment of Cancer, National Cancer Institute of the United States, National Cancer Institute of Canada. J Natl Cancer Inst. 2000; 92:205–216. PMID: 10655437.
5. Lencioni R, Llovet JM. Modified RECIST (mRECIST) assessment for hepatocellular carcinoma. Semin Liver Dis. 2010; 30:52–60. PMID: 20175033.
crossref
6. Keppke AL, Salem R, Reddy D, Huang J, Jin J, Larson AC, et al. Imaging of hepatocellular carcinoma after treatment with yttrium-90 microspheres. AJR Am J Roentgenol. 2007; 188:768–775. PMID: 17312067.
crossref
7. Riaz A, Kulik L, Lewandowski RJ, Ryu RK, Giakoumis Spear G, Mulcahy MF, et al. Radiologic-pathologic correlation of hepatocellular carcinoma treated with internal radiation using yttrium-90 microspheres. Hepatology. 2009; 49:1185–1193. PMID: 19133645.
crossref
8. Herfarth KK, Hof H, Bahner ML, Lohr F, Höss A, van Kaick G, et al. Assessment of focal liver reaction by multiphasic CT after stereotactic single-dose radiotherapy of liver tumors. Int J Radiat Oncol Biol Phys. 2003; 57:444–451. PMID: 12957256.
crossref
9. Maturen KE, Feng MU, Wasnik AP, Azar SF, Appelman HD, Francis IR, et al. Imaging effects of radiation therapy in the abdomen and pelvis: evaluating "innocent bystander" tissues. Radiographics. 2013; 33:599–619. PMID: 23479716.
crossref
10. Gulec SA, Mesoloras G, Stabin M. Dosimetric techniques in 90Y-microsphere therapy of liver cancer: the MIRD equations for dose calculations. J Nucl Med. 2006; 47:1209–1211. PMID: 16818957.
11. Tsuji Y, Takahashi N, Fletcher JG, Hough DM, McMenomy BP, Lewis DM, et al. Subtraction color map of contrast-enhanced and unenhanced CT for the prediction of pancreatic necrosis in early stage of acute pancreatitis. AJR Am J Roentgenol. 2014; 202:W349–W356. PMID: 24660733.
crossref
12. Prionas ND, Lindfors KK, Ray S, Huang SY, Beckett LA, Monsky WL, et al. Contrast-enhanced dedicated breast CT: initial clinical experience. Radiology. 2010; 256:714–723. PMID: 20720067.
crossref
13. Contal C, O'Quigley J. An application of changepoint methods in studying the effect of age on survival in breast cancer. Computational Statistics & Data Analysis. 1999; 30:253–270.
crossref
14. Chen BB, Hsu CY, Yu CW, Hou HA, Liu CY, Wei SY, et al. Dynamic contrast-enhanced MR imaging measurement of vertebral bone marrow perfusion may be indicator of outcome of acute myeloid leukemia patients in remission. Radiology. 2011; 258:821–831. PMID: 21212370.
crossref
15. Shrout PE, Fleiss JL. Intraclass correlations: uses in assessing rater reliability. Psychol Bull. 1979; 86:420–428. PMID: 18839484.
crossref
16. Büsing KA, Kilian AK, Schaible T, Debus A, Weiss C, Neff KW. Reliability and validity of MR image lung volume measurement in fetuses with congenital diaphragmatic hernia and in vitro lung models. Radiology. 2008; 246:553–561. PMID: 18055874.
crossref
17. Wong CY, Salem R, Raman S, Gates VL, Dworkin HJ. Evaluating 90Y-glass microsphere treatment response of unresectable colorectal liver metastases by [18F]FDG PET: a comparison with CT or MRI. Eur J Nucl Med Mol Imaging. 2002; 29:815–820. PMID: 12029557.
18. Eisenhauer EA, Therasse P, Bogaerts J, Schwartz LH, Sargent D, Ford R, et al. New response evaluation criteria in solid tumours: revised RECIST guideline (version 1.1). Eur J Cancer. 2009; 45:228–247. PMID: 19097774.
crossref
19. Miller AB, Hoogstraten B, Staquet M, Winkler A. Reporting results of cancer treatment. Cancer. 1981; 47:207–214. PMID: 7459811.
crossref
20. Reiner CS, Morsbach F, Sah BR, Puippe G, Schaefer N, Pfammatter T, et al. Early treatment response evaluation after yttrium-90 radioembolization of liver malignancy with CT perfusion. J Vasc Interv Radiol. 2014; 25:747–759. PMID: 24630751.
crossref
21. Shim JH, Lee HC, Kim SO, Shin YM, Kim KM, Lim YS, et al. Which response criteria best help predict survival of patients with hepatocellular carcinoma following chemoembolization? A validation study of old and new models. Radiology. 2012; 262:708–718. PMID: 22187634.
crossref
22. Li Z, Bonekamp S, Halappa VG, Corona-Villalobos CP, Pawlik T, Bhagat N, et al. Islet cell liver metastases: assessment of volumetric early response with functional MR imaging after transarterial chemoembolization. Radiology. 2012; 264:97–109. PMID: 22627602.
crossref
23. Gowdra Halappa V, Corona-Villalobos CP, Bonekamp S, Li Z, Reyes D, Cosgrove D, et al. Neuroendocrine liver metastasis treated by using intraarterial therapy: volumetric functional imaging biomarkers of early tumor response and survival. Radiology. 2013; 266:502–513. PMID: 23192780.
crossref
24. Miller FH, Keppke AL, Reddy D, Huang J, Jin J, Mulcahy MF, et al. Response of liver metastases after treatment with yttrium-90 microspheres: role of size, necrosis, and PET. AJR Am J Roentgenol. 2007; 188:776–783. PMID: 17312068.
crossref
25. Arslanoglu A, Chalian H, Sodagari F, Seyal AR, Töre HG, Salem R, et al. Threshold for enhancement in treated hepatocellular carcinoma on MDCT: effect on necrosis quantification. AJR Am J Roentgenol. 2016; 206:536–543. PMID: 26901009.
crossref
26. Blazic IM, Lilic GB, Gajic MM. Quantitative assessment of rectal cancer response to neoadjuvant combined chemotherapy and radiation therapy: comparison of three methods of positioning region of interest for ADC measurements at diffusion-weighted MR imaging. Radiology. 2017; 282:418–428. PMID: 27253423.
crossref

Supplementary Materials

The online-only Data Supplement is available with this article at https://doi.org/10.3348/kjr.2018.0469.

SUPPLEMENTARY MATERIALS 1

kjr-20-449-s001.pdf

SUPPLEMENTARY MATERIALS 2

kjr-20-449-s002.pdf
Fig. 1

Flowchart shows inclusion and exclusion criteria for present study.

*SIR-Spheres; Sirtex Medical. CT = computed tomography, HCC = hepatocellular carcinoma, TARE = transarterial radioembolization, 90Y = yttrium-90
kjr-20-449-g001
Fig. 2

Serial steps in quantitative measurement of pD + N pre- and post-TARE, pre-treatment images (A–E), post-treatment images (F–J).

(A, F) Pre-contrast, (B, G) delayed phase, (C, H) subtraction image from pre-contrast and delayed phase images, (D, I) map of delayed enhancement after removing area below threshold. Freehand-drawn ROI (yellow dot line) was placed along boundary of tumor-containing hepatic segments in map of delayed enhancement (C, H), then software automatically selected same regions in other processed images (D, E, I, J). This ROI was commonly used to measure combined delayed-enhancing area and necrotic area in each map. (E, J) map of non–enhancing area. pD + N = percentage increase in combined delayed-enhancing area and necrotic area, ROI = region of interest
kjr-20-449-g002
Fig. 3

PFS curves according to parameters of quantitative analysis.

DAE = largest diameter of arterial enhancing portion, PFS = local progression-free survival, pNI = percentage increase in necrotic area
kjr-20-449-g003
Fig. 4

Liver CT images of 53-year-old woman with HCC before TARE (A–D) and 4 weeks after treatment (E–H).

(A, E) Delayed phase, (B, F) subtraction image from pre-contrast and delayed phase images, (C, G) map of delayed enhancement. (D, H) map of necrosis. Measured value of pD + N in tumor-containing segments was 94.9%. Maximal diameter of tumor and maximal DAE in tumor were decreased only 1.9% and 2.1%, respectively. Tumor did not recur until 19 months.
kjr-20-449-g004
Table 1

CT Parameters

kjr-20-449-i001
Parameters Sensation 16 Sensation 64 SOMATOM Definition Flash Lightspeed VCT Ingenuity
No. of channels 16 64 64 64 128
Section collimation* 16 × 0.75 64 × 0.600 64 × 0.600 64 × 0.625 64 × 0.625
Slice thickness (mm) 3–5 3–5 3–5 3–5 3–5
Pitch 1 0.6 0.6 0.9840 0.9840
Tube current (mAs) 240 170 170 150–350 127–300§
Rotation time (sec) 0.5 0.5 0.5 0.5 0.5
Tube voltage (kV) 120 100–120 100–120 100–120 100–120
Matrix 512 × 512 512 × 512 512 × 512 512 × 512 512 × 512

Following CT scanners were used: Sensation 16, Sensation 64, and SOMATOM Definition Flash (Siemens Healthineers); Lightspeed VCT (GE Healthcare); and Ingenuity (Philips Medical). *Number of detector rows times section thickness (mm), Reference milliampere-seconds, Noise index 21.45, §Dose right index 20. CT = computed tomography

Table 2

Baseline Patient and Tumor Characteristics

kjr-20-449-i002
Variables Values
Ages (years), mean ± SD (range) 60 ± 12 (33–91)
Male:female (%) 34:10 (77:23)
Etiology
 Hepatitis B 36 (81.8)
 Hepatitis C 4 (9.1)
 Hepatitis B and C 1 (2.3)
 Alcoholic 1 (2.3)
 Cryptogenic 2 (4.5)
Child-Pugh class
 A 43 (97.7)
 B 1 (2.3)
ECOG
 0 26 (59.1)
 1 18 (40.9)
Method of HCC diagnosis
 Imaging 31 (70.5)
 Histopathology 13 (29.5)
  Biopsy 3 (6.8)
  Resection 9 (20.5)
  Transplantation 1 (2.3)
BCLC stage
 A 5 (11.4)
 B 22 (50.0)
 C 17 (38.6)
Tumor size (mean ± SD) (cm) 8.36 ± 3.07
Tumor number
 1–3 32 (72.7)
 ≥ 4 12 (27.3)
Lobar distribution
 Unilobar 28 (63.6)
 Bilobar 16 (36.4)
 Portal venous invasion 16 (36.4)
Previous HCC therapy
 None 42 (95.5)
 TACE/TACI 2 (4.5)

Data are presented as numbers and percentage (in parentheses). BCLC = Barcelona Clinic Liver Cancer, ECOG = Eastern Cooperative Oncology Group performance status, HCC = hepatocellular carcinoma, SD = standard deviation, TACE = transcatheter arterial chemoembolization, TACI = transcatheter arterial chemoinfusion

Table 3

Univariate Cox Regression Analysis for PFS

kjr-20-449-i003
HR 95% CI P
DNI 0.999 0.998–0.999 0.033*
pD + N 0.991 0.982–0.999 0.043*
NI 0.999 0.998–1.000 0.079
pNI 0.997 0.992–1.002 0.203
DI 0.999 0.999–1.000 0.250
pDI 0.997 0.994–1.001 0.152
Diameter 0.978 0.936–1.022 0.322
Arterial enhancing portion decrease (%) 0.973 0.936–1.012 0.174

*Statistically significant. CI = confidence interval, DI = increase in delayed-enhancing area, DNI = increase in combined delayed-enhancing area and necrotic area, HR = hazard ratio, NI = increase in necrotic area, pD + N = percentage DNI, pDI = percentage DI, PFS = local progression-free survival, pNI = percentage NI

Table 4

Results of Cox Regression Analysis for PFS

kjr-20-449-i004
Variables Univariate Analysis Multivariate Analysis
HR 95% CI P HR 95% CI P
Optimal pD + N (lower vs. higher) 14.8 1.83–119.10 0.011* 17.3 2.01–148.29 0.009*
Optimal pNI (lower vs. higher) 4.0 1.19–13.33 0.025* N/A N/A N/A
Optimal diameter 2.4 0.79–7.12 0.125 N/A N/A N/A
Optimal DAE 3.7 0.99–13.50 0.052 N/A N/A N/A
RECIST, SD (n = 41) vs. PR (n = 3) 0.7 0.09–5.56 0.738 N/A N/A N/A
mRECIST, SD (n = 34) vs. PR (n = 10) 2.1 0.45–9.36 0.354 N/A N/A N/A
Tumor size 1.2 1.04–1.48 0.018* 1.3 1.04–1.51 0.016*
Multiplicity 1.6 0.49–5.10 0.439 N/A N/A N/A
Bilobar 1.7 0.58–5.15 0.329 N/A N/A N/A
PVI 1.8 0.61–5.16 0.294 N/A N/A N/A
HVI 2.4 0.72–8.02 0.152 N/A N/A N/A
Age 1.0 0.92–1.02 0.216 N/A N/A N/A
AFP 1.0 1.00–1.00 0.132 N/A N/A N/A
PIVKA-II 1.0 1.00–1.00 0.370 N/A N/A N/A

Prefix optimal means that following variable was dichotomized by optimal threshold value. *Statistically significant, Group with decreased percentage of diameter or DAE less than optimal threshold value vs. group with higher value. AFP = alpha–fetoprotein, DAE = largest diameter of arterial enhancing portion, HVI = hepatic vein invasion, mRECIST = modified RECIST criteria, N/A = not available, PIVKA-II = protein induced by vitamin K absence or antagonist II, PR = partial response, PVI = portal vein invasion, RECIST = Response Evaluation Criteria in Solid Tumors, SD = stable disease

TOOLS
Similar articles