

 PDF
PDF ePub
ePub Citation
 Print
Print


INTRODUCTION
In breast cancers, angiogenesis, the process of new blood vessel formation, plays a crucial role in tumor growth, invasion, and distant metastasis (12). Dynamic contrast-enhanced magnetic resonance imaging (DCE-MRI) allows indirect estimation of the tissue vasculature which is thought to be associated with tumor angiogenesis (3). In clinical practice, kinetic profiles of breast DCE-MRI can be assessed using manual measurements or computer-aided diagnosis (CAD). CAD is a post-processing software program that promptly analyzes detailed kinetics (4) and provides quantitative kinetic information (56). Recently, several studies have revealed that kinetic features analyzed using CAD correlated with survival outcomes in invasive breast cancer patients (78910). One study showed that a higher peak enhancement and a higher washout component were associated with poorer disease-free survival, and peak enhancement enabled differentiation of patients with or without recurrence (7). Another study reported that angio-volume and peak enhancement correlated with poorer survival outcomes (8). CAD-assessed kinetic features were also used to predict response or prognosis in cancer patients undergoing neoadjuvant chemotherapy (NAC) (91011). A higher plateau component within a tumor before NAC was reported to have a negative impact on the complete pathologic response of NAC (9), and smaller reductions in both angio-volume and washout component after NAC were reported to be associated with poor overall outcome (10). Therefore, CAD of DCE-MRI could be not only a diagnostic but also a prognostic tool. For the use of these kinetic features in the development of prognosis prediction model as imaging biomarkers, the association between kinetic features and clinical-pathologic factors should be clearly clarified. To the best of our knowledge, there has been only one study to reveal the association between CAD-assessed kinetic features and several prognostic factors, including lymph node (LN) status, tumor grade, expression statuses of estrogen receptor (ER), progesterone receptor (PR), human epidermal growth factor receptor type 2 (HER2) (12). In that study, plateau voxel volumes were independent predictors of ER/PR and HER2 statuses, and the strongest peak enhancement predicted negative ER/PR (12). However, there is still lack of evidence regarding the correlation and further studies are needed. Therefore, we investigated the association of CAD-assessed kinetic features in invasive breast cancer patients with a wider spectrum of clinical-pathologic factors and aimed to find kinetic features which could correlate with clinical-pathologic prognostic factors.
Go to : 
MATERIALS AND METHODS
Study Population
This retrospective study was performed with Institutional Review Board (IRB) approval and the requirement for obtaining informed patient consent was waived (IRB number 2018AN0128). Between July 2016 and March 2017, 114 consecutive women with newly diagnosed invasive breast cancers, confirmed with imaging-guided core needle biopsy, underwent preoperative DCE-MRI and CAD. We excluded women who 1) received NAC before surgery (n = 19), 2) had inadequate CAD-assessed images (n = 7), and 3) did not undergo curative surgery at our institution (n = 3). Thus, 85 women (mean age, 54 years; age range, 35–81 years) with 85 invasive breast cancers were enrolled in this study. Of the 85 women, 65 (76.5%) had single lesions, and 20 (23.5%) had multiple lesions. In case of multiple lesions, only the largest lesion was selected for the analysis. Of the 85 women, 60 underwent breast conserving surgeries and 25 underwent mastectomies. The median interval between DCE-MRI and surgery was 7 days (range, 2–29 days).
MRI Technique
All MRI examinations were performed using a MAGNETOM Prisma 3T scanner (Siemens Healthineers, Erlangen, Germany) with a dedicated, phased array breast coil in the axial orientation; patients were placed in the prone position. After a bilateral transverse localizer image was acquired, axial fat-suppressed T2-weighted turbo spin-echo images were obtained. DCE-MRI images including one pre-contrast and five post-contrast enhanced images were acquired with bilateral axial, fat-suppressed, T1-weighted three-dimensional gradient echo sequence (6.0/2.0; matrix, 384 x 384; flip angle, 15°; field of view, 360 x 360 mm; section thickness, 1.0 mm; no gap). A bolus of 0.1 mmol/kg gadoterate (Dotarem; Guerbet, Villepinte, France) was intravenously injected. Five contrast-enhanced images were obtained at 60, 120, 180, 240, and 300 seconds.
MR Image Analysis
Two breast radiologists with 17 and 7 years' experience in breast radiology, respectively, assessed the morphological characteristics of each lesion according to the breast imaging reporting and data system (BI-RADS) MRI atlas of the American College of Radiology (13), reaching a consensus in each case. In accordance with the BI-RADS atlas (13), the following descriptors were used to analyze mass and non-mass enhancement.
CAD Image Analysis
For CAD analysis, all magnetic resonance (MR) images were transferred to CAD system (CADstream, version 6.0, Confirma, Kirkland, WA, USA) and processed for the assessment of kinetic parameters. According to previous studies suggesting that the most appropriate threshold in the CAD system would be 50–60% to balance the sensitivity and specificity (1415), we selected a 50% threshold. A color-overlay angio-map was placed at all enhancing lesions above a set threshold of 50%. When one radiologist selected the largest tumor on angio-map, the following parameters were calculated for each lesion: peak enhancement (highest pixel signal intensity at the first post-contrast images), angio-volume (total enhancing lesion volume), early phase profiles, and delayed phase profiles (Figs. 1, 2). The early phase profiles were summarized as percentage of medium (50–100%), or rapid (> 100%) enhancement components within a tumor. The delayed phase profiles were summarized as persistent, plateau, and washout components within a tumor. The persistent components represented pixel signal intensity with at least a 10% increase; the plateau components indicated pixel signal intensity with a less than 10% increase, and a less than 10% decrease; the washout components represented pixel signal intensity with at least a 10% decrease in the last post-contrast series compared to first post-contrast series.
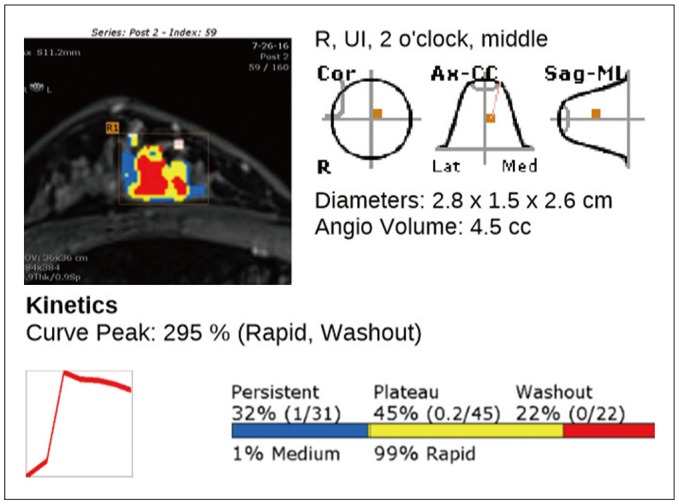 | Fig. 1MR image with CAD angio-map of 48-year-old woman with right breast cancer.Auto-portfolio of CAD system indicates tumor enhancement kinetics with 295% peak enhancement, 99% early-rapid component and 45% delayed-plateau component. Patient underwent modified radical mastectomy. Surgical pathologic examination revealed 2.8-cm invasive ductal carcinoma with histologic grade III that was ER negative, PR negative, and HER2 positive. Axillary LN metastasis was not found. Ki-67 index was 20%. CAD = computer-aided diagnosis, ER = estrogen receptor, HER2 = human epidermal growth factor receptor type 2, LN= lymph node, MR = magnetic resonance, PR = progesterone receptor
|
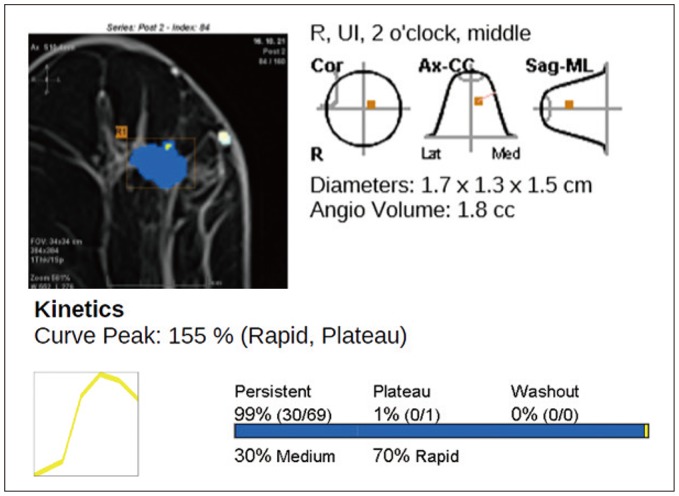 | Fig. 2MR image with CAD angio-map of 66-year-old woman with right breast cancer.Auto-portfolio of CAD system indicates tumor enhancement kinetics with 155% peak enhancement, 70% early-rapid component and 1% delayed-plateau component. Patient underwent breast-conserving surgery. Surgical pathologic examination revealed 1.6-cm invasive ductal carcinoma with histologic grade I that was ER positive, PR negative, and HER2 negative. Axillary LN metastasis was not found. Ki-67 index was 5%.
|
Clinical-Pathologic Evaluation
Clinical-pathologic data including age, tumor size, histologic type, histologic grade according to the Nottingham combined histologic grading system (16), presence of ductal carcinoma in situ (DCIS), LN status, lymphovascular invasion (LVI), Ki-67 index, ER, PR and HER2 status were collected. The ER or PR positivity was indicated by stained nuclei in > 1% of cancer cells on 10 high-power fields. The HER2 staining intensity was scored as 0, 1+, 2+, or 3+ (17). Tumors with 3+ scores were classified as HER2-positive, whereas those with scores of 0 or 1+ as HER2-negative. Tumors with 2+ scores were further investigated with fluorescence in situ hybridization to determine the HER2 status. For the Ki-67 index status, we used a cutoff value of 14% for classification into low- and high-expression groups (18).
Data and Statistical Analysis
All cases were assigned to one of two groups as per dichotomized clinical-pathologic factors according to the following criteria: age (< 50 years or ≥ 50 years), histologic type (invasive ductal or others), histologic grade (low [I, II] or high [III]), presence of DCIS (absent, focal, or present), tumor size (< 2 cm or ≥ 2 cm), LN status (negative or positive), LVI (absent or present), ER status (negative or positive), PR status (negative or positive), HER2 status (negative or positive), and Ki-67 index (< 14% or ≥ 14%). Mann-Whitney U tests or Kruskal-Wallis test were used for comparison between two or three groups.
The Spearman rank correlation test was used to acquire the correlation coefficient rho (r) between kinetic features and clinical-pathologic factors which were continuous variables and showed statistical significances in Mann-Whitney U tests.
In order to reveal independent predictor factors, kinetic features with significant differences between clinical-pathologic features in univariate analysis were further assessed using binary logistic regression analysis with backward feature elimination, using dichotomized clinical-pathologic features as dependent variables and kinetic features as covariates.
All data analyses were performed using SPSS Statistics for Windows, Version 20 (IBM Corp., Armonk, NY, USA); p values < 0.05 were considered significant.
Go to :
RESULTS
Clinical-Pathologic Factors and Morphologic Characteristics
The vast majority of histologic type of the cancers (75 of 85, 88.2%) were invasive ductal carcinomas, not otherwise specified, and remaining cancers (10 of 85, 11.8%) included 3 invasive micropapillary carcinomas, 3 invasive lobular carcinomas, 2 invasive cribriform carcinomas, 1 invasive medullary carcinoma, and 1 invasive mucinous carcinoma. Fifty cancers (58.8%) were histologic grades I or II (11 cancers for grade I, 39 cancers for grade II) and 35 (41.2%) were grade III. Forty-six patients had a DCIS component (54.1%). The mean size of the 85 invasive cancers was 1.8 cm (range: 0.8–4.8 cm); 51 patients had a pT1 (< 2 cm) and 34 had a pT2 (≥ 2 cm). Eighteen patients (21.2%) had positive axillary LNs; 10 (11.8%) had positive LVIs. The cancers of 72 patients (84.7%) were ER-positive, 65 (76.5%) were PR-positive, and 28 (32.9%) were HER2-positive. Thirty-nine patients (45.9%) had high Ki-67 (Table 1). Of the 85 lesions, 75 (88.2%) were masses, and 10 (11.8%) were non-mass enhancements. Among 75 masses, not circumscribed margin was only associated with positive LN status (p = 0.044) (Table 2).
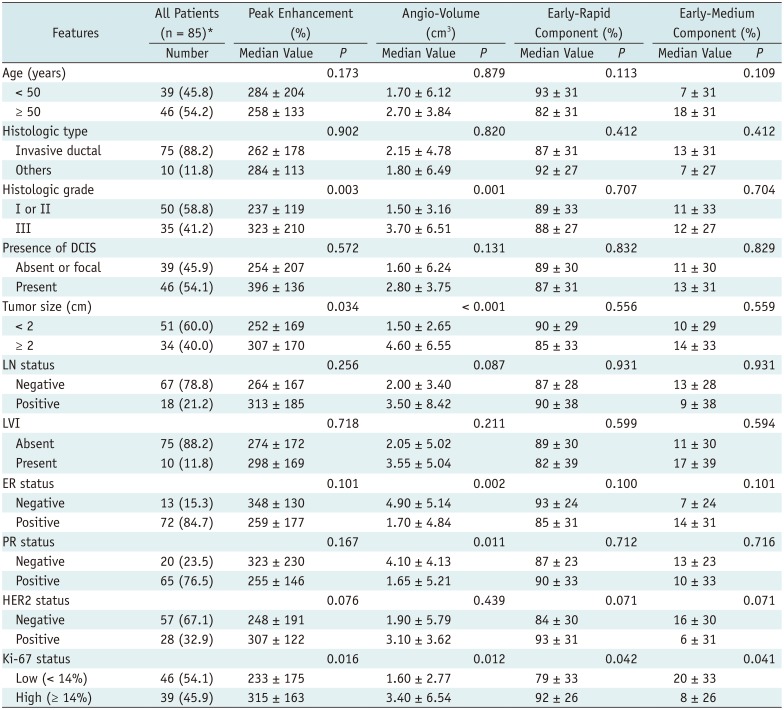

Table 1
CAD-Assessed Peak Enhancement, Angio-Volume, and Early Phase Enhancement Kinetic Features According to Clinical-Pathologic Prognostic Factors of 85 Invasive Breast Cancers
![]()
Table 2
Association of Shape, Margin, and Internal Enhancement Characteristics According to Clinical-Pathologic Prognostic Factors of 75 Invasive Breast Cancers Representing as Masses
![]()
CAD-Assessed Kinetic Features According to Clinical-Pathologic Factors
The median peak enhancement was higher in high-grade tumors than in low-grade tumors (323 ± 210% vs. 237 ± 119%, p = 0.003) (Table 1). It was higher according to higher histologic grade at Kruskal-Wallis test (194 ± 141% in tumors with grade I, 255 ± 113% in tumors with grade II, and 323 ± 210% in tumors with grade III, p = 0.005) (Fig. 3A). The median peak enhancement was also higher in tumors with high Ki-67 index than in tumors with low Ki-67 index (315 ± 163% vs. 233 ± 175%, p = 0.016), and in tumors ≥ 2 cm than in tumors < 2 cm (307 ± 170% vs. 252 ± 167%, p = 0.034).
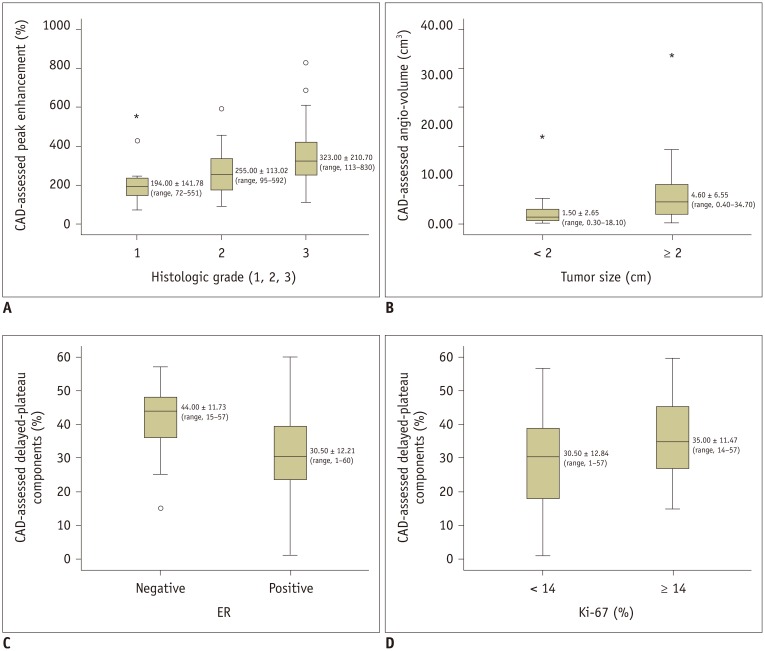 | Fig. 3Boxplots of CAD-assessed kinetic features according to clinical-pathologic factors.
A. Median peak enhancement was significantly higher according to higher histologic grade (p = 0.005). B. Median angio-volume was significantly larger in tumors ≥ 2 cm than in tumors < 2 cm (p < 0.001). C. Median delayed-plateau component was significantly higher in ER-negative tumors than in ER-positive tumors (p = 0.006). D. Median delayed-plateau component was significantly higher in tumors with high Ki-67 index than in tumors with low Ki-67 index (p = 0.030).
|
The median angio-volume was larger in high-grade tumors than in low-grade tumors (3.70 ± 6.51 cm3 vs. 1.50 ± 3.16 cm3, p = 0.001), in tumors ≥ 2 cm than in tumors < 2 cm (4.60 ± 6.55 cm3 vs. 1.50 ± 2.65 cm3, p < 0.001) (Fig. 3B), in ER-negative tumors than in ER-positive tumors (4.90 ± 5.14 cm3 vs. 1.70 ± 4.84 cm3, p = 0.002), in PR-negative tumors than in PR-positive tumors (4.10 ± 4.13 cm3 vs. 1.65 ± 5.21 cm3, p = 0.011), and in tumors with high Ki-67 index than in tumors with low Ki-67 index (3.40 ± 6.54 cm3 vs. 1.60 ± 2.77 cm3, p = 0.012).
Of early phase enhancement profiles, the median rapid component was higher in tumors with high Ki-67 index than in tumors with low Ki-67 index (92 ± 26% vs. 79 ± 33%, p = 0.042). Of delayed phase enhancement profiles, the median plateau component was higher in ER-negative tumors than in ER-positive tumors (44 ± 11% vs. 30 ± 12%, p = 0.006) (Fig. 3C), and in tumors with high Ki-67 index than in tumors with low Ki-67 index (35 ± 11% vs. 30 ± 12%, p = 0.030) (Fig. 3D) (Table 3).

Table 3
CAD-Assessed Delayed Phase Enhancement Kinetic Features According to Clinical-Pathologic Prognostic Factors of 85 Invasive Breast Cancers
![]()
Correlation between Kinetic Features and Clinical-Pathologic Factors
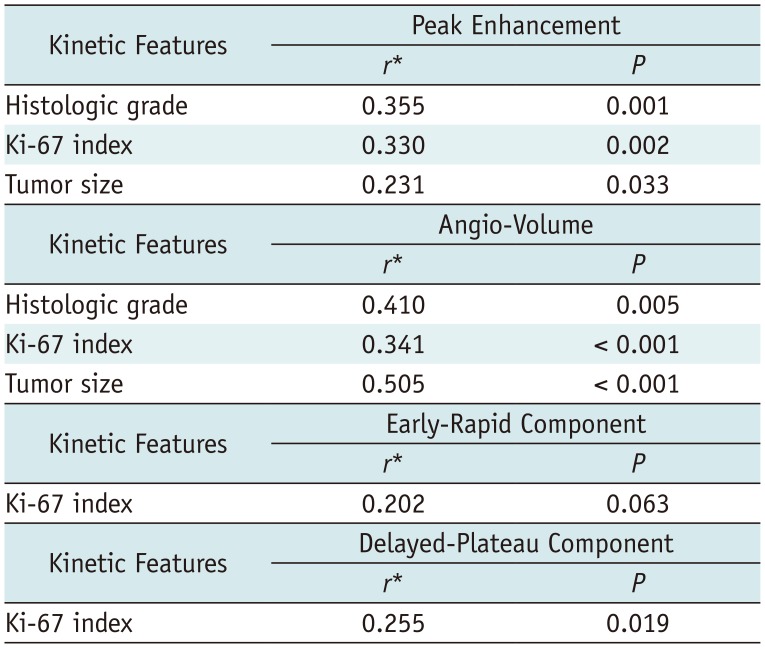
On correlation test, both peak enhancement and angio-volume correlated with histologic grade, Ki-67 index, and tumor size (r = 0.355 [p = 0.001], r = 0.330 [p = 0.002], and r = 0.231 [p = 0.033] for peak enhancement, r = 0.410 [p = 0.005], r = 0.341 [p < 0.001], and r = 0.505 [p < 0.001] for angio-volume) (Fig. 4). Plateau component correlated with Ki-67 index (r = 0.255 [p = 0.019]), however, correlation coefficient between rapid component and Ki-67 index did not reach statistical significance (r = 0.202 [p = 0.063]) (Table 4).
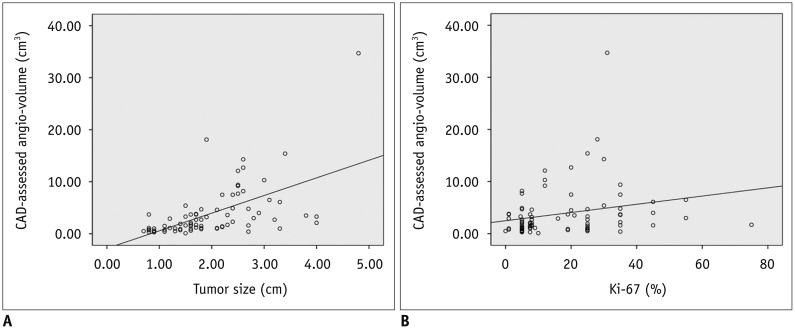 | Fig. 4Scatter plots of angio-volume according to tumor size and Ki-67 index.
A. Angio-volume was significantly correlated with tumor size (Spearman's rho = 0.505, p < 0.001). B. Angio-volume was significantly correlated with Ki-67 index (Spearman's rho = 0.341, p < 0.001).
|
Table 4
Results of Correlation Test of CAD-Assessed Kinetic Features and Clinical-Pathologic Prognostic Factors
| Kinetic Features | Peak Enhancement | |
|---|---|---|
| r* | P | |
| Histologic grade | 0.355 | 0.001 |
| Ki-67 index | 0.330 | 0.002 |
| Tumor size | 0.231 | 0.033 |
| Kinetic Features | Angio-Volume | |
|---|---|---|
| r* | P | |
| Histologic grade | 0.410 | 0.005 |
| Ki-67 index | 0.341 | < 0.001 |
| Tumor size | 0.505 | < 0.001 |
| Kinetic Features | Early-Rapid Component | |
|---|---|---|
| r* | P | |
| Ki-67 index | 0.202 | 0.063 |
| Kinetic Features | Delayed-Plateau Component | |
|---|---|---|
| r* | P | |
| Ki-67 index | 0.255 | 0.019 |
![]()
Binary Logistic Regression Analysis
In binary logistic regression analysis, higher peak enhancement was associated with higher histologic grade (odds ratio [OR] = 1.004; 95% confidence interval [CI]: 1.001, 1.008; p = 0.024), larger angio-volume was associated with larger tumor size (OR = 1.384; 95% CI: 1.141, 1.679; p = 0.001), higher delayed-plateau component was associated with negative ER status (OR = 0.928; 95% CI: 0.877, 0.982; p = 0.010), and both higher delayed-plateau component and angio-volume were associated with higher Ki-67 index (OR = 1.051; 95% CI: 1.011, 1.094; p = 0.013 for delayed-plateau component, OR = 1.178; 95% CI: 1.023, 1.356; p = 0.023 for angio-volume) (Table 5).
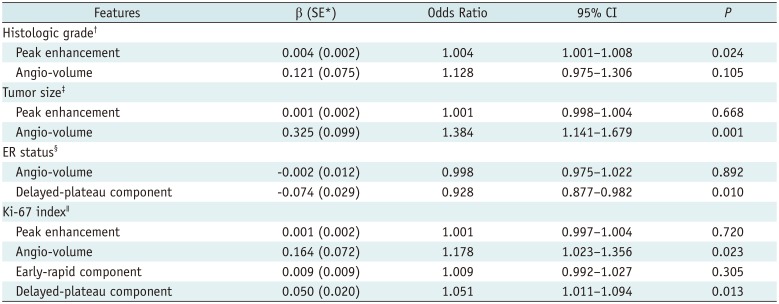
Table 5
Results of Binary Logistic Regression Analysis
*Standard error of estimate, †Dependent variable was histological grade with grouping 1 and 2 vs. 3; independent variables were peak enhancement and angio-volume, ‡Dependent variable was tumor size with grouping < 2 cm vs. ≥ 2 cm; independent variables were peak enhancement and angio-volume, §Dependent variable was ER status grouping negative vs. positive; independent variables were angio-volume and delayed-plateau component, ∥Dependent variable was Ki-67 with grouping < 14% vs. ≥ 14%; independent variables were peak enhancement, angio-volume, early-rapid component, and delayed-plateau component. CI = confidence interval
![]()
Go to :
DISCUSSION
In this study, the association of kinetic features acquired using CAD from 3T MRI with clinical-pathologic factors was demonstrated in 85 invasive breast cancer patients. We revealed that higher peak enhancement was associated with higher histologic grade, larger angio-volume was associated with larger tumor size, higher delayed-plateau component was associated with negative ER status, and both higher delayed-plateau component and angio-volume were associated with higher Ki-67 index.
Increased peak enhancement has been considered indicative of aggressiveness, as highly vascularized cancers may reveal a higher uptake of contrast media due to angiogenesis (121920). Indeed, increased peak enhancement has proven to be associated with poorer survival outcomes (78). For the use of peak enhancement as a prognostic tool, it is necessary to understand the relationship with prognostic factors. According to two studies that used manually drawn region-of-interest (ROI) method at the most enhancing part of the tumor from 1T MRI (2122), peak enhancement was associated with histologic grade and LN metastasis. However, two other studies that used CAD or ROI method from 1.5T MRI revealed that peak enhancement did not show differences according to the two aforementioned factors (1223), but did show a correlation with ER status (12) or with tumor size (23). In our study, peak enhancement increased according to increased histologic grade, tumor size, and Ki-67 index, but LN metastasis or ER status did not affect the peak enhancement. Considering that the three strongest prognostic factors in operable breast cancers are tumor size, histologic grade, and LN stage (24), our results can explain why peak enhancement differentiates patients with and without recurrence with a 0.728 of area under the receiver operating characteristic curve in a recent study (7). Moreover, in our binary logistic regression analysis, higher peak enhancement was independently associated with higher histologic grade. Therefore, peak enhancement can be considered as a useful imaging biomarker reflecting histologic grade for estimating prognosis in breast cancer patients.
Angio-volume has been a known indicator for predicting response of NAC or for survival outcomes (8910). Another important finding of our study was that larger angio-volume was correlated with larger tumor size and higher Ki-67 index. This result was consistent with the conclusion of a previous study that pathologic tumor size was associated with positivity of Ki-67 index (25). Accordingly, angio-volume which may reflect tumor size can be used as a measurement tool of Ki-67 index. However, it is also worth noting that angio-volume was not significantly associated with higher histologic grade, in spite of fair, positive correlation with histologic grade in correlation test. It might be explained by the peak enhancement, rather than angio-volume, having stronger influence on the histologic grade in regression analysis.
It has been generally known that malignant breast lesions show washout kinetics. However, in this study, there was no association between delayed-washout component and clinical-pathologic prognostic factors. Instead, delayed-plateau component showed correlations with ER status and Ki-67 index. Our result corroborates the previous study result that plateau voxel volume was a predictor of ER status (12). In addition to ER status, higher delayed-plateau component was also associated with higher Ki-67 index. This result was different from the previous study which highlighted that washout curve may predict a higher level of Ki-67 index (2326). Previous studies used the representative qualitative kinetic curve shape rather than the absolute value from small ROI at maximally enhancing tumor (2326). However, it might have disregarded delayed-plateau component because most of breast tumors had both of delayed-washout or delayed-plateau component. In our study, 79 of 85 (92.9%) tumors had delayed-washout component and their representative kinetic curve shape was washout, regardless of percentages of delayed-plateau component. Therefore, we used quantitative voxel percentages of kinetic curve in a whole tumor, instead of a representative qualitative kinetic curve shape and our result can be used in the future analysis with reliability and reproducibility.
Ki-67 is a nuclear protein associated with cellular proliferation, which has attracted considerable interests as a prognostic marker. Among the 21 prospectively selected genes, Ki-67 is included in the Oncotype DX™ assay (2728). In our study, most of kinetic features such as peak enhancement, angio-volume, and delayed-plateau component showed positive correlations with Ki-67 index. This might be explicated by the co-expression of proliferation marker of Ki-67 with endothelial marker of nestin was contributed to microvessel proliferation, a novel angiogenesis marker (29). Since tumor enhancement of DCE-MRI is based on angiogenesis (12), Ki-67 which seems to contribute to angiogenesis, may have an essential role in kinetic features of DCE-MRI.
Our study had limitations. First, kinetic features of DCE-MRI can vary depending on the different MR scanners, imaging protocols, and CAD software between different institutions (303132). Compared to a previous study (12) that used 1.5T MRI with DynaCAD software, we used 3T MRI with CADstream software. Hence, despite the fact that our study result was based on the CAD-assessed semi-automatic evaluation to exclude inter-observer variability, our results can be different from those of previously reviewed literatures. Second, we did not follow patients. Survival analyses with follow-up data are required to validate our results. Thirdly, our study's small sample size might have some risk of over parameterization. Fourthly, menstrual cycle was not considered when DCE-MRI was acquired. Background parenchymal enhancement according to menstrual cycle might have affected CAD-assessed semi-automatic evaluation. Lastly, this was a retrospective study performed at a single tertiary academic institution with possibility of selection bias. Accordingly, prospective multicenter studies with larger sample sizes and follow-up data are warranted to validate prognostic value of kinetic features of breast MRI.
In conclusion, among the CAD-assessed preoperative breast MRI kinetic features, higher peak enhancement may correlate with higher histologic grade; larger angio-volume may correlate with larger tumor size; higher plateau component may correlate with negative ER status; and both higher plateau component and angio-volume may correlate with higher Ki-67 index. Further understanding about correlations between kinetic features and clinical-pathologic prognostic factors may help the use of imaging biomarkers acquired from preoperative breast DCE-MRI in the development of prognosis prediction model, thus enabling personalized treatment in breast cancer patients.
Go to :
 XML Download