

 PDF
PDF ePub
ePub Citation
 Print
Print


INTRODUCTION
Since the first reported success in 1983, lung transplantation has been the only available curative treatment option for patients with various end-stage lung diseases (1). More than 50000 lung transplants have been performed worldwide and have been shown to improve life expectancy, level of daily activity, and overall quality of life in advanced chronic lung disease patients (2). In Korea, the first human lung transplantation was performed in 1996, and since then, a gradual increase in the number of cases has been observed (3). Although survival after lung transplantation has gradually increased, the procedure, like any other organ transplant surgery, is an invasive modality with relatively high rates of mortality and a reported 5-year survival rate of 54% (4). Furthermore, there is relative scarcity of lung donors in relation to the constantly increasing number of patients in need of lung transplantation. Particularly, mortality of patients on the waiting list for lung transplantation is reported to be higher in Korea than in western countries (5). Therefore, the identification of potential risk factors and the meticulous selection of transplant candidates are crucial to maximize the benefits and reduce avoidable postoperative morbidity.
Abnormal body composition is an important modifiable risk factor in lung transplantation, with body mass index (BMI) being the most commonly used parameter to characterize body composition in organ transplant candidates (6). However, BMI can neither isolate nor quantify lean muscle and fat mass, and the true significance of BMI on the outcome of lung transplant remains controversial (78). Sarcopenia, defined as a loss of skeletal muscle mass and impaired muscle function, is widely known to have negative impact on the treatment outcomes of various diseases, and sarcopenic patients have been reported to have poor survival rates in liver and kidney transplantations (910). The majority of lung transplant recipients have also been found to be sarcopenic, and decreased lean muscle mass has been reported to have an association with increased post-transplant morbidity (111213141516). Aside from muscle, the abundance or lack of fat tissue is known to have a negative association with various illnesses, including pulmonary diseases; however, its impact on outcome of lung transplantation remains to be clarified (1718). Therefore, more precise quantification of the different body components, including muscle and fat, may play a role in optimizing treatment outcomes in lung transplant patients.
Among the various modalities, bioelectrical impedance has been the most commonly used tool to assess different body compositions in lung transplant patients because of its robustness and high clinical accessibility (19). However, computed tomography (CT) is currently considered the modality of choice for the evaluation of muscle mass and other body components, as it provides direct visual assessment and improves the reproducibility of measurements (20). The cross-sectional area (CSA) of the muscle at the 3rd lumbar vertebra (L3) level has been found to correlate with total body muscle mass; therefore, it has been used as the reference standard for evaluating sarcopenia in many studies (2122). However, the L3 level is not routinely visualized in chest CT, which is the standard imaging modality used in preoperative evaluation of lung transplant candidates, and additional abdominal CT scans would result in unnecessary cost and radiation exposure. To overcome such limitations, different methods have been introduced to estimate total body compositions from CT images of the chest; however, the designs and results vary broadly across the published studies (1315232425).
The purpose of the present study was to investigate the prognostic significance of muscle and subcutaneous fat mass measured at the 12th thoracic vertebra (T12) level on chest CT with regard to lung transplantation survival and other post-transplant outcomes.
Go to : 
MATERIALS AND METHODS
Patients
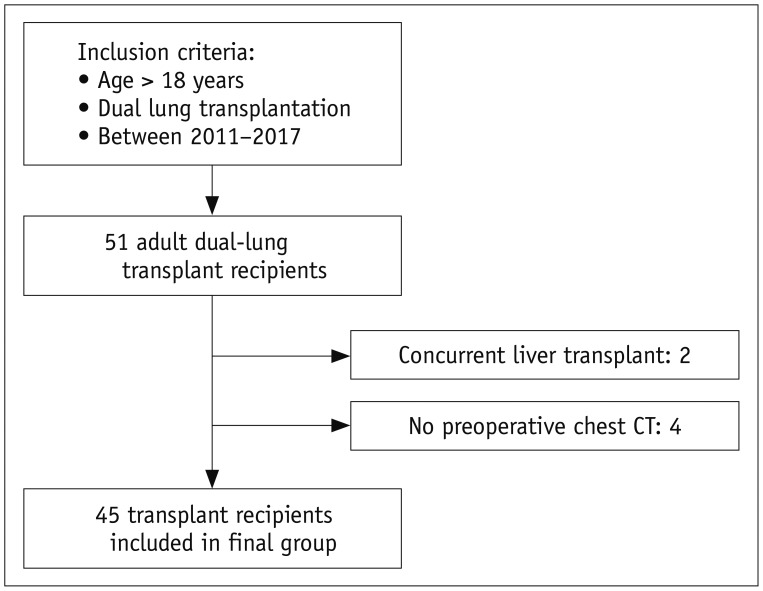
The Institutional Review Board approved this retrospective study, and the need for informed consent was waived. By retrospective review of medical records, 51 adult (age > 18 years) patients who underwent dual lung transplantation at our institution between January 2011 and February 2017 were initially selected for the analysis. Of these 51 patients, concurrent liver transplantation was performed in two patients, and they were excluded from the study. Four additional patients were also excluded because a chest CT scan obtained within 3 months prior to the lung transplantation was not available. Therefore, the final study population consisted of 45 patients (31 male and 14 female patients; mean age, 47.9 ± 12.1 years; age range, 20–74 years) (Fig. 1). By institutional policy, all recipients underwent respiratory rehabilitation after the completion of lung transplantation.
Individual preoperative demographic data including age, sex, weight, and height were collected for each patient. After the lung transplantation, information regarding survival, duration of ventilator support, duration of stay in the intensive care unit (ICU), and duration of hospital stay (HOD) were documented as the primary/secondary outcomes of the current study. All included lung transplant recipients were routinely followed up for survival analyses.
CT Image Evaluation
All chest CT examinations were performed in a caudocranial direction with patients in the supine position, using one of the three available multidetector CT scanners in our institution (Somatom Sensation, Somatom definition, Somatom definition AS; Siemens Healthineers, Forchheim, Germany). Tube voltage was set at 120 kV with beam collimation at 0.6–0.75 mm and a pitch of 1. Chest CT images were reconstructed at various slice thicknesses and intervals; however, for the body composition analysis, images reconstructed at 5-mm slice thickness and intervals using a B50 kernel algorithm were selected.
A board-certified radiologist with 8 years of experience performed the quantitative evaluations. The reader was blinded to the demographic records, medical histories, and postoperative outcomes of the patient. Cross-sectional total muscle area (TMA) and subcutaneous fat area (SFA) were measured on a single-slice axial CT image at the level of the T12, which was visualized in all routine preoperative chest CT examinations. After manual selection of the appropriate slice-level, the visceral organs and central spinal canal were semi-automatically removed from the region of interest using dedicated in-house software. TMA and SFA were then automatically computed using predefined CT Hounsfield unit (HU) thresholds: muscle, −29 to 150 HU; subcutaneous fat, −190 to −30 HU (Fig. 2). In addition to raw measurements, normalized indexed values for TMA and SFA adjusted for either height (muscle-height index [MHI] and fat-height index [FHI] in cm2/m2) or weight (muscle-weight index [MWI] and fat-weight index [FWI] in cm2/kg) were calculated (26).
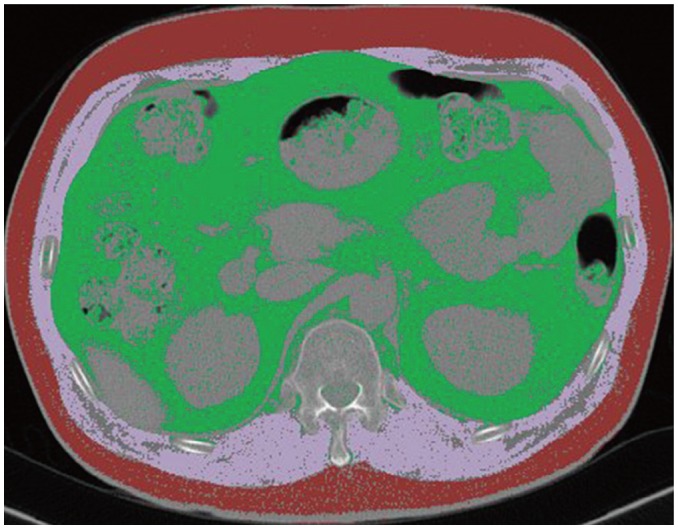 | Fig. 2Example of cross-sectional area measurement at level of 12th thoracic vertebra.Cross-sectional total muscle area (pink) and subcutaneous fat area (red) were automatically calculated using predefined CT HU thresholds (muscle, −29 to 150 HU; subcutaneous fat, −190 to −30 HU). HU = Hounsfield unit
|
Statistical Analyses
Continuous variables were expressed as mean and standard deviation. Independent t tests and chi-square tests were performed to assess differences in patient characteristics between groups. The survival study was performed using a Kaplan-Meier estimate and Cox-regression analysis. Correlation analyses between the measured body composition parameters and various post-transplant outcomes were evaluated with Pearson's correlation coefficient. All statistical analyses were performed with SPSS version 21.0 (IBM Corp., Armonk, NY, USA), and p values < 0.05 were considered significant.
Go to :
RESULTS
Characteristics of the Study Population
A total of 45 lung transplant recipients were included in the study, and their baseline characteristics are summarized in Table 1. The mean BMI value of the total study population was 22.3 ± 3.9 kg/m2. Vast majority of the recipients were within normal or underweight range, and only one patient demonstrated BMI value greater than 30 kg/m2. Among the included patients, idiopathic pulmonary fibrosis (IPF) in 26 (57%), interstitial lung disease other than IPF in 10, bronchiolitis obliterans in 5, and other causes of respiratory failures in 4 patients were identified as the preoperative diagnoses.
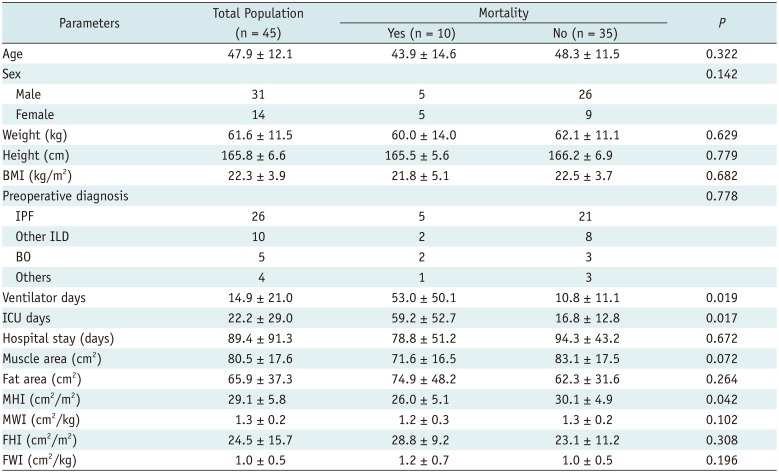
Table 1
General Characteristics and Measured Parameters of Patients
BMI = body mass index, BO = bronchiolitis obliterans, FHI = fat-height index, FWI = fat-weight index, ICU days = duration of stay in intensive care unit in days, ILD = interstitial lung disease, IPF = idiopathic pulmonary fibrosis, MHI = muscle-height index, MWI = muscle-weight index, Ventilator days = duration of ventilator support in days
![]()
Post-Transplant Survival
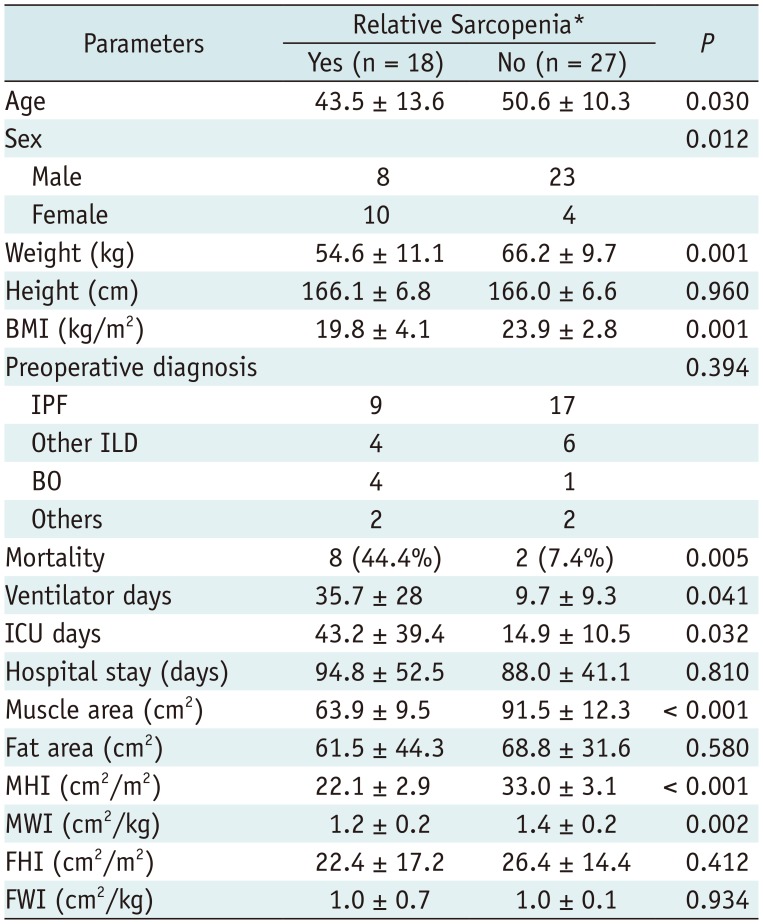
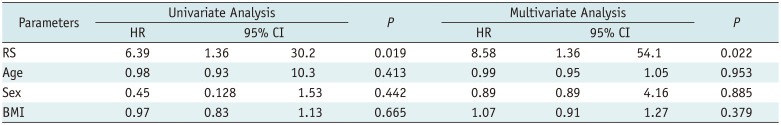
Median follow-up period for all recipients was 32 months (range, 7–76 months), and overall mortality was 22.2%. Infections, such as pneumonia, was the most common cause of mortality (6 of 10 cases), followed by three cases of mortality due to shock and multiple organ failure. In one patient, the cause of death was not clearly identified. There were no significant differences in age, sex, weight, BMI, and preoperative diagnosis between the survivors and the non-survivors (Table 1). Among the measured quantitative parameters, only MHI was significantly different between the survivors and the non-survivors (mean MHI; 26.0 and 30.1, respectively, p = 0.042). For subgroup analysis, 18 (40%) patients with MHI values less than a cut-off value of 28.07 cm2/m2, set to yield the greatest difference in survival, were classified as patients with relative sarcopenia (RS) (27). Patients with RS were younger, were more likely to be female, weighed less, and had lower value of BMI, but no difference was noted in preoperative diagnoses (Table 2). Of the 10 total mortalities, eight occurred in the RS group and only two occurred in the non-RS group. On Kaplan-Meier survival analysis, patients in the RS group had significantly worse overall survival (log-rank test, p = 0.007) (Fig. 3). The relative hazard ratio (HR) estimated using univariate Cox-regression analysis was 6.39:1 (p = 0.019) for the RS group (Table 3). Presence of RS was observed to be a significant predictor of increased post-transplant mortality (HR, 8.58:1, p = 0.022) despite adjustments for age, sex, and BMI. None of the other parameters, including sex, age, BMI, TMA, SFA, and other normalized indices were found to have a significant influence on post-lung transplant survival.
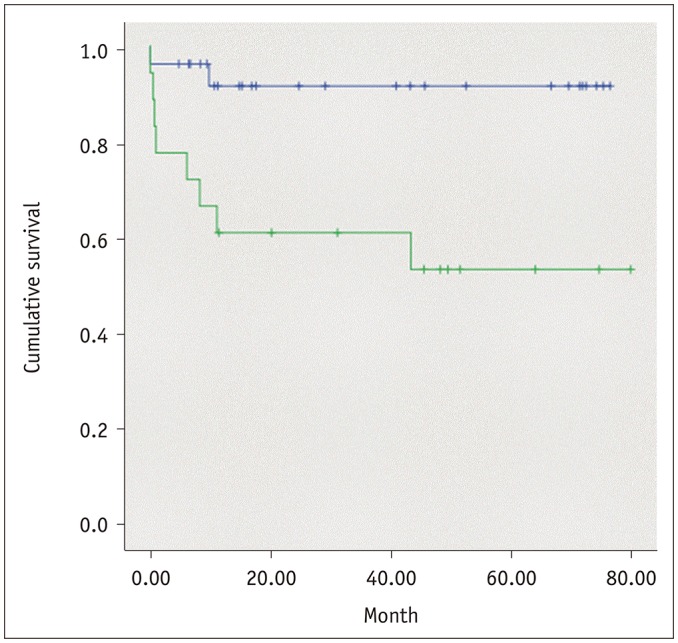 | Fig. 3Post-transplantation survival analysis.Patients with relative sarcopenia were associated with worse overall survival (green line) (log-rank test, p = 0.007). Relative hazard ratio estimated using Cox-regression analysis was 6.39:1 (p = 0.019) for univariate and 8.58:1 (p = 0.022) for multivariate analysis, adjusted for recipient's age, sex, and body mass index.
|
Table 2
Characteristics of Patients with RS
![]()
Table 3
Results of Cox Regression Analysis
![]()
Associations with Other Post-Transplant Outcomes
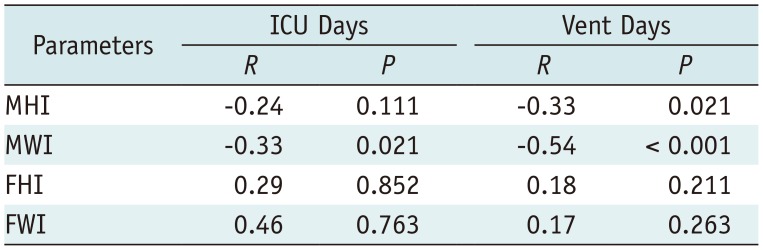
Results from the correlation study revealed that MWI had a significant negative correlation with the duration of ventilator support (R = −0.54, p < 0.001) and ICU stay (R = −0.33, p = 0.021) (Table 4). For the MHI, a significant but weaker negative correlation was noted only with the duration of ventilator support (R = −0.33, p = 0.021). No significant associations were observed between the parameters of fat measurement, FHI and FWI, and postoperative morbidities.
Go to :
DISCUSSION
The current study is one of the earliest to report that a quantitative measure of muscle area on CT is associated with lung transplant survival. Although limited by a small number of study subjects, patients who were relatively sarcopenic were shown to have poorer survival rates after lung transplantation, with the Cox proportional HR being 8.58:1 even after adjustments were made for age, sex, and BMI of the recipient.
Sarcopenia has been established as an important risk factor for mortality in various medical and surgical conditions (2228). In this context, several individual studies have reported that muscle parameters analyzed using CT images had significant associations with postoperative mortality and morbidity in liver transplantation surgeries (293031). Kelm et al. (32) reported worse survival after lung transplantation in patients with decreased muscle index; however, abdominal CT image at the 2nd and 3rd lumbar interface was used for the measurement. Another study measured core muscle CSA on abdominal CT images and used it as an indicator of sarcopenia; however, no significant influence was observed on post-lung transplant mortalities (33). Two prior studies utilized chest CT to measure the TMA of the thoracic muscle at the level of the carina in lung transplantation recipients, but no significant association between sarcopenia and decreased survival was noted (1315). In the present study, MHI was measured at the T12 level on chest CT images and was found to be a significant prognostic factor for survival in lung transplantation recipients in Korea. The discrepancy in results may be due to the use of different methods for measuring muscle characteristics and the dissimilarity in demographic features, legal policies, and patient selection protocols in Korean lung transplantation recipients. For example, Korean recipients are more likely to have IPF as the underlying pulmonary disease, be less obese, and have poorer preoperative medical condition compared with North American patients (34).
Currently, the most commonly used standard level for CT-based estimation of body composition is the L3 because TMA and fat tissue volume measured at this level demonstrated good correlation with total body skeletal muscle and fat tissue volumes (3536). However, the L3 level is not routinely visualized in the scan range of the chest CT, which is the gold standard imaging method for preoperative evaluation of lung transplant candidates. As an additional abdominal CT examination may result in unnecessary radiation exposure and increased cost, it would be in the best interest of the patient to assess body composition on chest CT images. In one study, this issue was addressed by using chest CT to measure the CSA of muscle at the 1st lumbar vertebra (L1) level in Korean lung cancer patients, and a high correlation was observed with values measured at the L3 level (23). Unfortunately, due to variations in the inspiration status of patients and institutional CT protocols, the L1 level may not be completely included within the chest CT scan range, which was true for 11 of the 45 patients included in the present study (37). In another study, authors reported that TMA at both the 7th thoracic vertebra (T7) and T12 levels correlated with results at the L3 level; however, a significantly stronger association was observed at the T12 level (24). Based on this finding and the fact that the T12 level was always scanned in each chest CT, evaluations of muscle and subcutaneous fat were performed using axial CT images at the T12 level in the present study.
Nemec et al. (24) suggested a cut-off value for sarcopenia measured on axial CT images at the T12 level; however, direct application of this value to the subjects included in the present study would have been inappropriate due to differences in ethnicity, underlying illness, and other diverse patient demographic features. More importantly, there is currently no consensus on standard measurement methods or reference values for defining sarcopenia on CT (24). Therefore, patients in the present study were divided into two subgroups using a cut-off MHI value of 28.07 cm2/m2. Such a cut-off value was selected to yield the greatest survival difference between the two groups, while minimizing bias and maintaining a sufficient number of patients within each subgroup for statistical assessment. Establishing a generalized sex-specific threshold for sarcopenia would have been inappropriate, owing to the small number of patients included in the present study. Further studies with larger number of patients are required to determine the possible cut-off value for the diagnosis of sarcopenia in Korean population.
Both height- and weight-adjusted TMA were found to be associated with decreased duration of postoperative ventilator support (R = −0.33, R = −0.54, respectively); however, only MWI was also associated with reduced duration of stay in the ICU (R = −0.33). No significant correlation was noted with HOD. SFA and its adjusted indices were not associated with duration of either ventilator or ICU care. Association of abdominal CT-based muscle parameters with duration of ventilator care and ICU stay has been reported in both lung and liver transplantation recipients (3033). However, no significant association has been reported with a chest CT-based muscle index prior to the present study. Positive results from the current study and prior reports suggest that quantitative parameters of muscles measured on CT images are predictors of postoperative recovery, such as ventilation support and overall period of stay in the ICU, after lung transplantation.
Between the two normalized muscle indices, MWI exhibited a higher correlation with short-term post-transplant recovery. Although the height of the patient in meters squared has most commonly been used to normalize measured muscle or fat areas in CT-based studies, there is currently no gold standard formula for calculating the normalized index values. Height- and weight-adjusted body composition indices have been used in various studies, with both being reported to have significant associations with diverse individual clinical parameters (2038). One study conducted on a large number of Korean patients reported that the weight-adjusted parameter of the muscle mass of a patient was a more powerful risk factor for development of metabolic syndrome than the height-adjusted parameter (39). Therefore, determination of the optimal quantitative parameter to predict postoperative morbidity requires further evaluation.
Although BMI is the most widely used parameter to determine body composition in organ transplantation candidates, BMI was not found to be associated with survival or any other evaluated postoperative outcome measures in the current analysis (8). Furthermore, association with survival or duration of postoperative care was not observed with quantitative measurements of subcutaneous fat. Therefore, there may be benefit in separately quantifying body components, especially muscles, instead of using BMI as a prognostic index for selection of candidates and anticipation of postoperative outcome.
Several limitations must be acknowledged in the present study. The first limitation is the small number of patients included, which markedly restricted the ability to perform more flexible subgrouping and reduced the power of the statistical analyses. However, due to the restricted exclusion criteria, all but 6 of the 51 adult lung transplants performed in our institution during the six-year period were included in the current study, and the influence of selection bias would have been weakened. Second, this was a retrospective single-center study. Quantitative muscle and subcutaneous fat measurements were performed during the preoperative period, and longitudinal changes in body composition could not be evaluated. Therefore, alterations in body composition during the ICU care and long-term post-transplant recovery could not be assessed. For the purpose of survival analysis, the study population was divided into two groups based on the value of MHI, and sex-specific cut-off values for sarcopenia or adipopenia were not evaluated in the present study. One previous study proposed possible cut-off values for sarcopenia measured at the T12 level on chest CT; however, the study was based on a non-Asian population with cardiovascular disease and the authors used reference values obtained from elderly oncological patients (24). Therefore, direct application of such cut-off values to the current study population, which exclusively comprised Asian patients with end-stage lung disease, would have been unsuitable. Although the cut-off value adopted in the present study cannot be applied to the general population, the value was sufficient to assess the influence of being relatively sarcopenic on survival after lung transplantation, in a small number of patients. Future studies with a larger sample size are warranted. An additional limitation of the present study is the fact that only subcutaneous fat, and not visceral fat, was analyzed. Finally, transplant candidates did not undergo examinations for muscular function, and its relative importance with regard to lung transplantation outcomes, in comparison with muscle mass, was not evaluated.
In conclusion, patients with a relatively smaller value of height-adjusted muscle area (cut-off value, 28.07 cm2/m2) quantitatively measured using chest CT were associated with inferior survival after lung transplantation in both univariate and multivariate analyses. Additionally, post-lung transplant duration of ventilator support and duration of ICU stay were relatively shortened in patients with greater value of chest CT-measured muscle parameters. Further research is necessary to establish a sex-specific threshold for sarcopenia, to evaluate longitudinal changes in body composition, and validate their prognostic significance in larger, more diverse study populations.
Go to :
 XML Download