

 PDF
PDF ePub
ePub Citation
 Print
Print


INTRODUCTION
In the 2015 World Health Organization classification as well as the 2011 classification system of International Association for the Study of Lung Cancer/American Thoracic Society/European Respiratory Society for lung adenocarcinomas (ADCs), invasive mucinous adenocarcinomas (IMAs) were classified as variants of lung ADCs (123). In spite of the relatively low incidence of IMAs (accounting for only 2–5% of all lung ADCs), several previous studies have proved the unique characteristics of IMAs that show significant differences from invasive non-mucinous ADCs in terms of clinical, pathologic, genomic, and prognostic aspects (45678910). Histologically, IMAs are characterized by tumor cells having goblet or columnar cells with abundant intracytoplasmic mucin (4). Regarding genetic profile, IMAs show a stronger correlation with Kirsten ras (KRAS) mutation as compared to invasive non-mucinous ADCs (4567). As for prognosis, there have been controversies about the survival outcome of IMAs. However, various prior studies demonstrated that patients with IMA showed comparable survival outcome to those with invasive non-mucinous ADCs, and IMAs are classified as an intermediate-grade tumor group among all invasive ADCs (48910).
Although IMA is a distinct variant of lung ADCs, there is still limited information about the pre-surgical non-invasive diagnosis of IMA. Traditionally, mucinous bronchioloalveolar carcinoma (BAC) has been known to be associated with a multifocal disease or with a pneumonia-like pattern on computed tomography (CT) (11). However, previous studies conducted by Lee et al. (8) and Watanabe et al. (12) demonstrated that solitary pulmonary nodule (SPN)-type IMA is much more common than pneumonia-type IMA. CT images offer little information to distinguish between nodular mucinous and non-mucinous ADCs. Meanwhile, there have been several studies indicating that mucinous BACs demonstrate relatively scant fluorine-18 (18F)-flurodeoxyglucose (FDG) uptake on positron emission tomography (PET)/CT (13). We assumed that PET/CT could provide complementary metabolic information to discriminate IMA from other lung ADCs, adding to the morphologic information of CT.
We hypothesized that CT, PET/CT, and their combined features, such as morphologic-metabolic (M-M) dissociation, could provide specific finding(s) for the diagnosis of IMA. Thus, the aim of this study was to evaluate the diagnostic performance of the M-M dissociation sign, assessed on CT and PET/CT, for discriminating invasive mucinous and non-mucinous ADCs of the lungs.
MATERIALS AND METHODS
The Institutional Review Board approved this retrospective study (approval 2016-12-141) and the patient consent for using clinical data was waived.
Study Population
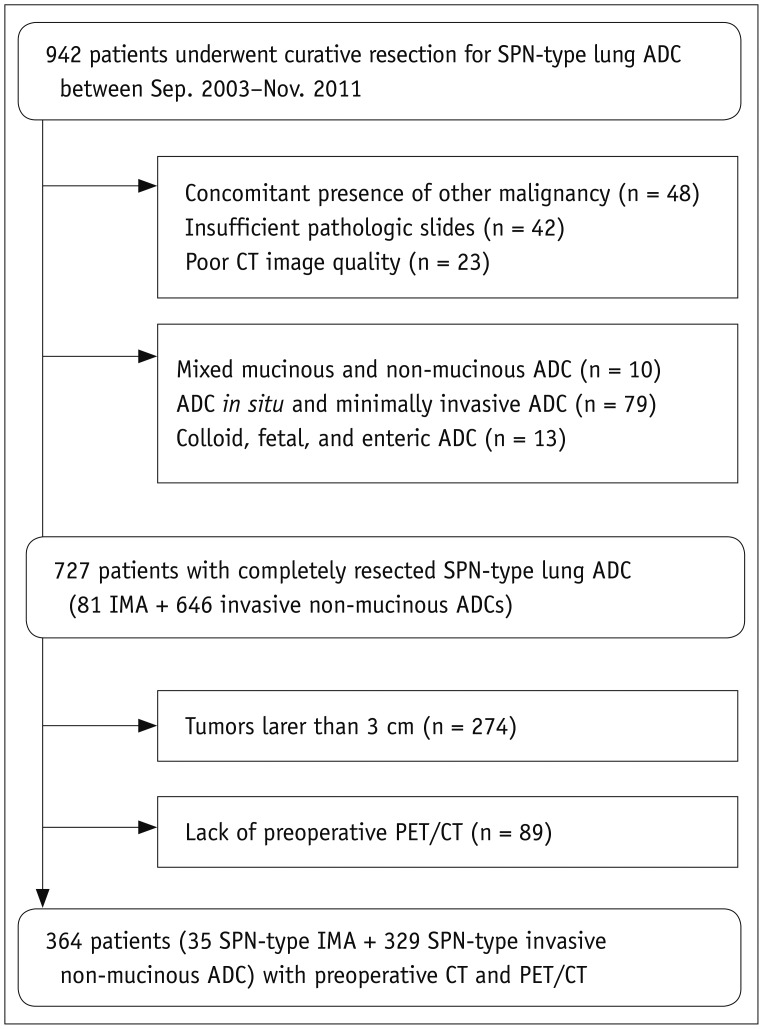
Between September 2003 and November 2011, 942 surgically resected solitary lung ADCs with pathologically confirmed negative resection margin and without evidence of residual disease on follow-up CT were identified at our institution. After exclusion of patients who had history of other malignancy and insufficient pathologic slides, all of the glass slides of resected tumors were evaluated by experienced pathologists (2). Eighty-one patients with solitary IMAs and 646 patients with solitary invasive non-mucinous ADCs were identified. Among them, 274 tumors > 3 cm in diameter were excluded. Eighty-nine patients were also excluded due to lack of pre-operative PET/CT. Finally, 35 patients with SPN-type IMAs (< 3 cm in diameter) and 329 patients with SPN-type invasive non-mucinous ADCs, who had undergone both CT and PET/CT preoperatively, were the target of this study (Fig. 1).
We screened the following clinical data including sex, age at the time of diagnosis, and treatment method from the patient medical records. Tumor, node, and metastasis (TNM) stage was determined (14). For those who underwent wedge resection, nodal staging was determined based on the preoperative CT and PET/CT.
Preoperative Image Acquisition and Interpretation
Detailed parameters of chest CT and PET/CT acquisition are described in the Supplementary Materials (in the online-only Data Supplement). The average time interval between chest CT and PET/CT was 9.6 days (range: 0–47 days).
Two chest radiologists (with 7 and 31 years of experience in chest imaging interpretation, respectively), unaware of the clinical and PET/CT findings and histologic diagnoses, independently assessed the CT scans retrospectively. All CT scans were evaluated in terms of margin and tumor shadow disappearance rate (TDR) on non-contrast enhanced images. Tumor margin was classified into two categories: 1) smooth margin and 2) lobulated or spiculated margin. A nodule with lobulated or spiculated margin can show distortion of adjacent pulmonary parenchyma and vessels, often described as having a sunburst appearance (15). Disagreements regarding tumor margin between the two observers were solved by consensus. For acquisition of TDR, the observers measured the maximum dimension of the tumors (maxD) and the largest dimension perpendicular (perD) to the maximum axis using both the lung (width, 1500 HU; level, −700 HU) and mediastinal (width, 400 HU; level, 20 HU) window settings on axial scans. TDR was defined as follows (1617).

Discrepancies of TDR between the two observers were resolved by averaging their measurements.
For 18F-FDG PET/CT evaluation, a nuclear medicine physician (with 15 years of experience in PET/CT interpretation) unaware of the clinical and pathologic results evaluated the PET/CT images. Regions of interest (ROIs) were placed over the most intense area of FDG uptake in the primary tumor. FDG uptake within the ROIs was analyzed to determine the maximum standardized uptake value (SUVmax).
Morphologic malignancy was established when the TDR was < 0.5 for a nodule showing either lobulated or spiculated margin on CT. The determination of TDR cut-off value was based on the previous studies, in which lung ADCs, particularly those ≤ 2 cm in diameter, with > 50% ground-glass opacity (GGO) component showed good survival outcome with few nodal metastases (1819). We adopted TDR as an imaging parameter to reflect the extent of GGO within the tumor. Metabolic malignancy was defined at SUVmax ≥ 3.5 on PET/CT. The M-M dissociation sign was determined when a malignant-morphologic nodule on CT showed SUVmax < 3.5 on PET/CT. The threshold value of 3.5 was chosen according to the receiver operating curve (ROC) analysis results for discriminating benign from malignant nodules at our institution (20).
Statistical Analysis
Student's t test, the chi-square test, and Fisher's exact test were used for comparison of baseline characteristics between nodular IMA and invasive non-mucinous ADC. The Kruskal-Wallis test was used to compare imaging parameters according to the subtypes of invasive non-mucinous ADCs. When statistically significant differences occurred, post-test comparisons were performed by using the Mann-Whitney U test with Bonferroni correction. The chi-square test was applied for the comparison of the proportion of each subtype between tumors with positive and negative M-M dissociation sign. Multivariate logistic regression analyses were undertaken using stepwise forward selection to assess the clinical and imaging predictors for the presence of IMA. The variables with p < 0.10 on univariate analysis were used as the input variables for the multivariate analysis. Kappa analysis was used for inter-rater reliability. The sensitivity, specificity, positive predictive value (PPV), and negative predictive value (NPV) in making the diagnosis of IMA were calculated. We constructed ROC curves to evaluate the diagnostic performance. The area under the ROC curve (AUC), a measure of diagnostic power, was calculated and pair wise comparisons were performed. All p values < 0.05 were considered statistically significant. All statistical analyses were performed using MedCalc (version 13.3.1.0, MedCalc Software bvba, Mariakerke, Belgium).
RESULTS
Baseline Characteristics
Detailed patient characteristics of SPN-type IMAs and invasive non-mucinous ADCs are shown in the Table 1. The proportion of IMAs among SPN-type ADCs was 9.5% (35 of 364). Demographic factors such as age, sex, smoking history, and type of surgery did not differ significantly between patients with IMA and invasive non-mucinous ADC with p = 0.100, p = 0.261, p = 0.239, and p = 0.855, respectively. There was no significant difference in T classification between the two groups, whereas N classification differed significantly between the two groups (p = 0.984 and p = 0.025, respectively). None of the patients with SPN-type IMA showed lymph node metastasis.
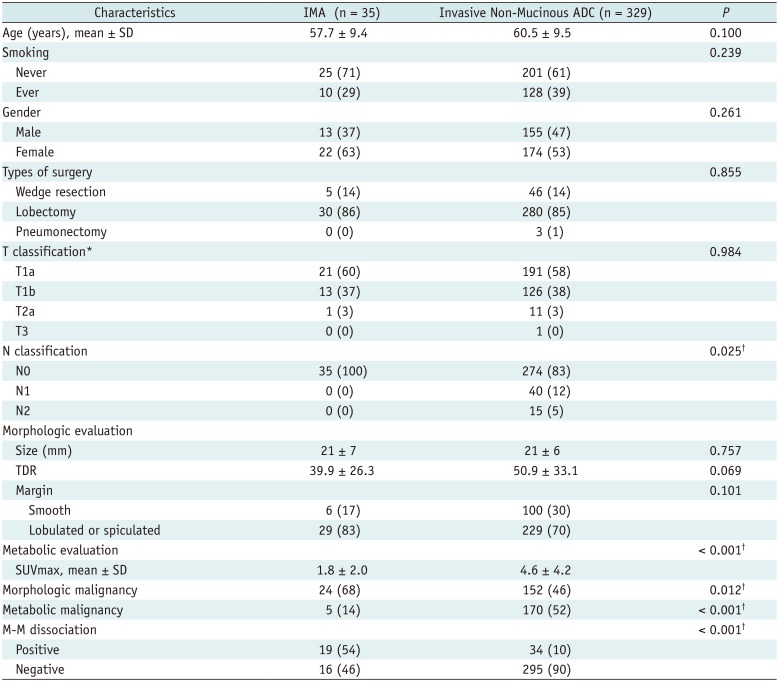
Table 1
Patient Characteristic of Nodular IMA and Invasive Non-Mucinous ADC
*All tumors were less than 3 cm in diameter. Thirteen tumors of T2a and T3 were staged due to visceral pleural or chest wall invasion, †p value < 0.05. ADC = adenocarcinoma, IMA = invasive mucinous adenocarcinoma, M-M = morphologic-metabolic, SD = standard deviation, SUVmax = maximum standardized uptake value, TDR = tumor shadow disappearance rate
![]()
Although there was no significant difference in tumor size between the IMAs (21 ± 7 mm) and invasive non-mucinous ADCs (21 ± 6 mm) (p = 0.757), SUVmax was significantly higher in invasive non-mucinous ADCs (4.6 ± 4.2) than in IMAs (1.8 ± 2.0) (p < 0.001) (Figs. 2, 3, 4). The TDR tended to be lower in IMAs (39.9 ± 26.3%) as compared to the invasive non-mucinous ADCs (50.9 ± 33.1%), although the difference was not statistically significant (p = 0.069). Seventy-one percent of nodular IMAs (25 of 35) and 56% of nodular invasive non-mucinous ADCs (185 of 329) showed TDR < 0.5. Additionally, relatively high proportion of both IMAs (83%) and invasive non-mucinous ADCs (70%) showed lobulated or spiculated margin on CT.
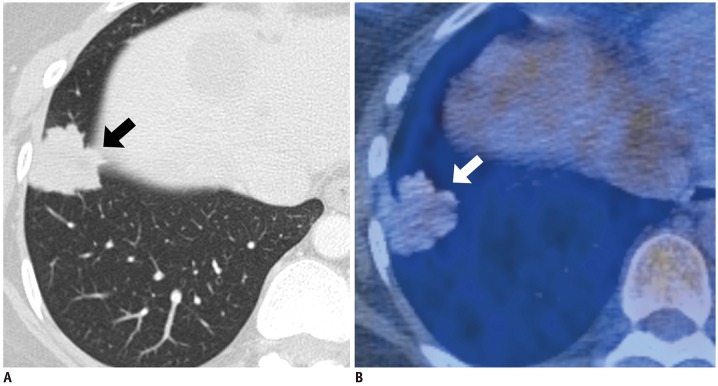
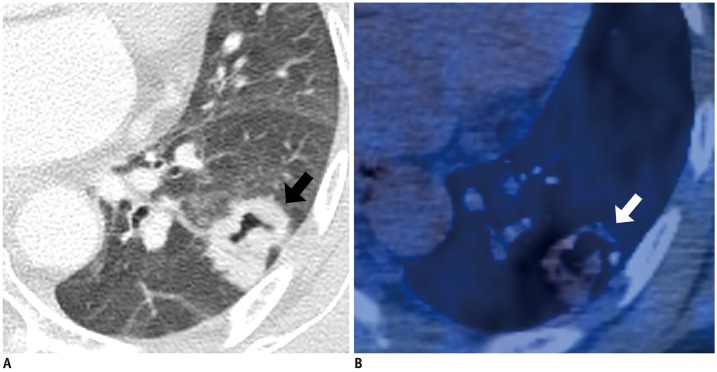
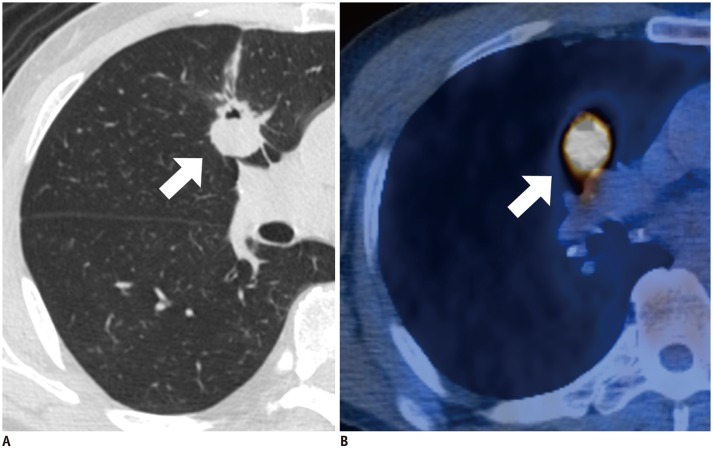
Fig. 2
IMA with positive M-M dissociation sign in 43-year-old woman.
A. Lung window image of transverse CT scan obtained at level of liver dome shows 30-mm-sized nodule with lobulated or spiculated margin (arrow) in right lower lobe (TDR = 1.34%). B. PET/CT image demonstrates scant 18F-FDG uptake (arrow) within tumor and with SUVmax of 2.2. FDG = fluorodeoxyglucose, M-M = morphologic-metabolic, SUVmax = maximum standardized uptake value, TDR = tumor shadow disappearance rate, 18F = fluorine-18
![]()
Fig. 3
IMA with positive M-M dissociation sign in 52-year-old woman.
A. Lung window image of transverse CT scan obtained at level of left atrium shows 27-mm-sized nodule with lobulated or spiculated margin (arrow) in left lower lobe (TDR = 28.99%). Additionally, note internal cavitation or bubble lucency within tumor. B. PET/CT image demonstrates scant 18F-FDG uptake (arrow) within tumor and with SUVmax of 3.0.
![]()
Fig. 4
Invasive non-mucinous adenocarcinoma with negative M-M dissociation sign in 60-year-old man.
A. Lung window image of transverse CT scan obtained at level of right bronchus intermedius shows 24-mm-sized lobulated and spiculated nodule (arrow) in right middle lobe (TDR = 35.31%). Additionally, note internal cavitation or bubble lucency within tumor. B. PET/CT image demonstrates hot 18F-FDG uptake (arrow) within tumor and with SUVmax of 12.9.
![]()
In terms of histologic subtypes of nodular invasive non-mucinous ADCs, 86 patients (26%) had lepidic-predominant ADCs, 172 (53%) had acinar-predominant ADCs, 24 (7%) had papillary-predominant ADCs, 4 (1%) had micropapillary-predominant ADCs, and 43 (13%) had solid-predominant ADCs (Table 2). For lepidic-predominant ADCs, TDR was significantly higher and SUVmax was significantly lower as compared to those of other subtypes of non-mucinous ADCs (p < 0.001 for both).
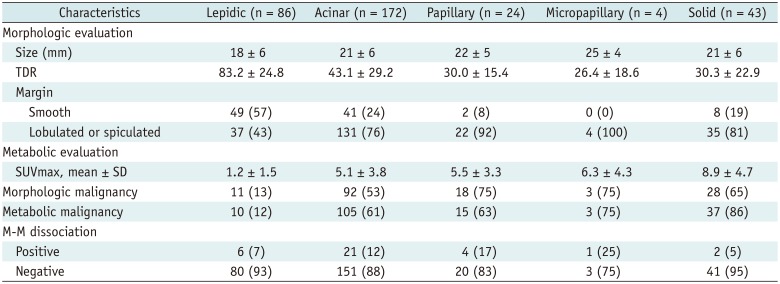
Table 2
Morphologic and Metabolic Evaluation of Nodular Invasive Non-Mucinous ADCs According to Predominant Histologic Subtype
![]()
Diagnostic Performance of Imaging Features
Inter-rater reliability between two readers for the determination of morphologic malignancy was excellent (kappa value = 0.819).
The rate of morphologic malignancy on CT was significantly higher in nodular IMA (68%) than in invasive non-mucinous ADC (46%), whereas the rate of metabolic malignancy on PET/CT was significantly lower in IMA (14%) than in invasive non-mucinous ADC (52%) (p = 0.012 and p < 0.001, respectively). Among 35 IMAs and 329 invasive non-mucinous ADCs, 19 IMAs (54%) and 34 invasive non-mucinous ADCs (10%) showed positive M-M dissociation sign, which differed significantly between the two groups (p < 0.001) (Table 1).
Regarding histologic subtypes of invasive non-mucinous ADCs, 88% of lepidic-predominant ADCs (76 of 86) were metabolically benign on PET/CT with mean SUVmax of 1.2 (standard deviation, 1.5). However, the proportion of positive M-M dissociation sign tumors was only 7% among lepidic-predominant ADCs (6 of 86), mostly due to high TDR (83.2 ± 24.8), representing large area of GGO component within the tumor. In terms of other subtypes such as acinar, papillary, micropapillary, and solid-predominant ADCs, they tended to show both morphologically (58.3%) and metabolically (62.0%) malignant features on CT and PET/CT simultaneously, resulting in relatively low rate of positive M-M dissociation sign (11.6%) (Table 2). In the comparison between tumors having positive (n = 34) and negative (n = 295) M-M dissociation sign among invasive non-mucinous ADCs, there was no significant difference in the proportion of each subtype (p = 0.336).
The diagnostic performance of morphologic malignancy on CT for discriminating IMA presented sensitivity of 68.6% (24 of 35; 95% confidence interval [CI], 50.7–83.2), specificity 53.8% (177 of 329; 95% CI, 48.3–59.3), PPV 13.6% (24 of 176; 95% CI, 10.9–16.9), and NPV 94.2% (177 of 188; 95% CI, 90.7–96.4). In terms of metabolic benignity on PET/CT, the sensitivity was 85.7% (30 of 35; 95% CI, 69.7–95.2), specificity 51.7% (170 of 329; 95% CI, 46.1–57.2), PPV 15.9% (30 of 189; 95% CI, 13.7–18.4), and NPV 97.1% (170 of 175; 95% CI, 93.8–98.7) in discriminating IMA from invasive non-mucinous ADCs. Finally, the diagnostic performance of the M-M dissociation sign was as follows: sensitivity 54.3% (19 of 35; 95% CI, 36.7–71.2), specificity 89.7% (295 of 329; 95% CI, 85.9–92.7), PPV 35.8% (19 of 53; 95% CI, 26.5–46.5), and NPV 94.9% (295 of 311; 95% CI, 92.8–96.4). In the comparison of diagnostic performance among morphologic malignancy (CT), metabolic benignity (PET/CT), and M-M dissociation sign for discriminating IMA from invasive non-mucinous ADCs, the AUC of M-M dissociation sign (0.720; 95% CI, 0.616–0.823) was significantly greater than that of morphologic malignancy (0.612; 95% CI, 0.516–0.707) and metabolic benignity (0.313; 95% CI, 0.232–0.395).
Table 3 summarizes the result of multivariate analysis for predicting IMA among SPN-type lung ADCs. N stage (p = 0.025), morphologic malignancy on CT (p = 0.012), metabolic benignity at PET (p < 0.001), and M-M dissociation sign (p < 0.001) were regarded as input variables for multivariate analysis. Multivariate analysis confirmed that metabolic benignity on PET/CT (odds ratio [OR] 2.99; 95% CI, 1.01–8.93; p = 0.047) and M-M dissociation sign (OR 6.35; 95% CI, 2.76–14.62; p < 0.001) were significant predictors of nodular IMAs.

DISCUSSION
Many studies have addressed the clinico-pathologic characteristics of IMAs as an evolving disease entity. Particularly, in terms of genetic profile, IMA is correlated with the absence of epidermal growth factor receptor (EGFR) mutations and the presence of KRAS mutations, which indicates that these tumors are unlikely to respond to EGFR-tyrosine kinase inhibitors such as gefitinib and erlotinib (4512212223). Many reports have also shown that IMA is associated with lower rates of pleural involvement, lymphatic permeation, and vascular invasion, in contrast to frequent aerogenous spread (6781124). These previous studies corroborate our results that none of the SPN-type IMAs showed lymph node metastasis. In spite of these unique properties of IMA, little is known about the imaging diagnosis of IMAs.
Several recent studies revealed that SPN-type IMA is far more common than pneumonia-type IMA (812). However, despite the relatively large number of SPN-type IMAs, there have been few reports on their morphologic characteristics on CT in the literature. Instead, various studies have reported interesting results on PET/CT. In a study by Chang et al. (25), mucinous BACs exhibit significantly lower peak SUVs compared to those of squamous cell carcinomas, non-mucinous ADCs, and other malignancies. Furthermore, Lee et al. (13) also reported that nodular IMA depicts scant FDG uptake (SUVmax 2.3 ± 1.9).
In this study, we defined the M-M dissociation sign and evaluated the diagnostic performance of this sign in discriminating SPN-type IMAs from invasive non-mucinous ADCs. The specificity of M-M dissociation sign in discriminating SPN-type IMA from invasive non-mucinous ADCs was 89.7%, which was much better than that of CT (53.8%) or PET/CT (51.7%) alone, therefore presenting a low false positive rate. We also found that identification of the negativity of this sign is an accurate indication to exclude IMA with an NPV of 94.9%. Multivariate analyses demonstrated that M-M dissociation sign and benignity on PET/CT are two significant discriminators of IMA among nodular ADCs with ORs of 6.35 and 2.99, respectively. Substantially, the NPV of CT alone (94.2%) was also comparably high and the NPV of PET/CT (97.1%) was even higher than that of M-M dissociation sign. However, the PPV of CT (13.6%) and PET/CT (15.9%) alone was far lower than that of M-M dissociation sign (35.8%), limiting the general application of CT or PET/CT alone for the diagnosis of IMA. The relatively low rate of overall sensitivity and PPV in our analysis could be partly explained by the disproportionate numbers of IMAs and invasive non-mucinous ADCs (35 versus 329). Although the number of invasive non-mucinous ADCs was markedly larger than that of IMAs, our cases might represent the real incidence of IMA among SPN-type lung ADCs.
A possible source of discrepancy between PET/CT and CT is the mucinous component within IMAs. IMAs are peculiarly prone to show lower TDR as compared to non-mucinous tumors, because of the pathologic features of tumor cells with abundant mucin. On the other hand, relatively small numbers of metabolically active cancer cells compared to the large amount of mucin can be a reason for scant FDG uptake on PET/CT in IMAs; hence, FDG uptake correlates directly with the number of cancer cells (2526). Indeed, differentiation between IMA and lepidic-predominant non-mucinous ADCs could be mostly achieved with the difference in TDR, as both of the tumor types show little FDG uptake on PET/CT. Additionally, differentiation between IMA and other non-mucinous ADCs, including acinar-, papillary-, micropapillary-, and solid-predominant ADCs, could be done based on the difference of SUVmax value because most of these tumors were morphologically malignant on CT.
In this study, we made use of marginal characteristics and TDR in determining morphologic malignancy on CT. A lobulated contour or an irregular or spiculated margin is a renowned feature suggestive of malignancy (27282930). In terms of TDR, several previous reports indicated that high TDR or a large area of GGO within a nodule is an important factor for good prognosis in lung ADCs (18192731). Although TDR is a known prognostic parameter of lung ADCs, we adopted TDR as a differential point of morphologic malignancy as high TDR is assumed to represent low tumor cellularity or a less aggressive tumor (32).
Our study has several limitations. First, it was limited inherently by its retrospective design, and we might have had a selection bias. Second, this study was performed in a single institution and follow-up periods were variable. Third, we only included nodular IMAs and invasive non-mucinous ADCs that were < 3 cm in diameter. This restriction of tumor size may influence the FDG uptake on PET/CT, lowering the average value of the SUVmax. Lastly, the proportion of solid-predominant ADCs among invasive non-mucinous ADCs was relatively large (13%), which could affect the diagnostic performance of M-M dissociation sign. External validation of this sign with larger study population from multiple centers can be the next step.
In conclusion, we proposed the idea of a new diagnostic condition of IMAs, the M-M dissociation sign, based on morphologic and metabolic images. We suggest that the identification of the absence of M-M dissociation sign is an accurate indication to exclude IMA from SPN-type lung ADCs.
 XML Download