

 PDF
PDF Citation
 Print
Print


INTRODUCTION
A rough surface texture leads to plaque accumulation, which facilitates the development of periodontal disease, gingival inflammation, recurrent caries, surface staining, and discomfort [12345]. In contrast, a perfectly polished surface of resin composite leads to improved mechanical properties [23], such as microhardness, less wear on dental restorations, and better aesthetic quality.
The surface roughness of restorations is directly influenced by the structure of the resin matrix and the characteristics of the fillers. The same procedures yield different polishing results according to the type of resin composite employed, as resin matrix is relatively soft, while filler particles are relatively hard and therefore do not abrade to the same degree. In packable resin composites where the fillers are large (< 1 μm), the surface looks rougher. In microfill resin composites where the fillers are smaller (40–50 nm), the surface appears smooth and glossy. Hybrid resin composites also exhibit a smooth and glossy surface after polishing, but are notoriously more difficult to polish. Microfill, microhybrid, and nanofill or nanohybrid resin composites appear to show greater polishability, with nanocomposite resins representing a real breakthrough in terms of final polish [467]. Nanocomposites are divided into 2 different types: nanofills and nanohybrids. Nanofills are made of nearly uniform nanometric particles, and may create nanoclusters as secondarily formed fillers. Nanohybrids are made of particles of various sizes, from the micrometric to nanometric scale [8].
Finishing and polishing procedures also influence the surface quality, aesthetics, and longevity of resin composites [39]. The finishing step is defined as contouring or reducing the restoration to obtain the ideal anatomy through re-establishing occlusal morphology and a tight tooth-to-restoration margin. The polishing step involves reducing and smoothing the roughness and surface scratches created by finishing instruments [1]. Finishing and polishing are essential steps for restoration survival. Both steps can be performed directly after the final polymerisation of the resin composite, which is the most common scenario in clinical practice, or postponed to a later date. The ‘finishing–polishing’ procedure consists of preparing the surface of the restorative material to obtain a comparable surface to the enamel. The purpose is to minimize the retention of plaque and to prevent the restoration from being perceived as a foreign body. In addition, having a very smooth surface is important since the tongue is able to detect even the tiniest differences in surface roughness, down to around 0.3 µm [471011].
The finishing–polishing step involves a sequence of instruments, working to a progressively lower depth of cut. Clinicians can choose from a large array of instrument systems for the finishing and polishing stages: diamond burs (with grain sizes of 30 and 15 µm) or tungsten carbide burs (12/15- and 30-fluted). Burs with fewer flutes deliver a deeper and more aggressive cut. Polishing burs with more flutes enable very gentle vibration-free polishing [412]. Abrasive polishing techniques use flexible or semi-flexible abrasive instruments (cups, points, and wheels), instruments coated with abrasives (abrasive disks and strips and diamond burs), and abrasive polishing paste compounds. Diamond burs require the additional use of instruments and/or products such as polishers, polishing disks, and polishing pastes. Abrasive polishing relies on using progressively finer abrasive grits before finishing the final polish with exceptionally fine-grained grit to obtain a smooth and glossy surface finish [410]. According to Daud et al. [13], tungsten carbide burs provide a smoother finishing surface than diamond finishing burs. In this study, only tungsten carbide burs were used.
The aim of this in vitro study was to test the effect of 2 finishing–polishing sequences on 5 nanotech-based resin composites by comparing their final surface roughness and hardness values. The resin composite specimens were finished and polished directly after the resins had polymerised. The second objective was to show whether the 2 finishing–polishing sequences performed differently on each of the resin composites that were tested, namely the Filtek Z500, Tetric Evoceram, Tetric Evoceram Bulk Fill, Ceram X Mono, and Ceram X Duo. Two null hypotheses were formulated: H01, there would be no difference between the 2 finishing–polishing sequences, and H02, there would be no differences among the 5 resin composites.
MATERIALS AND METHODS
Materials
This study used 5 A2-shade nanocomposites (Table 1): Tetric Evoceram and Tetric Evoceram Bulk Fill (Ivoclar-Vivadent, Schaan, Liechtenstein), Filtek Z500 (3M ESPE, St. Paul, MN, USA), Ceram X Mono, and Ceram X Duo Email (Dentsply/De Trey, Konstanz, Germany). All finishing and polishing burs used with contra-angles were from Komet Dental (Lemgo, Germany), including blue-and-yellow-ring Q crosscut tungsten carbide burs (H48LQ), white-ring multiblade tungsten carbide burs (H48LUF), and the EVO-Light polisher (9523UF204 030) (Table 2).
Table 1
Manufacture, classification, matrix, filler, filler size, volume%, and weight% of the 5 nanotech-based resin composites used in the study

BisGMA, bisphenol A-glycidyl methacrylate; UDMA, urethane dimethacrylate; BisEMA, 2,2-bis(4-[2-Methacryl-oxyethoxy]phenyl)propane; TEGDMA, triethylene glycol dimethacrylate.
![]()
Table 2
Characteristics of the burs used in the study

![]()
The resin composites were light-cured under a Bluephase 20i curing light (Ivoclar Vivadent, Schaan, Liechtenstein) using high-mode light intensity at 1,100 mW/cm2. A Bluephase radiometer (Ivoclar Vivadent) was used to measure and control the light intensity of the curing light source before each photopolymerisation.
Methods
The specimens of the 5 resin composites were produced in Teflon moulds. First, a 3-mm-thick Teflon disk featuring three 5-mm-diameter cylinders was used to grossly shape the specimens. A non-reflective black-background backer was overlaid with the first glass slide. A transparent Mylar strip matrix was then inserted between the glass strip and Teflon disk. The resin composite was inserted into the mould in 2 incremental steps. Another transparent polyester matrix was then placed on top of the resin composite, then topped with a second glass slide. The glass slide was then pressed flush for 30 seconds to eliminate the excess composite. The polymerization curing light was set in flush contact with the glass slide. Light curing was done according to the manufacturer's recommendations (Ivoclar-Vivadent), using high-intensity-mode light for 20 seconds at 1,100 mW/cm2. The light intensity of the curing light source was measured on a radiometer before each polymerization. Once polymerized, the specimens were dislodged from the mould and inserted into a second 2-mm-thick Teflon mould, making it possible to finish and polish the specimens on a tight-fixed base and thus control the residual thickness. Specimen orientation was flagged by a mark to verify the direction of finishing and polishing on the light-exposed face.
Sixty specimens were finished and polished, all in the same direction parallel to the surface. Two specimens of each resin composite were sampled to form the strip-finished control group. All these specimens were finished and polished immediately after light curing. Three groups were defined to represent the 2 finishing–polishing sequences and the control group. Five specimens of each nanocomposite were randomized into each group.
Each composite was split across 3 system-set groups: 1) MS system (Mylar strip control group, 10 specimens): samples that did not undergo any surface treatment, but were simply light-cured in contact with the transparent Mylar matrix strips and the glass slide. This group included 2 specimens of each resin composite. 2) QB system (25 specimens): a blue-and-yellow-ring Q crosscut 12/15-fluted finishing bur on a red-ring contra-angle (optimal speed 20,000 min−1), then an EVO-Light polisher on a blue-ring contra-angle (optimal speed 6,000 min−1). Five specimens of each resin composite were polished using this finishing–polishing sequence system under water spray cooling. 3) QWB system (25 specimens): a blue-and-yellow-ring Q crosscut 12/15-fluted finishing bur, then a white-ring crosscut 30-fluted polishing bur on a red-ring contra-angle (optimal speed, 20,000 min−1), then an EVO-Light polisher on a blue-ring contra-angle (optimal speed, 6,000 min−1). Five specimens of each resin were polished using this finishing–polishing sequence system under water spray cooling (Table 3).
Table 3
Polishing–finishing sequences tested in the study


![]()
The burs and polishers were used only 5 times. The contra-angle was held steady by a T-shaped device, ensuring that no pressure was exerted on the instrument. After using each finishing bur or polisher, the specimens were rinsed by a water-spray for 10 seconds, then dried by an air-spray for 5 seconds to eliminate the debris created by the instruments. Before analysis, the specimens were placed in an ultrasonic bath at 35°C for 3 minutes, then cleaned in absolute ethanol (90%) with a microbrush.
Hardness is defined as a quantitative measure of resistance to deformation, and is calculated as the maximum applied load divided by the projected contact area. Microhardness is measured with 2 different tests, the Vickers or Knoop tests, which differ by the shape of their indenters. A square base pyramid is used for the Vickers test, and a diamond base for the Knoop test. Vickers hardness is based on the ratio between the applied load and the true area of contact, whereas the Knoop hardness considers the projected area. Therefore, for optimal accuracy, the Vickers test was chosen.
1. Vickers microhardness tests
In this experiment, we measured the Vickers microhardness according to the equation:

where θ is the apical angle of the square-based pyramidal diamond indenter, F is the force applied (in newtons; 1 N = 0.102 kg), d is the average length of the diagonal left by the indenter (in mm) on the surface of the specimen, and g is the standard acceleration due to gravity (9.80665 m/s2). The microhardness of each resin composite was measured for the 2 finishing–polishing sequences and the control group using a Micromet microhardness tester (Micromet, Buehler, Lake Bluff, IL, USA). Five indentations per specimen were made, 1 at the centre and 4 around it. Indentations were made using the microhardness tester under a load of 100 g, applied for 20 seconds. This load was selected because the diagonal indentations should be as large as possible to maximize the measurement resolution. For a 200 gf load, the size of the indentation was too big for the screen, so 100 gf was a good compromise.
2. Surface roughness test
The roughness of the 5 resin composites polished with the 2 finishing–polishing sequences was measured and compared to the values of the strip-finished control-group specimens. A total of 60 specimens were analysed using an optical profilometer (Micromesure 2, STIL, Aix-en-Provence, France). This optical profilometer is based on the chromatic confocal imaging technology recommended by the ISO 25178 standard. Once the analysis is completed, the Gwyddion 2.26 software (STIL) was used to visualize the 3-dimensional surfaces of the different specimens and to calculate their roughness values. This optical profilometer was able to measure the surface roughness Ra (arithmetic mean of the absolute departures of the roughness profile from the mean line). This measure was used to define roughness.
3. Optical microscopy observations
One sample of each group and each resin composite (i.e. 15 samples), was observed under an Olympus BH2 optical microscope to visualise the surface texture after the polishing steps (QB and QWB samples). Samples were observed at ×50 magnification.
4. Scanning electron microscopy observations
The same samples observed using optical microscopy were also observed with a scanning electron microscope (SEM; JSM-5310, JEOL, Tokyo, Japan) in a low vacuum mode (20–30 Pa) without gold metallization, to visualise the surface aspect before (MS samples) and after the polishing steps (QB and QWB samples). Samples were observed at ×100, ×500, and ×2,000 magnifications.
Statistical analysis
The Vickers microhardness and roughness values of the specimen surfaces were collected and analysed with the non-parametric Kruskal-Wallis test. The level of significance was set at α = 0.05. Two null hypotheses were formulated: H01, there would be no difference between the 2 finishing–polishing sequences, and H02, there would be no differences among the 5 resin composites. The Dunn test was used for non-parametric pairwise comparisons with the Bonferroni correction. The significance level was set to α = 0.05.
RESULTS
Effectiveness of the finishing–polishing system sequences on surface hardness and roughness
The 2 finishing–polishing sequences were significantly different in both hardness and roughness (p < 0.05). The H01 hypothesis was rejected. The finishing–polishing sequence that gave the highest hardness values (Figure 1) and lowest roughness values (Figure 2) for all the nanocomposites was the QWB system, which proved to be a more effective finishing–polishing sequence than the QB system. The MS system, which did not have any surface treatment, was significantly different from the other 2 sequences (p < 0.05). The lowest surface hardness and roughness values were obtained with this system (Figures 1 and 2). Regarding surface hardness, the sequence of effectiveness of the systems for each of the resin composites was QWB > QB > MS, and for the surface roughness, it was MS > QWB > QB.
 | Figure 1Box plots of the surface hardness vs. the finishing–polishing sequence for each resin composite.QB, finishing–polishing sequence using a blue-and-yellow-ring Q crosscut 12/15-fluted finishing bur and EVO-Light polisher sequentially; QWB, finishing–polishing sequence using a blue-and-yellow-ring Q crosscut 12/15-fluted finishing bur, a white-ring crosscut 30-fluted polishing bur, and an EVO-Light polisher, sequentially; MS, Mylar strip control group.
|
 | Figure 2Box plots of the surface roughness vs. the finishing–polishing sequence for each resin composite.QB, finishing–polishing sequence using a blue-and-yellow-ring Q crosscut 12/15-fluted finishing bur and EVO-Light polisher sequentially; QWB, finishing–polishing sequence using a blue-and-yellow-ring Q crosscut 12/15-fluted finishing bur, a white-ring crosscut 30-fluted polishing bur, and an EVO-Light polisher, sequentially; MS, Mylar strip control group.
|
Finishability–polishability and surface hardness/roughness tests of the 5 resin composites
The 5 resin composites presented significant differences in surface finish (p < 0.05) in terms of hardness (Figure 1 and Table 4) and roughness (Figure 2 and Table 5). The H02 hypothesis for each of the 2 finishing–polishing systems was rejected.
Table 4
Surface hardness (Vickers microhardness) of resin composites according to the finishing–polishing sequence

Values with the same superscript letters are not significantly different. The lowercase superscript letters refer to the columns. The uppercase superscript letters refer to the rows.
QB, finishing–polishing sequence using a blue-and-yellow-ring Q crosscut 12/15-fluted finishing bur and EVO-Light polisher sequentially; QWB, finishing–polishing sequence using a blue-and-yellow-ring Q crosscut 12/15-fluted finishing bur, a white-ring crosscut 30-fluted polishing bur, and an EVO-Light polisher, sequentially; MS, Mylar strip control group.
![]()
Table 5
Surface roughness (Ra, μm) of resin composites according to the finishing–polishing sequence

Values with the same superscript are not significantly different. The lowercase superscripts refer to the column. The uppercase superscripts refer to the rows.
QB, finishing–polishing sequence using a blue-and-yellow-ring Q crosscut 12/15-fluted finishing bur and EVO-Light polisher sequentially; QWB, finishing–polishing sequence using a blue-and-yellow-ring Q crosscut 12/15-fluted finishing bur, a white-ring crosscut 30-fluted polishing bur, and an EVO-Light polisher, sequentially; MS, Mylar strip control group.
![]()
For the QB system: Filtek Z500 showed statistically significantly higher surface hardness values than the other resins, except for the Ceram X Duo (p < 0.05). There was no statistically significant difference in surface hardness values between the Tetric Evoceram and Ceram X Mono samples or between the Tetric Evoceram Bulk Fill and Ceram X Duo samples (Figure 1 and Table 4). The roughness values were statistically significantly different for the Filtek Z500 and Ceram X Mono samples (p < 0.05) and for the Tetric Evoceram and Ceram X Mono samples (p < 0.05) (Figure 2 and Table 5).
For the QWB system: Surface hardness was not statistically significantly different among the Ceram X Mono, Tetric Evoceram, and Tetric Evoceram Bulk Fill samples, or between the Filtek Z500 and Ceram X Duo samples (Figure 1 and Table 4). In terms of roughness, there were significant differences between the Filtek Z500 and Ceram X Mono samples (p < 0.05), between the Tetric Evoceram and Ceram X Mono samples (p < 0.05), and between the Tetric Evoceram Bulk Fill and Ceram X Mono samples (p < 0.05; Figure 2 and Table 5).
Optical microscopic and scanning electron microscopic observations
The optical microscopic images at ×50 magnification and scanning electron microscopic images at ×100 and ×500 magnifications revealed different aspects of the surfaces for the 5 different resin composites depending on the finishing–polishing sequence used (Figure 3). The QWB finishing–polishing sequence rendered the smoothest surfaces, closest to the surface finish of the MS specimens.
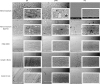 | Figure 3Scanning electron microscopic observations of 5 different resin composites after 2 finishing–polishing sequences (QB and QWB) and polymerization under a Mylar strip (MS) as the control group, at ×100 and ×500 magnifications in the white rectangular insets.QB, finishing–polishing sequence using a blue-and-yellow-ring Q crosscut 12/15-fluted finishing bur and EVO-Light polisher sequentially; QWB, finishing–polishing sequence using a blue-and-yellow-ring Q crosscut 12/15-fluted finishing bur, a white-ring crosscut 30-fluted polishing bur, and an EVO-Light polisher, sequentially; MS, Mylar strip.
|
DISCUSSION
Aydin et al. [14], among others, showed that after curing, the superficial layer of resin composite restorations presented very poor physico-chemical properties. Indeed, this layer is rich in resin organic binder and has to be removed [1516]. As shown in this study, the MS exhibited the lowest surface hardness values. Finishing and polishing enable this superficial layer to be removed [1516], leading to resin composite restorations with higher resistance to wear and surface hardness [17]. The blue-and-yellow-ring crosscut 12/15-fluted finishing bur is more aggressive, producing a rough surface with more filler ripped out. In contrast, the white-ring crosscut 30-fluted polishing bur yielded a surface finish with very low surface roughness, near-to the strip-finish of the control group. We observed that the mean surface roughness (Table 5) was related to the QB sequence (0.13 to 0.17 µm) and to the QWB sequence (0.09 to 0.11 µm), all of which were below the critical 0.2 µm threshold reported by Bollen et al. [2]. Turssi et al. [18] highlighted that using a tungsten carbide bur for the finishing step, before using polishers, resulted in significantly smoother material surfaces. The QWB sequence included the most highly-fluted instruments, and as was observed on the SEM images, more flutes resulted in fewer surface irregularities. Thus, the QWB finishing–polishing sequence produced the best surface finish for all 5 resin composites and the finish closest to the surface profile of the strip-finished control group specimens.
As shown by van Noort and Davis [19] and van Dijken and Ruyter [20], the finishing–polishing procedures applied had effects on the surface characteristics of the resin composite [3192021]. Resin matrix and filler particles present different hardness values. During finishing–polishing procedures, if the fillers are significantly harder than the resin matrix, the matrix will be abraded away first, and the filler particles will be left at the surface, increasing the aggregate surface roughness [102223].
Several studies have observed a correlation between filler size and surface roughness, and that composites incorporating large fillers (10–50 µm) tend to be rougher than composites incorporating smaller fillers (0.04–1 µm) [22232425]. This pattern is consistent with the results found here, as the Filtek Z500, which incorporates the smallest filler particles (from 0.6 to 1.4 µm), presented the smoothest surfaces in both finishing–polishing sequences. Tetric Evoceram and Tetric Evoceram Bulk Fill have smaller fillers than the Ceram X composites and resulted in a smoother surface after the QB and QWB system sequences. Ceram X Mono and Ceram X Duo are composed of large-diameter (from 0.4 µm up to 4.0 µm) glass filler. This is the reason why the surfaces remained rougher even after high-performance finishing–polishing sequences, such as QB and QWB.
SEM images showed that the QB sequence produced the roughest surface finish. SEM micrographs demonstrated that the fillers used in Tetric Evoceram Bulk Fill, Tetric Evoceram, Ceram X Mono, and Ceram X Duo had been ripped away after the sequence, leaving irregularities on the surface of the material. This observation is consistent with the composition of the Tetric materials, which use pre-polymerised fillers in the inorganic phase. These prepolymerised filler particles appear to rip away more easily during finishing and polishing, resulting in lower surface hardness [8]. The Ceram X composites have wider-diameter fillers than the other nanocomposites studied, which could also make them easier to rip out. However, micrographs of Filtek Z500 showed that only the small nanoparticles, but not the nanoclusters, were ripped away, which would explain the better surface finish. As shown by Yap et al. [6] for nanofill composites, these nanoclusters can wear, fracture, and allow nanoparticles to break free, but the remaining nanoclusters remain present [24]. This unique fracture mechanism may leave only minor fault-points, thus offering a relatively smooth surface finish [26]. Filtek Z500 had a uniformly polished surface with no visible texture features between the filler particles and surrounding matrix in the wake of the QB and QWB sequences. These results are in agreement with those of Antonson et al. [27], who showed that the Filtek Supreme Plus had the smoothest surface after 4 different finishing–polishing procedures.
There were few significant differences between composites in the QB or QWB finishing–polishing procedures. Thus, as the polishing procedure becomes more effective, the composition of the resin composite has less influence on the final polish result. However, despite the lack of significant differences between composites in the QB and QWB procedures, the smoothest surfaces were produced by the resin composites that used smaller-sized but larger-bulk-content fills (Filtek Z500, Tetric Evoceram, and Tetric Evoceram Bulk Fill).
Of the finishing–polishing sequences tested, Filtek Z500 showed the best surface hardness values, which were significantly higher (p < 0.05) than the other 4 resin composites that were compared. A study by Ferracane reported a positive correlation between the percentage of inorganic-phase fillers in a resin composite and its hardness and wear resistance [625]. This does not accord with the results found here, since Filtek Z500 (78.5% by weight) is less filled than Tetric Evoceram Bulk Fill (82.5% by weight) and Tetric Evoceram (80% by weight). The results for Filtek Z500 can be explained in terms of its filler composition. According to the manufacturer, the fillers in Filtek Z500 disperse through the matrix in 2 forms: a free form (as nanoparticles) and an agglomerated form termed nanoclusters. The net result is that during the finishing–polishing procedure, nanoparticles are ripped out, whereas nanoclusters are not, thus leaving a smoother and harder surface [26]. Furthermore, Filtek Z500 contains silicon-based (7 on the Mohs hardness scale) and zirconium (7.5 on the Mohs hardness scale) fillers, which are intrinsically harder materials than the barium glass fillers (1.25 on the Mohs hardness scale) employed in the other 4 resin composites studied.
Regarding clinical significance, Filtek Z500 yielded significantly harder surfaces regardless of the finishing–polishing sequence tested (p < 0.05). The use of the blue-and-yellow-ring Q crosscut 12/15-fluted finishing bur, followed by the white-ring crosscut 30-fluted polishing bur, resulted in the best values of surface roughness and hardness. As the polishing procedure becomes more effective, the composition of the resin composite has less influence on the final polish result.
CONCLUSIONS
Within the limitations of this study, the QWB finishing and polishing sequence was significantly more effective than the QB sequence in terms of the final hardness and roughness of nanocomposite resins. Regarding the finishing–polishing sequences, the use of 2 tungsten carbide burs (instead of a single one) yielded better surfaces. For all 5 composites, the Mylar-formed surfaces were the smoothest and exhibited the lowest hardness. Filtek Z500 presented significantly harder surfaces regardless of the finishing–polishing sequence tested. Therefore, hardness and roughness for the 5 nanocomposites showed material dependency when using the QB and QWB finishing–polishing sequences.
 XML Download