

 PDF
PDF Citation
 Print
Print


INTRODUCTION
Prostate cancer is a major cause of death globally and a huge burden on society. Prostate cancer is the most common cancer and is the third leading cause of death in men in developed countries.1 Recently, the incidence of prostate cancer has increased abruptly in Korea.2 This trend is probably explained by the increase in obesity due to changes in lifestyle related to westernization, such as low physical activity or consuming more fatty food in many Koreans. However, the relationship between westernization and prostate cancer remains uncertain.3 The prognosis and degree of malignancy of prostate cancer differs between Western men and Asians,4 and studies based on Asian data are needed.
Recently, the concept of metabolic health has been emerging. Unlike in the past, when prognosis depended simply on abdominal obesity or body mass index (BMI), patients with normal weight have a worse prognosis if they have a metabolic disease. The existence of individuals with normal weight according to BMI who have metabolic disturbances characteristic of obesity—i.e., metabolically obese, normal-weight (MONW) individuals—was suggested in 1981 by Ruderman et al.5 MONW individuals have low physical activity, low energy consumption, and poor cardiopulmonary function.6 Furthermore, they also have a large visceral fat area and high levels of plasma triglyceride (TG)78 and are more likely to develop insulin resistance or diabetes than their metabolically healthy counterparts.9 Despite these serious concerns, MONW patients cannot be identified using routine tests because of their normal BMI and there are no standard criteria for MONW individuals.10
Also, compared with people with similar BMI, Asians have more body fat.11 Koreans with low BMI are more vulnerable to the metabolic syndrome than Western populations.12 Therefore, it is necessary to decide which persons are metabolically obese and which risk factors can be modified before the onset of a metabolic disorder.10
In this study, we aimed to clarify the association between metabolic health status and the incidence of prostate cancer using national data of the Korean population.
METHODS
Data source and study population
In Korea, the National Health Insurance System (NHIS), which was established in 2000, covers almost 98% of Korean citizens (approximately 50 million as of 2014).13 As part of the NHIS, all insurance subscribers and dependents are requested to undergo a free biannual health check-up, and in 2013, approximately 68% did so.14 Thus, National Health Check-ups (NHC) database contains anthropometric data, laboratory results and standard questionnaire as a population-based nationwide scale.
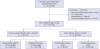
Data from 11,771,252 men who participated in NHC between January 1, 2009 and December 31, 2012 and 56,552 men who were newly diagnosed with prostate cancer were analyzed. Men with previous prostate cancer were excluded (Fig. 1). Because patients who are diagnosed with any of 4 major diseases (cancer, cardiovascular and cerebrovascular disease, or a rare disease) are entitled to economic benefits from the Korean government,15 almost all patients with cancer are listed in the national database.3 Diagnostic codes in accordance with the 10th revision of the International Classification of Diseases (ICD-10-CM) were used. Prostate cancer is coded C61 in ICD-10-CM.
Definition of obesity and metabolic health status
Obesity was diagnosed according to the World Health Organization definition of obesity for Asians. BMI was calculated as weight in kilograms divided by the square of height in meters (kg/m2), and the study population was divided into obese (BMI ≥ 25 kg/m2) and normal-weight (BMI < 25 kg/m2) groups.1116.
Metabolic obesity was diagnosed according to the National Cholesterol Education Program-Adult Treatment Panel III criteria except waist circumference (WC) if any 3 or more of the following components were present: TG ≥ 150 mg/dL, high-density lipoprotein (HDL) cholesterol < 40 mg/dL, fasting glucose ≥ 100 mg/dL, blood pressure (BP) ≥ 130/85 mmHg (or taking antihypertensive drug treatment), or WC > 90 cm, according to the International Diabetes Federation criteria for Asian countries.1017 Blood samples were collected after overnight fasting for measuring serum glucose levels and lipid profiles.3
Subjects were classified into 4 groups based on the metabolic health status: metabolically healthy, normal-weight (MHNW); MONW; metabolically healthy, obese (MHO); and metabolically obese, obese (MOO).
Statistical analysis
We used SAS version 9.3 (SAS Institute Inc., Cary, NC, USA) for statistical analyses. Categorical variables are expressed as percentages and continuous variables are expressed as mean ± standard error. Multivariate Cox regression analysis was performed to examine the hazard ratio (HR) and confidence interval for the relationship between metabolic health status and prostate cancer. The P values < 0.05 were considered statistically significant.
RESULTS
Baseline characteristics of the study population
This study was performed on men patients who underwent an NHC at least once from 2009 to 2012, and those who underwent multiple check-ups were enrolled based on their first examination. A total of 11,771,252 patients were included in the study. The mean age was 46.5 ± 14.1 years and the mean BMI was 24.2 ± 3.1 kg/m2. Regarding BMI, 7,391,410 patients (62.8%) had a BMI < 25 kg/m2 (normal-weight group) and 4,379,842 patients (37.2%) had a BMI > 25 kg/m2 (obese group).
There were significant differences in age, BMI, WC, BP, glucose level, and lipid profile (P < 0.001) between the normal-weight group and the obese group.
The patients were stratified into 4 groups based on BMI and metabolic health status. The MHNW group included 6,165,051 patients (52.4%), the MONW group included 1,226,359 patients (10.4%), the MHO group included 2,312,838 (19.6%) patients, and the MOO group included 2,067,004 patients (17.6%). Among these groups, significant differences in age, WC, BP, fasting glucose level, and lipid profile. In the MONW group, 58.2% had incident hypertension, 30.7% had incident diabetes, and 46.3% had incident dyslipidemia. In the MOO group, 56.5% had incident hypertension, 24.4% had incident diabetes, and 38.1% had incident dyslipidemia.
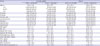
The mean age was highest in the MONW group followed by the MOO, MHNW, and MHO groups. Regarding lifestyle, the MHNW group had the highest smoking rate, and the MOO group had the highest rate of frequent drinking (over once a week). The rate of regular exercise once a week was lowest in the MONW group. Regarding the rates of underlying disease, the MONW group had the highest rates of hypertension, diabetes, and dyslipidemia. The characteristics of the study population are shown in Table 1.
Table 1
Baseline characteristics of subjects according to BMI and metabolic health status
Incidence and risk of prostate cancer according to obesity and metabolic health status
During a mean 5.4 ± 1.1 years of follow-up, among all the patients, 56,552 were registered with a diagnosis of prostate cancer. Stratified by BMI levels, 1,488 of 280,233 patients with a BMI < 18.5 kg/m2 (incidence rate [IR] per 1,000 person-years 1.02692), 18,879 of 3,966,954 patients with a BMI of 18.5–23 kg/m2 (IR, 0.88399), 16,378 of 3,144,223 patients with a BMI of 23–25 kg/m2 (IR, 0.96029), 18,490 of 3,930,985 patients with a BMI of 25–30 kg/m2 (IR, 0.87084), and 1,317 of 448,857 patients with a BMI > 30 kg/m2 (IR, 0.55533) were diagnosed with prostate cancer. Based on those with a BMI of 18.5–23 kg/m2, the age-adjusted HRs were 0.766 for BMI < 18.5 kg/m2, 1.19 for BMI of 23–25 kg/m2 level, 1.228 for BMI of 25–30 kg/m2, and 1.272 for BMI > 30 kg/m2, showing that HRs increased as BMI increased.
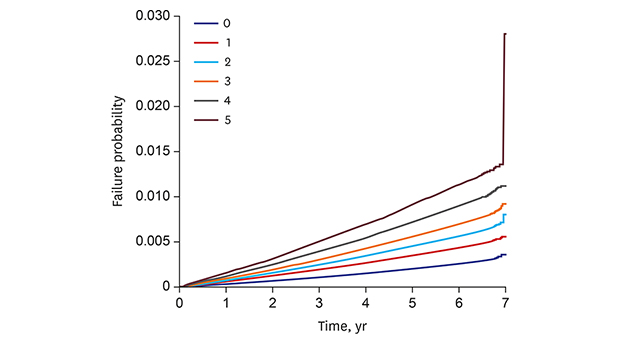
Among the components of the metabolic syndrome, the IR of patients with a WC ≥ 85 cm was 1.18 (HR, 1.167). The IR of patients with high BP was 1.25 (HR, 1.11). The IR of diabetic patients was 1.20 (HR, 1.072). The IR of patients with a high TG and low HDL level was 0.95 and 1.37, respectively (HR, 1.083 and 1.17, respectively). Overall, 23,945 of 3,293,363 metabolically obese patients were diagnosed with prostate cancer, showing an IR of 1.36 and HR of 1.18 (Table 2). As the number of metabolic components increased, HR significantly increased (Fig. 2).
Table 2
Association between metabolic parameters and IR of prostate cancer
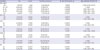
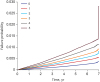
Fig. 2
Kaplan-Meier estimates of survival curves for the time to incident prostate cancer, stratified by metabolic health status. The median follow-up duration was 5.4 years. Subjects were divided into 6 groups according to the number of components of metabolic health status (log-rank test, P < 0.001).
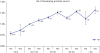
When analyzed according to classification into the MHNW, MONW, MHO, and MOO groups (based on MHNW), the multivariable-adjusted (for age, smoking, drinking, and exercise) HR was 1.143 for the MONW group, 1.097 for the MHO group, and 1.25 for the MOO group, showing the HR for the MONW group was higher than that for the MHO group. The same result was shown when patients were stratified by age group: young men who aged under 40 years, middle aged men (40–65 years), elderly men aged over 65 years (Table 3). When stratified based on BMI, metabolically obese patients showed a significantly higher HR than metabolically healthy patients in all BMI groups (Fig. 3).
Table 3
Association between metabolic status and incident prostate cancer according to age

DISCUSSION
In this study that evaluated a nationwide cohort representing the general Korean population, the findings showed an association between the IR of prostate cancer and metabolic health status.
The new concepts we found in this study are as follows. First, the age-adjusted and multivariable-adjusted HRs of prostate cancer increased as the components of metabolic syndrome increased. Our graph (Fig. 2) shows that the IR of prostate cancer increased sequentially. Second, the prevalence rate of prostate cancer in metabolically obese patients was higher than that of metabolically healthy patients in all BMI subgroups. Regardless of BMI, the prevalence of prostate cancer varied according to metabolic health status. Finally, the HR of prostate cancer is higher in MONW patients than in MHO patients. Even normal-weight patients with metabolic disease showed a worse result than those with a high BMI but no metabolic disease. Although the prevalence of prostate cancer is low in patients aged under 40 years, a considerable number of subjects undergo NHC at a relatively young age, and it is meaningful that the HR of MONW is also higher than MHO in this age group.
Yang et al.18 analyzed Korean NHIS data and published an analysis of obesity, metabolic health status, and mortality rate. A metabolically unhealthy status increases all-cause mortality and cardiovascular mortality independently of BMI. There is also a dose-response relationship between the number of metabolic diseases and the mortality rate.18 Our study showed that the prevalence of prostate cancer was increased by metabolic disease regardless of BMI, similar to other studies.
Recently, several epidemiologic studies have revealed that diabetes or obesity are associated with an increased risk of developing prostate cancer.3192021 They suggested the following mechanisms play a role: insulin/insulin-like growth factor-1 pathway, sex steroid pathway, and inflammation induced by adipocytes. It has been suggested that obesity could produce prostate cancer via the sex hormones. Testosterone is aromatized in peripheral adipose tissue, and when the amount of adipose tissue is increased, aromatization increases, which could affect the development and progression of prostate cancer.2223
However, Gong et al.24 analyzed the Prostate Cancer Prevention Trial data and reported on the risk of obesity, diabetes, and prostate cancer. In 10,258 patients analyzed (including 1,936 patients with prostate cancer), obesity (BMI > 30 kg/m2) reduced the risk of prostate cancer with a Gleason score ≤ 6 by 18%, and increased the risk of prostate cancer with a Gleason score ≥ 7 by 29%. Diabetes reduced the risk of prostate cancer with a Gleason score ≤ 6 by 47% and decreased the risk of prostate cancer with a Gleason score ≥ 7 by 28%. In this study, obesity seems to have different effects on aggressive and nonaggressive prostate cancer. Thus, obesity itself has no relevance to the development of prostate cancer, or perhaps it is simply too difficult to determine the risk of prostate cancer based on BMI.
Results regarding the relationship between the metabolic syndrome and prostate cancer have also been conflicting. Studies in Europe have shown a positive relationship between the metabolic syndrome and prostate cancer,252627 whereas studies in North America found a negative relationship between the metabolic syndrome and prostate cancer.282930 However, this may explain why prostate-specific antigen (PSA) screening differs from country to country. In Korea, PSA is not nationally screened, but the health exam is active for all citizens, so this study, which is aimed at the general population groups, can serve as a new reference.
A strength of our research is that we used a large sample of a national population, and therefore, these results could be generalized to Koreans or East Asians. Everybody in Korea has national health insurance, and most people undergo a nationally administered health examination. In addition, cancer patients are registered nationwide, meaning their data are reliable and superior to data used in other cohort studies.
Our study had several limitations. First, the data did not include detailed biochemical information with respect to prostate cancer, and therefore, we could not evaluate the aggressiveness or prognosis of prostate cancer. Second, because it is possible for disease codes to not show the exact disease condition, and because a prescription cannot guarantee compliance, there may be errors in the classification of metabolic health status. Third, the difference seems to be little between the groups.
Despite these limitations, our study is meaningful as the first large-scale cohort study that shows the relationship between metabolic health status and prostate cancer. Because a large population was researched, a small increase between each group and the MHNW group correlates to a statistical significant increase. Large-scale research will be needed in the future along with more detailed descriptions of patients.
In conclusion, this population-based nationwide study revealed an association between metabolic health status and the incidence of prostate cancer, and the risk increased according to the number of components of the metabolic syndrome. The HR of prostate cancer is higher in MONW patients than in MHO patients; therefore, regarding prostate cancer prevalence, the presence of a metabolic disease is more important than BMI.
 XML Download