

 PDF
PDF Citation
 Print
Print


INTRODUCTION
Metabolic syndrome (MS) is a cluster of cardiovascular risk factors associated with insulin resistance, including central obesity, dyslipidemia, impaired glucose tolerance, and hypertension.1 MS is known as an important risk factor for cardiovascular disease (CVD) and mortality therefrom, diabetes mellitus,2 and chronic kidney disease.3 Previous studies have shown that traditional MS criteria have utility in predicting chronic disease, such as diabetes and CVD, beyond the individual components themselves.45 As the burden of chronic disease has increased globally, identifying individuals at higher risk for disease progression by assessing MS status is important. However, assessing the severity of MS and changes in MS status over time in individuals is difficult when using traditional MS criteria.
Traditional MS based on sets of criteria such as those by the National Cholesterol Rationale Education Program Adult Treatment Program III (NCEP ATP-III) and the International Diabetes Federation have several limitations in clinical practice as follows.167 Due to dichotomy of current MS definitions (present/absent), minimal changes in criteria values could result in classifying patients as having MS or not, although only a negligible change has been made.8 The lack of a universal definition of MS and the fact that MS has been defined as a dichotomous variable have ushered in the development of continuous scores of the syndrome that are specific to gender and race/ethnicity.9 Recent studies have reported the use of these scores in predicting future CVD based on MS severity in mid-adulthood.10 However, all available MS severity score equations have been generated based on US population data, and MS severity score equations for Asian populations have yet to be developed.
Thus, we aimed to formulate a set of continuous MS severity scores based on data that are nationally representative of the Korean population. To do so, we utilized confirmatory factor analysis on data from the Korea National Health and Nutrition Examination Survey (KNHANES) to assess how the five classic MS components contribute differentially to the latent MS factor. Doing so acknowledges that the individual MS components may contribute differentially to an estimate of the overall severity of MS. Subsequent thereto, we attempted to validate the generated MS severity scores in a different dataset of Korean adults.
METHODS
Study population and design
Data from the KNHANES V (2010–2012) and VI (2013–2015), which are nationally representative for the Korean population, were used for the formulation of MS severity scores, and data from the KNHANES VII (2016) were utilized for internal validation. Details concerning this survey have been previously published.1112 The KNHANES has been annually performed by the Division of Chronic Disease Surveillance of the Korean Centers for Disease Control and Prevention since 1998. The KNHANES is a cross-sectional and nationally representative survey, comprising a health interview and nutrition and health examinations, to assess the health and nutritional states of the Korean population. Participants aged 20–59 years old are analyzed. For the confirmatory factor analysis described below, participants were excluded if they were pregnant, had known diabetes or unknown diabetes (fasting plasma glucose > 125 mg/dL), or were taking anti-hyperlipidemic, anti-hypertensive, or anti-diabetic medications. We also excluded individuals who reported having CVD, who did not have data on MS components, or who had extreme outlier levels of any MS component (Fig. 1). All participants provided written informed consent to participate in KNHANES, and we received the data in an anonymized form. For external validation, we used the dataset from the Ansung-Ansan cohort study, an ongoing prospective study from 2001 embedded within the Korean Genome Epidemiology Study (KoGES). Briefly, 10,030 eligible participants were recruited from 2001 to 2002. Study participants were re-examined at 2-year intervals, and 6,238 participated in the sixth follow-up survey. Detailed information regarding KoGES and the methods have been described previously.1314
Data collection
In the health interview, the participants were asked to provide information about health behaviors and medical history. Height and body weight measurements were performed with the participants wearing light clothing and no shoes. Waist circumference was measured at the narrowest point between the upper iliac crest and the lowest rib after normal expiration. Blood pressure was measured by averaging three recordings taken in the morning after at least 10-minute of rest in a sitting position. Blood pressure was measured twice, using a mercury sphygmomanometer (Baumanometer; W. A. Baum Co. Inc., Copiague, NY, USA), in the sitting position after at least 10-minute of rest. Laboratory samples were obtained after a 12-hour fast. Blood samples were immediately refrigerated; transported to the Central Testing Institute in Seoul, Korea; and analyzed within 24 hours. Fasting plasma glucose, total cholesterol, triglyceride (TG), and high-density lipoprotein (HDL) cholesterol levels were measured with a Hitachi 700-110 chemical analyzer (Hitachi, Tokyo, Japan). The homeostasis model assessment of insulin resistance (HOMA-IR) index was calculated as fasting serum insulin (mU/L) × fasting plasma glucose (mg/dL)/405.
Definition of MS
Based on the modified NCEP ATP-III criteria,15 MS was defined as the presence of three or more of the following components: 1) abdominal obesity, defined as a waist circumference ≥ 90 cm for men or ≥ 85 cm for women (following Korean specific cutoffs for abdominal obesity defined by the Korean Society of Obesity)16; 2) hypertriglyceridemia, defined as a serum TG concentration ≥ 150 mg/dL; 3) low HDL cholesterol, defined as a serum HDL cholesterol concentration < 40 mg/dL for men or < 50 mg/dL for women; 4) high blood pressure, defined as a systolic blood pressure (SBP) ≥ 130 mmHg, a diastolic blood pressure (DBP) ≥ 85 mmHg, or treatment with antihypertensive agents; and 5) high fasting glucose, defined as a fasting serum glucose ≥ 100 mg/dL or previously diagnosed type 2 diabetes.
Formulation of MS severity scores
The general methods for the formulation of MS severity score have been reported previously.917 These scores were derived using a confirmatory factor analysis approach for the five traditional MS components (waist circumference, TG, HDL cholesterol, SBP, fasting glucose) to determine the weighted contribution of each of these components to a latent MS factor on a gender- and age-specific basis. Confirmatory factor analysis was performed for adults aged 20–59 years in the KNHANES datasets who were categorized into four subgroups based on gender and the following ages: 20–39 and 40–59. For each of these four population subgroups, factor loadings for the five MS components were determined toward a single MS factor. These factor loadings were used to generate equations with which to calculate a standardized MS severity score for each subgroup. The resulting MS severity scores are presented as z-scores (normally distributed and ranging from theoretical negative to positive infinity with mean, 0 and standard deviation [SD], 1) of relative MS severity on a gender- and age-specific basis.18
Statistical analysis
All statistical analyses were performed using SAS (version 9.4; SAS Institute Inc., Cary, NC, USA); confirmatory factor analysis was performed using Mplus (version 8; Muthén & Muthén, 1998–2017, Los Angeles, CA, USA). Descriptive statistics on baseline characteristics were calculated for all included participants. The prevalence of MS and mean MS severity scores were calculated across the gender and age groups. We excluded extreme outliers for the five components of MS, defined as > 3 times the interquartile range above the 75th percentile or below the 25th percentile for each component. MS severity scores were derived using a confirmatory factor analysis approach for the five traditional components of MS to determine the weighted contribution of each of these components to a latent MS factor on a gender- and age-specific basis.1719 In such a factor analysis, both SBP and DBP should not be included together, as the two are highly correlated with each other.20 We chose SBP given that it is more strongly associated with insulin resistance.2122 Because TG levels showed a skewed distribution, log-transformed values were used. The inverse of HDL cholesterol was used, such that a higher factor loading score would be similar in interpretation to the other measures in the model. All variables were standardized (mean, 0; SD, 1) in the gender and age groups. A one-factor model formed the basis of all confirmatory factor analyses performed; measurement errors between the five components were assumed not to be correlated. The factor loadings were of interest, indicating the magnitude of association between each component and the underlying MS factor. Factor loadings > 0.4 were considered clinically meaningful. The parameters of the confirmatory factor analyses were estimated using the maximum likelihood method. As the χ2 test of exact fit tends to be highly sensitive to larger sample sizes, other fit indices, including the comparative fit index (CFI, < 0.90 indicates a poor fit) and root mean square error of approximation (RMSEA, > 0.05 indicates a poor fit), were examined.23 Goodness of fit indices included the standardized root mean square residual (SRMR, > 0.08 indicates a poor fit), the goodness of fit index (GFI, < 0.90 indicates a poor fit), and the Bentler-Bonett normed fit index (NFI, < 0.90 indicates a poor fit).9 Factor scores (estimates of an individual's latent factor) can be constructed by taking appropriate linear combinations of the variables in the analysis.22 We calculated the factor score and estimated MS severity scores by linear regression analysis with unstandardized traditional five components. The standardized factor coefficients from the model were used to calculate the MS severity score in each individual. This score can be interpreted as a z-score (mean, 0; SD, 1), with higher scores representing an increased risk or severity of MS.9 We examined the relationship between estimated MS severity scores and metabolic parameters, such as high-sensitivity C-reactive-protein (hsCRP), glycated hemoglobin (HbA1c), and HOMA-IR, using correlation analysis. Direct internal validation was performed using receiver operating characteristic (ROC) analysis to assess the ability of this MS severity score for discrimination against the traditional ATP-III criteria of MS. For an external validation, we used data from the Ansung-Ansan cohort study to observe changes in MS severity score at the time of diagnosis according to the traditional NCEP ATP-III criteria.13 From baseline to the sixth follow-up, the mean profile plot showed changes in MS severity scores. The mean profile plot is expressed as a mean ± standard error.
Ethics statement
The present study protocol was reviewed and approved by the Ethics Committee of the Korean Center for Disease Control and the Institutional Review Board (IRB) of Yonsei University Wonju College of Medicine (IRB No. 2018-04-0026). At each visit, informed written consent was obtained from all participants.
RESULTS
Confirmatory factor analysis
The sample of participants utilized in the series of confirmatory factor analyses consisted of 18,051 Korean adults aged 20–59 years old in the KNHANES V and KNHANES VI datasets with complete data for MS components (Supplementary Table 1). The overall prevalence of MS in this sample was about 19% in men and 9.17% in women according to ATP-III criteria. Upon performing confirmatory factor analysis of MS components in this sample, we generated a model with increasingly better fit to the data (Table 1). As expected, because of the relatively large sample size, all χ2 tests were significant; therefore, other fit indices were examined to determine goodness of fit.25 The model fit indices, including RMSEA, SRMR, GFI, NFI and CFI values, were 0.111–0.149, 0.045–0.063, 0.956–0.975, 0.778–0.899, and 0.779–0.899, respectively. The overall models exhibited acceptable model fit, based on the SRMR and GFI. However, the RMSEA, NFI, and CFI indices were not acceptable. Regarding factor loadings, there was a notable difference in the magnitude of factor loadings among the gender and age groups. Among MS components, waist circumference had the highest factor loadings, indicating that waist circumference held the strongest correlation with MS among Korean adults. Notably, subjects of age 20–39 years had higher factor loading for waist circumference than those aged 40–59 years. SBP and fasting glucose had the lowest factor loadings in Korean adults overall, and this trend was more readily apparent in adults aged 40–59 years.
Table 1
Model fit indices and factor loadings

RMSEA = root mean square error of approximation, CI = confidence interval, SRMR = standardized root mean square residual, GFI = goodness of fit index, NFI = Bentler-Bonett normed fit index, CFI = comparative fit index; SBP = systolic blood pressure, HDL = high-density lipoprotein, TG = triglyceride.
Equations for age and gender-specific MS severity score
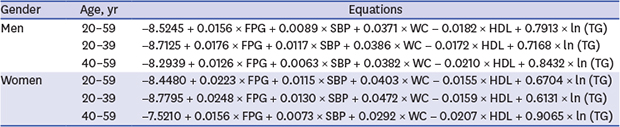
Equations based on the factor coefficients from confirmatory factor analysis results are presented in Table 2. These could be used to calculate MS severity scores based on the clinically-used components of MS. For ease of clinical use, these equations are based on actual values of the variables and not the standardized measures that went into the factor analysis; they were derived by back-transforming the coefficients that resulted from the standardized factor analysis.
Table 2
Equations for MS severity scoresa using confirmatory factor analysis

MS = metabolic syndrome, FPG = fasting plasma glucose, SBP = systolic blood pressure, WC = waist circumference, HDL = high-density lipoprotein, TG = triglyceride.
aMS severity scores are generated from inserting an individual's clinically measured values for waist circumference (in centimeters), HDL (in milligrams per deciliter), SBP (in millimeters of mercury), natural-log of fasting triglycerides (in milligrams per deciliter), and fasting glucose (in milligrams per deciliter).
Validation of the MS severity score equations
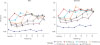
The MS severity score values were significantly correlated with various metabolic parameters such as hsCRP, HbA1c and HOMA-IR (Fig. 2 and Table 3). ROC analysis of the MS severity scores in our internal validation data set (KNHANES VII) demonstrated an excellent ability to predict traditional MS classification (Fig. 3 and Table 4). The area under the curve (AUC) values of MS severity scores were ≥ 0.94 for all age and gender groups. We next assessed MS severity scores for follow-up visits at which ATP-III MS was first diagnosed in adults aged 40 years or older using the Ansung-Ansan cohort dataset. Over the average 12-year follow-up period, MS severity scores increased overall from (0.27 ± 0.86) to (0.42 ± 0.91), increasing in 56% of the participants. In contrast, the prevalence of ATP-III MS increased from 25.02% to 37.18%. Overall, MS severity score progression was notably higher among women (0.030 ± 0.120 per visit) than among men (0.016 ± 0.120) (P < 0.001). In terms of MS severity score at MS diagnosis by ATP-III, participants with baseline ATP-III MS had the highest MS severity scores across all visits, while those diagnosed with ATP-III MS in subsequent visits had progressively higher baseline MS severity scores in relation to the time until ATP-III MS was diagnosed (all P < 0.001) (Fig. 4).
Fig. 2
Scatter plot between MS severity score and biomarkers.
MS = metabolic syndrome. hsCRP = high-sensitivity C-reactive protein, HOMA-IR = homeostasis model assessment of insulin resistance, HbA1c = glycated hemoglobin.
aLog transformed.
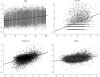
Table 3
Correlation coefficients between MS severity scores and biomarkers

Fig. 3
ROC curve of MS severity score for prediction ATP-III MS.
ROC = receiver operating characteristic, MS = metabolic syndrome, ATP-III, Adult Treatment Program III, AUC = area under the curve.
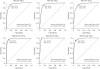
Table 4
Internal validation of MS severity scores for predicting ATP-III MS in KNHANES VIII data

DISCUSSION
Herein, we formulated MS severity scores for middle-aged Korean adults using confirmatory factor analysis that place differential weights on individual MS components to account for variations in how MS is manifested by gender and age groups. We observed that the MS severity scores were highly correlated with other surrogate markers of MS risk, including hsCRP and HOMA-IR. Moreover, we externally validated the ability of the MS severity scores to predict the development of MS using a longitudinal cohort dataset. To our knowledge, this is the first study to investigate an age- and gender-specific MS scoring system for Korean adults based on the unique contribution of individual MS components to their underlying MS factor.
Traditional MS criteria are limited to identifying MS risk only when a person exhibits abnormalities beyond the cutoffs for three of the components. Conceptually, this denies that MS likely exists as a spectrum of risk, as reflected in increases in risk for individuals with increasing numbers of abnormalities in underlying MS components.4 Moreover, traditional MS criteria cannot be used to follow individuals over time or to assess changes in their MS status over time.24
Thus, continuous MS severity score was generated considering the differences in chronic disease risk factors between gender and racial/ethnic groups. MS scores have been derived in a variety of ways.20 It has been argued that a continuous MS score is statistically more sensitive and less error prone than a MS score developed with a dichotomous approach.20 One study used principal component analysis to estimate their MS score.25 However, since principal component analysis is an exploratory method, it is not appropriate for use in efforts to confirm the hypothesis that five components are associated with one latent factor, MS. In previous studies in Korea, the sum of z-scores for the five components of MS was expressed as a continuous MS risk score.26 However, in this study, MS severity scores were estimated by assigning weights that considered the correlation between each component and the MS factor, in addition to differences therein in relation to age and gender. It should be noted that this MS severity score was formulated solely based on how the individual MS components cluster together and was not directed at outcomes prediction. However, recent studies have reported that MS severity score, despite its roots purely as a MS severity assessment, does predict long-term cardiovascular and diabetes outcomes.2728 This suggests that MS severity score may provide additional information on the pathophysiological processes behind MS that are not captured in outcomes-based formulations.29 However, these MS severity scores can be applied only to White, Black and Hispanic races now and there is no MS scoring system for Asian populations. For this reason, we formulated the continuous MS severity score for Korean adults in this study. Regarding the potential utility of MS severity scores in clinical practice, we found that participants with baseline ATP-III MS had the highest MS severity scores across all visits and that subjects diagnosed with ATP-III MS in subsequent visits had progressively higher baseline MS severity scores in relationship to the time at which ATP-III MS was diagnosed (Fig. 4). Accordingly, our data support the potential use of MS severity as a screening tool and a means of following a particular individual's trajectory toward worsening MS severity and final diagnosis of traditional MS. Furthermore, we found the MS severity worsened within individuals over a 12-year period, with increased MS severity scores from baseline to follow-up in 56% of individuals. In contrast, the use of traditional MS criteria to assess changes in the burden of MS during this period was only able to document an increase in prevalence by 12.16%, missing ongoing worsening of metabolic derangements within individuals already classified with MS. This result is in line with those of The Atherosclerosis Risk in Communities Study that reported that, although 76% of participants showed increases in MS severity score, the prevalence of MS only increased 17% when applying traditional ATP-III MS criteria over a 10-year period.30 Given recent findings documenting changes in MS severity score over time as a predictor of future chronic disease, our data may be of use in clinical settings to follow MS status in individuals.
Due to differences in correlation between MS and other cardiovascular risk factors according to race/ethnicity and because of the differences in MS-related risk according to gender, we performed confirmatory factor analysis on a gender- and age-specific basis and noted differences in the factor loadings of the five MS components between gender and age groups among Korean adults (Table 1). Waist circumference and TG levels exhibited relatively higher factor loadings overall, compared to other MS components. This indicates that both waist circumference and TG are highly correlated with MS among Korea adults. Waist circumference had high factor loadings among adults aged 20–39 years in particular; adults aged 40–59 exhibited lower factor loadings for waist circumference. TG also had high factor loadings overall, except in women aged 20–39 years. HDL cholesterol had particularly high factor loadings among women aged 40–59 years. SBP exhibited lower factor loadings overall, compared with the other components,31 which is consistent with results in US populations.9 This finding is congruent with the fact that relatively high rates of hypertension are independent of MS. Because of its low factor loadings, previous researcher groups have generated a model omitting SBP. Although they found this model improved fit statistics, this model was less correlated with other chronic diseases, compared to the model including SBP. This is the reason why we should include SBP in formulating MS severity score in spite of its low factor loadings.
There are some limitations in our study. We performed confirmatory factor analysis on a group that was relatively healthy and free from medications that could produce perturbations in MS-related measures so as not to mask potential important relationships. In addition, we could not externally validate the predictive ability of our MS severity scores in adults aged 20–39 due to a lack of data. Furthermore, because of the complexity of calculating the score, clinical use of this score has limitations in clinic. Lastly, we could not validate our scoring system as a predictor for future metabolic disease such as CVD due to lack of data on cardiovascular outcome in our cohort. Despite these limitations, however, our study also had noteworthy strengths. First, we analyzed data that were collected from a large, representative population sample with significant representation, thereby increasing the reliability of results. Also, we extensively tried to validate our scoring system using another cohort dataset.
Collectively, we formulated age- and gender-specific continuous MS severity scores that are nationally representative for the Korean population. The scores may provide a potential means with which clinicians can determine risk of future disease in their patients and follow changes in disease risk over time. Future research is needed to link specific cutoff values of the scores to risk for later disease, as a means of better targeting individuals most likely to benefit from interventions in Korean populations. In addition, documentation of score responses to treatment in controlled conditions could provide guidance on the best approach to lowering overall metabolic risk over time.
 XML Download