

 PDF
PDF ePub
ePub Citation
 Print
Print


Introduction
Malaria is a febrile, life threating protozoan disease in the tropical and subtropical zone, caused by the species of Plasmodium, namely, Plasmodium falciparum, P. vivax, P. ovale, P. malariae, and P. knowlesi, transmitted through the bite of infected female Anopheles mosquito [1]. Of these, mainly P. falciparum is most prevalent for causing the highest mortality rate and morbidity in tropical and sub-tropical countries [2]. Ninety-five countries have a high risk of transmission of malaria disease, most of these countries are the tropics [3]. Globally, it was found that there was substantial increasing number of cases noted in the African region while marginally found in South-East Asia, and Western Pacific region [4]. In 2016, 216 million cases were occurring, among these, ninety percent of cases were found in the African Region, followed by South-East Asia by seven percent and two percent in the Eastern Mediterranean Region [2]. Furthermore, 445,000 deaths were estimated in 2016, compared to 446,000 estimated deaths in 2015. However, these estimated morbidities and mortality of malaria were frequently developed in children under the age of five years and pregnant women [56].
In Nepal, micro-stratification exercise was conducted for malaria cases where 54 village development committees (VDC) were found as high-risk VDC while 201 as moderate risk and 999 low-risk VDCs for malaria in Nepal [7]. Although, these districts were set on the basis of malaria cases through vector breeding (indigenous) and vulnerability due to imported malaria. In the regards, 13 millions of people were living in malarial VDCs, of them, one million were living in high risk and 2.66 million were at moderate risk while 9.38 million were living in low-risk areas of Nepal. In addition, approximately 48% of the population is at risk of malaria and threat of an outbreak [8]. It was found that the confirmed malaria cases peaked in 1985 with over 42,321 cases while there was dramatically declined in 2001 with 3,936 cases. Afterwards, this trend was found fluctuation with outbreaks is some districts (Bank, Nawalparasi, and Rupandehi), the last of which, occurred in 2006, since then there has been a gradual declining in the burden of malaria in the country [8]. Furthermore, the disease is predominately found in the Terai regions (forest- fringe and inner Terai) due to the altitudes (<1,500 m) and the temperature 21℃ to 34℃ [56]. Although, hills and mountain regions are also reported for the malaria disease due to the imported, which mean the parasite acquired from an endemic area by the people either by a visitor or indigenous native and diagnose in non-endemic areas, like hilly region of Nepal [91011].
From the aforementioned, Terai region is set as the higher (90%) risk for transmitting malaria [812]. However, only P. vivax and P. falciparum are detected as responsible protozoa for transmitting the disease [13141516]. Hence, gaining knowledge of mortality due to malarial disease can be beneficial in improving health policy, and thus improving the survival and extending the longevity. Additionally, it will facilitate to develop a better public health intervention and contribute in children as well as maternal health in Nepal. Moreover, distribution of malaria with patterns and trends in 25 risk districts provides the strategic direction and specific program for malaria control and also provided good understanding of malaria cases in Nepal. Some studies have been conducted for 31 malaria-risk districts, and the results show that there has been a significant declining of malaria cases [816]. However, P. falciparum has no any effect to decline the malaria incidences and causing the serious public health problem in the country [8]. Hence, eliminating P. falciparum malaria is a top one priority program for the government of Nepal, so it has been keep moving towards making the malaria-free Nepal by 2026 [16]. To achieve this status, there should be proper coordination of health facilities for systematic recording and reporting of data [716]. Therefore, this study deploying the patterns and trends of malaria with large administrative data. The findings of the study can reflect the reviews of lessons for the country's malaria trends and patterns and helps to improve better health promotion strategies for achieving malaria elimination goals. With respect, it requires an integrated strategic plan, and resource for the prevention, control, and elimination process based on statistical models. The statistical models can also bring out essential details pertaining to the prevalence of the disease, mortality rates and prediction of the health status of the population over a certain period of time. The models highlight these issues which become a blueprint for public health professionals to make good use of available epidemiological data. Therefore, study aimed to identify the distribution, patterns, and trends of malaria using the log-linear model analysis in 25 malaria districts of Nepal.
Materials and Methods
Study area
Nepal has remarkable topographical diversity, range from 59 m from the sea level to 8,848 m to its highest altitude. Terai region is a lowland constituting 23% and nearly it hosts more than half of the total population (50.3%) [17]. Subsequently, Terai has retained the highest population density (392/km2), whereas, the majority of people (83%) are living in rural areas while only 17% in urban [17]. It was found that, higher number of malaria cases were found in rural and Terai region of Nepal [18]. Hence, this study focus only the 25 rural/Terai districts namely, Dadhaldhura, Bardiya, Kapilvastu, Bara, Ilam, Kailali, Banke, Nawalparasi, Chitwan, Jhapa, Kanchanpur, Dang, Rupandehi, Dhanusha, Morang, Surkhet, Mahottari, Saptari, Rautahat, Sun-sari, Makawanpur, Udaypur, Parsa, Sarlahi, and Sindhuli. These districts were selected based on high, moderate and low risk of malaria cases.
Data collection procedure
The data was collected via health management information system (HMIS). This HMIS is a tool, used to collect the information on disease surveillance, vital registration, sentinel reporting, and surveys from grass root (female community health voluntary [FCHVs], maternal and child health worker [MCHWs]) to central level. Each month, FCHVs submitted their collected report to MCHWs, and MCHWs again sent to health post (HP). Then, it is compiled in HMIS form no 9.3 and forward to primary health care center (PHCC) on a monthly basis. Afterwards, PHCCs again compile a form and submit to district public health office (D/PHO) in every month. At last, D/PHO collect all the reports from health facilities (HP, PHCC, and public and private hospital) and submit to the central health directorate and the management information section (MIS) of management division in every 15th of next month. However, some districts/zonal and regionals hospitals may submit a reports directly to the MIS section. Then, the reports were entered into the electronic database of HMIS by MIS section at the central level. Afterward, a retrospective study was utilized the malaria data for 2001 to 2017, retrieved from annual reports of Department of Health Service of Nepal. Meanwhile, study used malaria data for 25 high risk districts selected from Terai and some hilly region of Nepal.
Statistical analysis
In order to estimate the patterns and trends of the malaria cases for the 25 high risk districts the following equation was used: The additive log-linear=In [hiPi] =yi=µ+αi+βi
=yi=µ+αi+βi
In this model, Pi represents the corresponding population at risk in 10,000 live birth and the terms α and β, represents the year and district effects that sum to zero so that µ is a constant encapsulating the overall incidence. In some of the districts while collecting the data, it may be recorded as no malaria cases in some year. These, no malaria cases were recorded as zero. This zero does not allow the log-transformation. Hence, in this condition zero is replaced by constant value, but value from hi greater than zero is maintained. Successively, the distribution of malaria with patterns and trends were calculated by minimizing the data for all years (2001 to 2017) in 25 districts of Nepal from 2001 to 2017. The retrieved data was compiled in spreadsheet then R program was used to analyzed [1920]. In this study, we adopted log-linear regression method to see the trend and pattern of malaria cases. Log-linear provides the better results without any assumption on dependent and independent variable and created the effective relationship on non-linear model [21]. Then model fitting was determined by standard residual plot against the normal quantile based on observed value and expected value. R-square is used to check the model's ability in measuring the variation of data. Furthermore, sum contrast was used to secure the confidence intervals for comparing the adjusted incidence rates within each factor with the overall incidence rate [19]. Then, the confidence intervals for the incidence rates derived from the model and divided into three groups based on their location. These groups are, higher than the mean, average the mean, and lower than the mean. This trichotomy was used to classify schematic maps of high risk districts allowing to their estimated malaria rates.
Results
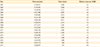
Overall malaria cases vary by years which were shown in Table 1. Period from 2001 to 2017, total of 50,944 malaria cases were reported. Of these, malaria cases during 2001 to 2017, ranged from 4.6 per 100,000 in 2002 which sharply decreased in the year 2016 with 0.5 per 10,000 at risk. During the study period, the number of malaria cases were about 4.6 per 100,000 population at risk which remained as the highest in 2002, likewise, 2016, the cases comes to lowest (0.5 per 10,000 population at risk). Subsequently, the trends of malaria were getting declined from 2009 to 2016, however, it shows the bumping trend in 2017.
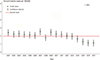
Fig. 1 shows the crude and adjusted with 95% confidence intervals for reported malaria case per 100,000 population at risk for 2001 to 2017, with the reported cases were shown using a logarithmic scale. The results showed that there was a significant annual decline in the malaria cases during all of the survey year, however, there was fluctuating trends of malaria cases during the year 2007 to 2009, and afterwards, it revealed the gradual decline of malaria cases. Subsequently, in the figure, a red horizontal line act as an overall mean for malaria reported cases (2.092) by years.
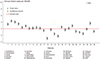
Fig. 2 shows crude and 95% confidence intervals for malaria cases per 100,000 adjusted for districts representing the annual reported malaria cases by district. The malaria cases for the districts were group by the higher, moderate and lower incidence rate. While districts with confidence interval was higher than the overall mean is denoted as the high reports of malaria incidence rate, whereas, lower and corresponding to overall mean of district with confidence interval were represented as the lower and average incidence of malaria cases with in districts, respectively. It was found that the crude and adjusted malaria incidence demonstrated the significant difference among the district. In Dadeldhura, Kanchanpur, Kailali, Bardiya, and Jhapa, of these, Kanchanpur confirmed the most predominant district for malaria while Illam remain as the lowest. Additionally, the red line in the Fig. 3 denoted as the overall mean for the districts.
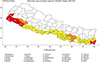
Fig. 3 shows a thematic map showing the distribution of adjusted Malaria incidence cases reported in 25 district of Nepal. The districts with high, moderate and mild malaria cases represented by the three different colors, namely, red, light orange and yellow. The first five districts with red color (Bardiya, Dadeldhura, Jhapa, Kailali, and Kanchanpur) signified as the high risk district, while three districts, color with light orange (Dhanusha, Sindhuli, and Surkhet) represent the moderate risk and remaining 17 districts color with yellow act as mild risk districts for malaria incidence in Nepal. These schematic map provides a blueprint in understanding and knowing graphically how malaria fever has been spreading in Nepal during the study period.
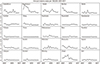
Fig. 4 explained the patterns of malaria cases in 25 districts from 2001 to 2017. In the figure, the severely fluctuating pattern of malaria case was found seven districts (Bank, Dadeldhura, Dhanusha, Kailali, Kanchanpur, Jhapa, and Saptari), while Dang, Bara, kapilvastu, and Sunsari had modrate and rest of the districts had smooth patterns of malaria case. However, the most fluctuating patterns of malaria were noted in 2002 to 2008 for Dadeldhura, Kailali, Kanchanpur, Bardiya, Bank, and Jhapa districts. Even though, 17 districts had stable patterns with <1 malaria cases per 100,000 population at risk.
Discussion
This study assessed the trends and spatial patterns of malaria in 25 districts of Nepal from 2001 to 2017. In this study, linear regression models comprising year and districts as the determinants were fitted to the log-transformed malaria cases. The findings of the study indicating the declining trends of malaria from the period 2001 to 2017. It is possibly due to the considerable investments in public health and medical technology in malaria control and elimination efforts by government and globally as well. Similar results were comparable with World Health Organization and annual report on malaria in Nepal, it was found that intervention through environmental, social and biological strategy helps to reduce the number of malaria cases. Additionally, health promotion programs throughout the country also boosted for decreasing trends of malaria in Nepal [622]. Other literature also well documented that early detection of malaria related to promoting the health of the people, including the good orientation policy, improving the quality of health services with sound laboratory services, mutual support from the government also added up to decreasing trends of malarial disease in Nepal [816].
Temperature carries the vital role for distribution of malaria whereas, rainfall providing the suitable habitats for mosquitoes to breed. According to the altitude and seasonal variation, the temperature of Nepal varies. The altitude is the key factor in the spatial variation of temperature. The mean maximum temperature is found in Terai region (>30℃) while mean minimum is found in Mountain region (−8℃). Furthermore, all seasons (monsoon, summer, autumn, winter, and spring) the mean maximum temperatures of Terai is found highest compare to hilly and mountain region. Hence, the temperature of Terai region provide the crucial environment for the malaria distribution. So, large number of malaria cases was found in Terai region of Nepal. Nonetheless, the study shows the malaria cases were also found in hilly reason. In reality, there was very low chance to find the malaria parasite in the high altitude [23]. In spite of this, malaria was found in Dadeldhura district. Topographically, the height of Dadeldhura is up to 2,639 m from the sea level, which is not the normal habitat of malaria [121624]. Thus, malaria in Dadeldhura is possibly be due to the imported malaria from domestic (migration from Terai to hill region) or international migration particularly from India to Nepal. Due to the poor socio-economic condition, majority of people are migrating to endemic state of Nepal and India for the purpose of their livelihood [222526] and return home in the end of august for celebration of national festival. While they coming back to home they may carry the imported malaria from endemic state and possibly transmitting in family and community. Additionally, the open border system has some link to import malaria from neighboring countries (India), and causing the imbalance fluctuating trends of malaria. These results were supported by other literature, where the imported malaria cases were seen in Dadeldhura district [2627]. Additionally, while returning from India they may imported malarial disease that contributes to the change in epidemiological situation in the district. There was an evidence that 30%-44% cases were imported in Nepal during the period of 2007 to 2013 [1627]. Furthermore, the study observed the trends and patterns of malaria only for 25 districts. These districts were classified as the high-risk districts on the base of annual parasitic rate less than 1 per 1,000 population at risk [9]. Consequently, the trends of malaria were impressively declining over the years. It is due to the substantial contributions in medical technology and public health promotion and education strategy programs on vector born and other public health diseases. Similarly, better implementation of healthy public policy like use of long-lasting insecticidal nets, spraying of insecticides, change the behavior of people, health-seeking behavior, and so on helps to reducing the malaria cases in Nepal. These findings were supported by other numerous literature, where the declining of malaria in Nepal is due to the considerable investment and support from Global Fund to Fight acquired immune deficiency syndrome, tuberculosis, and Malaria, proper malaria awareness program, behavior change communication for used of full cloth and used of insecticidal nets while sleeping were confirmed to decline the malaria cases from last decades [711282930]. However, the patterns of malaria remain as unstable during the study periods. In 2003 to 2015, some districts (Dadeldhura, Kalilali, Banke, Mahottari, and Saptari) revealed the fluctuating patterns of malaria. This may be due to the socioeconomic, environmental, educational, open border system and insecticide resistance in malaria. This is also well documented in the other literature, as the evidence that malaria is still an imbalance in some of the districts from far-western due to low accessible of health facilities, low socioeconomic, low education, imports while they back, and resistance to malaria [615]. P. vivax and P. falciparum are common protozoa responsible for the transmission of malaria disease in Nepal, which are virtually becoming the feared threat of public health in Nepal [2021].
By the districts, out of 25 districts, 17 districts had one malaria cases per 100,000 during the study period. These results corroborate results of the recent study [9] and annual reports for health of Nepal [8] show these districts had lowest malaria cases. Higher malaria cases occurred in five districts, namely, Dadeldhura, Kanchanpur, Kailali, Bardiya, and Jhapa. This difference of malaria cases was possibly due to the social, economic, and behavioral factor. Furthermore, Nepal is agriculture country, the main occupation of Nepalese people is farmer. As by the occupation, most of the people used to work in filed for long time without wearing the full cloth. Such risky behaviors might have a chance of transmission of malaria disease. On the other hand, due to the hottest temperature in Terai region during the monsoon season, majority of people sleep outside the home without using the mosquito net. This sleeping habit is more commonly found in poor counities. So, they are force to sleep out-side the home to during the summer and monsoon season. These activities also create the high chance of transmitting malaria. With this evidence, malaria cases were found difference in 25 districts of Nepal. These findings were consistent with the studies [91015] that listed, aforementioned districts were the malaria endemic districts. Topography, climatic, socioeconomic factors, high migration, and open border system are factors that attributed to the endemicity of malaria in Terai districts of Nepal. Additionally, the Terai region is hot and humid, high precipitation that are associated with high malaria cases. Multiple studies showed that humidity, temperature and rainfall are considered determinants that affect the mosquito life cycle and breeding place [282931]. By these supportive findings the disease is not still in the elimination phase, although, government of set a strategy plan to make the malaria free Nepal by 2026 [717]. Thus it can conclude that the malaria cases still causing the public health threat particularly in children, farmer and the lactating mother of Terai region.
This study investigates the patterns and trends of malaria in 25 districts of Nepal. It was found that malaria in Nepal still causing public health problem among the survey districts. Hence, at the district level and also at community level there should be urgent need of malaria control program by providing the antimalarial medicines and vaccine. Meanwhile, the malaria vaccine will be a potential intervention program for malaria if it integrated with National immunization schedules of Nepal. Therefore, these findings highlight the risk districts which are needed the malaria elimination at the national, regional, district, municipalities and rural-municipality's levels. This policy will be beneficial for exploring intervention program with targeting to make the malaria-free Nepal by the end of 2026.
There were a few limitations in the study as it was based on secondary data. In addition, various seasonal or months and environmental factors which are considered the risk for malaria due to unavailability of data, we were not included monthly specific data of malaria and temperature.
 XML Download