Journal List > Clin Exp Vaccine Res > v.8(1) > 1115918

Choi, Huh, Han, Ahn, Kang, Kim, Choi, Kim, and Kang: Enzyme-linked immunosorbent assay for detecting anti-pertussis toxin antibody in mouse

Abstract

Purpose

Although the DTaP and Tdap vaccines used to prevent pertussis have been used for a long time, there is no standard method for measuring pertussis antigens. Therefore, this preliminary study was conducted to develop an enzyme-linked immunosorbent assay method using an animal model for measuring antibodies against pertussis toxin, the most important pertussis pathogenic antigen, in the sera of vaccinated mice.

Materials and Methods

Bordetella pertussis Tohama phase I was cultured for 24–30 hours, and then pertussis toxin was purified from the culture medium by chromatography. Purified pertussis toxin was diluted in phosphate-buffered saline-coating buffer, and 100 µL of diluted pertussis toxin was added to each well and reacted at room temperature for 4 hours. Positive serum was diluted to 1/1,250–1/80,000 and negative serum was diluted to 1/50 to determine the coating concentration with the optimal signal/noise ratio. Optimal test conditions were confirmed from the dilution factors of the secondary antibody and streptavidin horseradish peroxidase (SA-HRP).

Results

Optimal conditions were as follows: 4 µg/mL for coating antigen; 1/40,000 for secondary antibody; and 1/1,000 for the SA-HRP dilution factor. Comparison of the sera obtained from mice treated with a developing vaccine and commercial vaccine with National Institute for Biological Standard and Control standard serum under the established conditions showed the following results: 1,300.62, 534.94, and 34.85, respectively.

Conclusion

The method developed in this study is suitable for measuring anti-pertussis toxin antibodies and may be applicable for clinical sample analysis or indirect diagnosis of pertussis.

Introduction

A whole cell pertussis vaccine (wP) was developed in the 1950s. However, the use of wP is associated with safety issues such as systemic adverse effects. To address these issues, an acellular pertussis (aP) vaccine was first commercialized in Japan in 1981, and aP vaccines were developed by United States and European vaccine manufacturers. aP vaccines were introduced worldwide in the 1990s [1].
In Korea, legislation for the vaccination of diphtheria-tetanus-pertussis vaccine was established in 1954, and the diphtheria, tetanus toxoids, whole-cell pertussis (DTwP) vaccine was used for vaccination until the early 1980s. A two-pertussis antigen (pertussis toxoid [PT] and filamentous hemagglutinin [FHA])-containing diphtheria and tetanus toxoids and acellular pertussis (DTaP) vaccine, which was developed in Japan, was introduced and used in Korea [2]. In the late 1990s, a three-component DTaP vaccine containing PT, FHA, and pertactin was introduced in Korea. The DTaP vaccine has been used for vaccination for 30 years; in the early 2000s, a reduced pertussis-diphtheria antigen and tetanus vaccine (Tdap) for adults was introduced and included in basic vaccination. However, no standard method for measuring pertussis antigen has been established [34]. Therefore, in the absence of an officially recognized pertussis standard antigen and standard serum, this preliminary study for standardization was conducted to measure antibodies against the major pathogenic pertussis toxin antigen in vaccinated mice. We also established a basic method for measuring pertussis antigens by developing an enzyme-linked immunosorbent assay (ELISA) method for animal models which was compared with an existing animal ELISA kit.

Materials and Methods

Antigen preparation

Antigens for ELISA were prepared using the Bordetella pertussis Tohama phase I strain at GC Pharma (Yongin, Korea). The B. pertussis strains were cultured in modified Stainer Scholte medium for 24–30 hours and then used for antigen purification. After cell culture, the culture supernatant and cells were separated using a continuous centrifuge. The PT and FHA antigens were purified from the culture supernatant by hydroxyapatite chromatography, hydrophobic interaction chromatography, affinity chromatography, and membrane chromatography. The cells were degraded using 5 M urea solution and subjected to centrifugation (8,000×g, Allegra X12 centrifuge, Beckman, Brea, CA, USA) to remove cell debris. Next, pertactin was purified by anion exchange chromatography, hydrophobic chromatography, and gel filtration chromatography. Each antigen was detoxified using glutaraldehyde and formaldehyde and used as the vaccine antigen. The purified antigens were used as coating antigens for ELISA.

ELISA

Antigen coating

The purified PT antigen was diluted in phosphate-buffered saline (PBS) coating buffer to a concentration of 4 µg/mL, and 100 µL of the diluted antigen was added to each well and reacted for 4 hours at room temperature. After the reaction, the plate was flipped over to remove the solution. The wells were washed four times with washing buffer (PBS buffer containing 0.05% Tween 20). For blocking, 200 µL of blocking buffer (1% bovine serum albumin in PBS) was added to each well and reacted for 1 hour at room temperature. After the reaction, the blocking buffer was discarded, and the remaining solution was completely removed. Next, the wells were washed four times with washing buffer. The remaining solution was completely removed, and silica gel was added to the wells. The wells were sealed and stored in a refrigerator.
  • (1) Dilution of reference standard (National Institute for Biological Standard and Control [NIBSC] standard serum).

  • (2) NIBSC 97/642 obtained from the NIBSC (UK) was serially diluted with casein buffer (37528, Thermo Fisher Scientific, Waltham, MA, USA) from 3.4 to 0.001 ELISA unit (EU)/mL.

  • (3) Dilution of quality control sample.

  • (4) To verify the system suitability, reference standards were diluted to concentrations of 0.027, 0.013, and 0.003 EU/mL and used as high-, middle-, and low-quality control samples, respectively.

  • (5) Dilution of conjugate and streptavidin horseradish peroxidase (SA-HRP).

  • (6) Conjugate (31800, biotin-labeled anti-mouse IgG antibody, Thermo Fisher Scientific) was diluted by 200-fold with PBS and then diluted by 200-fold with casein buffer. Secondary antibody and SA-HRP was diluted by 1,000-fold with 1% bovine serum albumin in PBS.

  • (7) Dilution of samples.

  • (8) The samples were diluted by 10-fold (P) with PBS and then diluted by 10-fold with casein buffer (P1). Next, P1 was serially diluted in multiples of two.

  • (9) Dilution of reference standards.

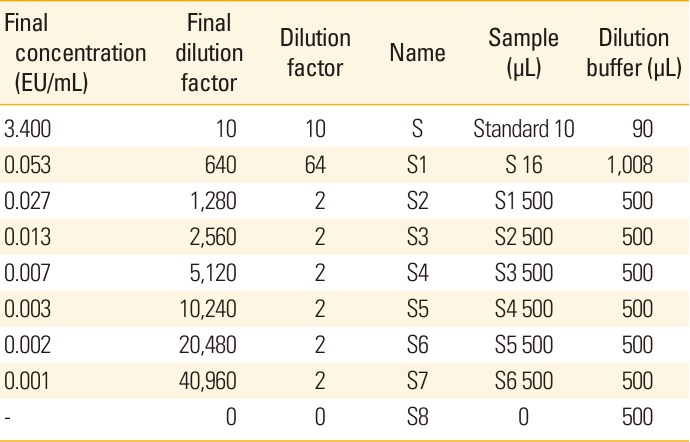
  • (10) The NIBSC reference standard was diluted by 10-fold with PBS and then diluted stepwise, as shown in Table 1.

Measurement method

NIBSC reference standards (S1–S8), quality control (QC) samples (high-range quality control sample [HQC], middle-range quality control sample [MQC], and low-range quality control sample [LQC]), and samples (P1−Pn+1) diluted to a specific concentration were added to the wells. The wells were reacted by shaking at 37℃ for 90±5 minutes and washed four times with washing buffer. Next, 100 µL of biotin-labeled anti-mouse antibody was added to each well and reacted by shaking at 37℃ for 60±5 minutes. After the reaction, the wells were washed four times with washing buffer. Next, 100 µL of the pre-prepared SA-HRP solution was added to each well and reacted by shaking at 37℃ for 45±2 minutes. After washing four times with washing buffer, 100 µL of TMB solution was added to each well and reacted at room temperature for 15 minutes. To stop the reaction, 100 µL of stop solution (1.6 N H2SO4 sol.) was added. The wavelength of the ELISA reader was adjusted to 450 nm and absorbance was measured.

Calculation of results

Based on the absorbance results of the reference standard, a standard curve was drawn by a 4-parameter model provided by the Softmax program (Softmax Pro v5.0, Molecular Devices, Sunnyvale, CA, USA) (y=(A−D)/[1+(X/C)B]+D). A QC sample with an optical density (OD) value equal to or lower than the OD value of the HQC and equal to or greater than the OD value of the LQC was selected. The OD value of the selected sample was substituted into the standard equation to determine the concentration. The calculated concentration was multiplied by the dilution factor, and the average value was obtained. This average value was defined as the amount of anti-PT antibody.

Acceptance criteria

The system suitability conditions were as follows. The OD value of the S8 (NIBSC reference standard diluent) should be 0.2 or less, the R2 value of the standard curve should be at least 0.99 and 67% of the QC samples should have a coefficient of variation (%CV) value of 20% or less. When these conditions were satisfied, re-testing was performed.

Results

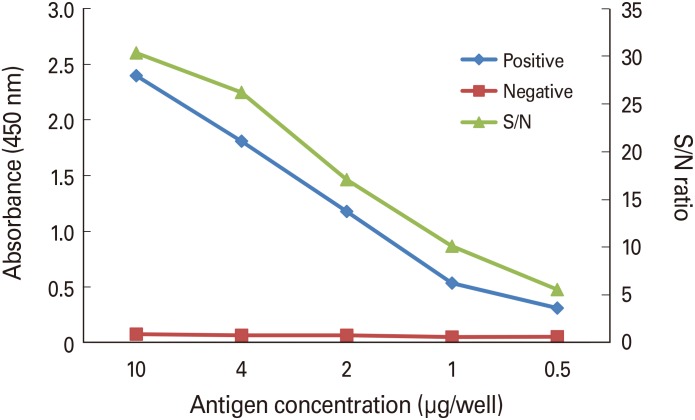
Determination of optimal PT coating concentration

The antigens used for microplate well coating were diluted to 0.5–10 g, and 100 µL of the antigens was aliquoted into each well and coated at room temperature for 4 hours. The positive serum was diluted to 1/1,250–1/80,000 by 2-fold dilution. Negative serum was diluted 1/50 to reduce the effect of the proteins in the serum on the absorbance. As shown in Fig. 1, the OD of the positive serum tended to decrease as the concentration of the coating antigen decreased. In contrast, the OD of the negative serum was 0.05–0.08, which was significantly lower than that of the positive serum and gradually decreased in proportion to the antigen concentration. The OD ratio (signal to noise [S/N] ratio) of the positive and negative serum tended to decrease with increasing dilution factors. Considering the OD value and S/N ratio, the purified antigen was diluted to 4 µg/mL, and 100 µL of the purified antigens used to coat each well.

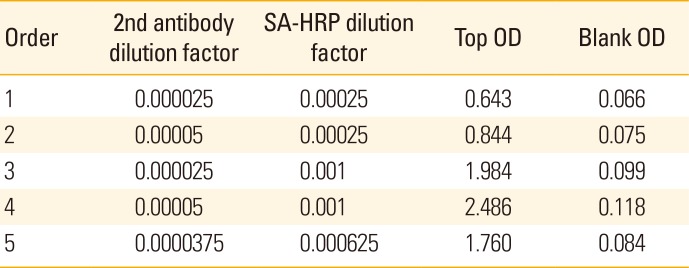
Selection of optimal conditions of conjugate and SA-HRP dilution factor

The experiment was designed and performed using the design of experiment program to select the optimal dilution factor and combination conditions of the conjugate (31800, biotin-labeled goat anti-mouse antibody, Thermo Fisher Scientific) and SA-HRP. The results are shown in Table 2. The top OD value of the SA-HRP was significant, while that of the conjugate was not (SA-HRP, p=0.018). Additionally, the blank OD value of SA-HRP was significant, while that of the conjugate was not (SA-HRP, p=0.017).
The optimal conditions were determined using the optimization tool provided by the design of experiment program (Minitab ver. 15). As a result, the optimal point where the top OD reached the maximum value and blank OD was 0.15 or less was observed when the dilution factor of the conjugate was 1/40,000 and dilution factor of the SA-HRP was 1/1,000.

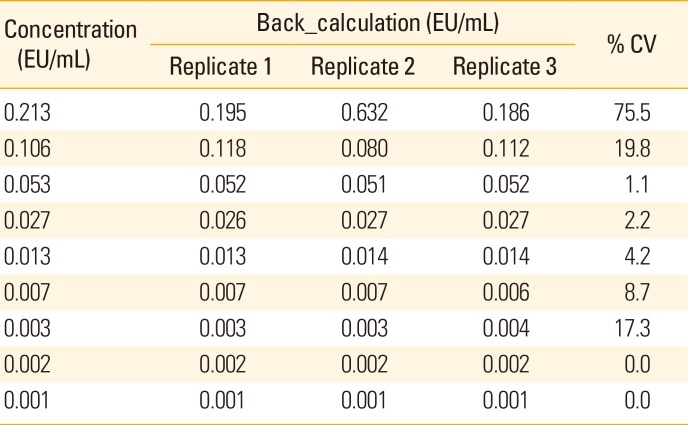
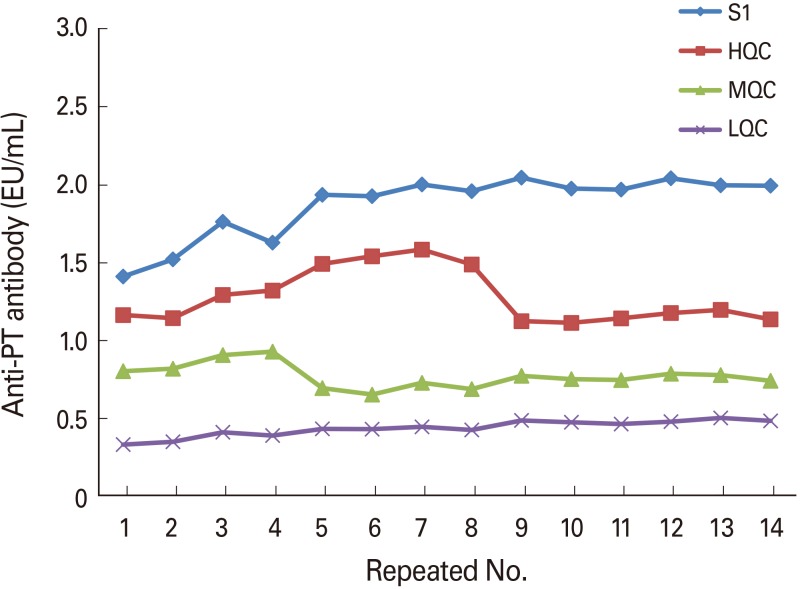
Determination of quantitative range
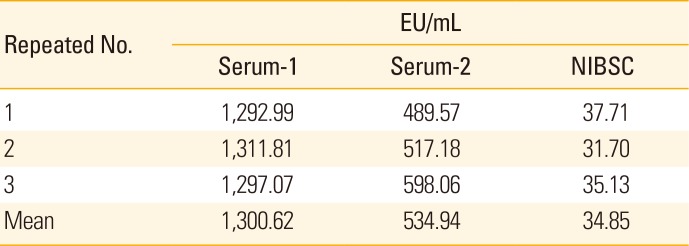
NIBSC mouse serum was used under the optimal conditions as described above to determine the quantitative range. The experiment was repeated three times with NIBSC mouse serum to determine the interval over which the R2 value was 0.99 or more, accuracy of the back_calculation value was within ±20%, and precision (%CV) was within 20%. As a result, the optimal quantitative range was 0.002–0.053 EU/mL for the antibody concentration (Table 3). The R2 values for each experiment were 1.000, 0.997, and 0.999, respectively, showing a very high correlation.

Anti-PT antibody measurement test

The anti-PT antibody content in the quantitative range determined above was measured. As a result of the three measurements, the sera of mice vaccinated with a developing vaccine showed an average anti-PT antibody of 1,300.62 EU/mL, the sera of mice vaccinated with a commercial vaccine showed an average anti-PT antibody of 534.94 EU/mL, and NIBSC serum showed an average anti-PT antibody of 34.85 EU/mL. The antibody level may vary depending on the antigen level, antigen purification method, and immunization method [5]. The CV% values of the three mouse sera were within 20%. The NIBSC showed a p-value of 0.140 as a result of indicated titer (39 EU/mL) and 1 sample t test, which was greater than a significance level of 0.05, revealing no significance. Therefore, anti-PT antibodies can be measured using the developed method (Table 4).

OD value setting of QC samples for system suitability evaluation

If the OD value of the standard is too high or low, the linearity of the graph may affect the measurement of the antibody titer. Therefore, it was necessary to set the OD reference value. For this, the results of 14 pre-validation and 14 technology transfer tests were analyzed using SA-HRP from the same lot. The mean and standard deviation (SD) values of the NIBSC standard sample, HQC, MQC, and LQC were calculated, and the range was set to a mean value±3SD. The set OD reference value range was 1.376–2.372 for NIBSC standard, 0.832–1.954 for HQC, 0.354–1.524 for MQC, and 0.279–0.651 for LQC (Fig. 2).

Discussion

Pertussis antibodies have been measured by numerous researchers to evaluate the efficacy of a vaccine or study antibody production following bacterial infection. Particularly, numerous ELISA antibody detection methods have been developed because of their high sensitivity for antigen detection and high specificity for the antigen [678]. ELISAs are useful for evaluating vaccine quality and for diagnosing infections [910]. Internationally, studies have been conducted to measure the potency of vaccines by standardizing the ELISAs. However, there is no unified method because there are many deviations between labs and no standardized antigen is available. Because the NIBSC, which distributes World Health Organization standards, only supplies standard serum and provides only reference materials for antigens or antibodies, each vaccine manufacturer or research institute should establish methods for measuring antibodies autonomously. According to a study comparing internationally recognized NIBSC 97/642 and U.S. lot 1, the variance between tests was 15% in the anti-PT antibody measurement, while the variance between laboratories was very high (40%). The relative ratio of the two samples was 0.11–0.30 [411].
In recent years, pertussis has been emerging again globally, and Korea is experiencing frequent local epidemics [12]. Therefore, it is necessary to develop an accurate and rapid diagnosis method. The combination of real-time polymerase chain reaction, which can detect the presence of bacteria, and ELISA, which can detect serum antibodies produced by infection, is useful for monitoring pertussis communicable disease. The ELISA developed in this study can be used to analyze sera obtained from vaccinated mice to evaluate vaccine quality. Moreover, ELISA can be applied to analyze antibodies against pertussis toxin in human serum by simply changing the dilution factor of the sample.

Notes

This work was supported by GC Pharma (Yongin, Republic of Korea, grant No. 5-2017-D0083-0002).

This work was supported by Korea Ministry of Food and Drug Safety (grant No. 16172MFDS269, MFDS2016-21962).

References

1. Lee JH, Ha YH, Han JW, Lee WB, Lee KS. Pertussis antibodies in the sera of children after acellular pertussis vaccination. J Korean Pediatr Soc. 1997; 40:167–172.
2. Kwon HJ, Han SB, Kim BR, et al. Assessment of safety and efficacy against Bordetella pertussis of a new tetanus-reduced dose diphtheria-acellular pertussis vaccine in a murine model. BMC Infect Dis. 2017; 17:247. PMID: 28376777.
crossref
3. Choi UY, Lee SY, Kwak GY, et al. Immunogenicity and safety of primary and secondary DTaP booster vaccination. J Korean Med Assoc. 2011; 54:979–987.
crossref
4. Gaines Das R, Xing D, Rigsby P, Newland P, Corbel M. International collaborative study: evaluation of proposed International Reference Reagent of pertussis antiserum (mouse) 97/642. Biologicals. 2001; 29:137–148. PMID: 11580218.
crossref
5. Dalby T, Petersen JW, Harboe ZB, Krogfelt KA. Antibody responses to pertussis toxin display different kinetics after clinical Bordetella pertussis infection than after vaccination with an acellular pertussis vaccine. J Med Microbiol. 2010; 59(Pt 9):1029–1036. PMID: 20508003.
crossref
6. Friedman RL, Paulaitis S, McMillan JW. Development of a rapid diagnostic test for pertussis: direct detection of pertussis toxin in respiratory secretions. J Clin Microbiol. 1989; 27:2466–2470. PMID: 2808670.
crossref
7. Sato H, Sato Y. Bordetella pertussis infection in mice: correlation of specific antibodies against two antigens, pertussis toxin, and filamentous hemagglutinin with mouse protectivity in an intracerebral or aerosol challenge system. Infect Immun. 1984; 46:415–421. PMID: 6542069.
crossref
8. Redhead K, Watkins J, Barnard A, Mills KH. Effective immunization against Bordetella pertussis respiratory infection in mice is dependent on induction of cell-mediated immunity. Infect Immun. 1993; 61:3190–3198. PMID: 8335349.
crossref
9. Gates I, DuVall M, Ju H, Tondella ML, Pawloski L. Pertussis Working Group. Development of a qualitative assay for screening of Bordetella pertussis isolates for pertussis toxin production. PLoS One. 2017; 12:e0175326. PMID: 28394915.
crossref
10. Menzies SL, Kadwad V, Pawloski LC, et al. Development and analytical validation of an immunoassay for quantifying serum anti-pertussis toxin antibodies resulting from Bordetella pertussis infection. Clin Vaccine Immunol. 2009; 16:1781–1788. PMID: 19864485.
11. Poirier B, Bornstein N, Andre M, et al. Collaborative study for the establishment of a European Phamacopoeia Biological reference preparation for Bordetella pertussis mouse antiserum for serological potency testing of acellular pertussis vaccines. Biologicals. 2003; 31:25–38. PMID: 12623057.
crossref
12. Moriuchi T, Otsuka N, Hiramatsu Y, Shibayama K, Kamachi K. A high seroprevalence of antibodies to pertussis toxin among Japanese adults: qualitative and quantitative analyses. PLoS One. 2017; 12:e0181181. PMID: 28700751.
crossref
Fig. 1

Determination of optimal antigen concentration. Dilution of positive serum was 1:80,000. Positive, National Institute for Biological Standard and Control serum; Negative, normal mouse serum; S/N, signal to noise.

cevr-8-64-g001
Fig. 2

Pre-validation of QC samples to determine proper optical range. QC, quality control; PT, pertussis toxoid; HQC, high-range quality control sample; MQC, middle-range quality control sample; LQC, low-range quality control sample.

cevr-8-64-g002
Table 1

Dilution method for NIBSC standard

cevr-8-64-i001
Final concentration (EU/mL) Final dilution factor Dilution factor Name Sample (µL) Dilution buffer (µL)
3.400 10 10 S Standard 10 90
0.053 640 64 S1 S 16 1,008
0.027 1,280 2 S2 S1 500 500
0.013 2,560 2 S3 S2 500 500
0.007 5,120 2 S4 S3 500 500
0.003 10,240 2 S5 S4 500 500
0.002 20,480 2 S6 S5 500 500
0.001 40,960 2 S7 S6 500 500
- 0 0 S8 0 500

NIBSC, National Institute for Biological Standard and Control; EU, enzyme-linked immunosorbent assay unit.

Table 2

Determination of proper dilution factors between secondary antibody and SA-HRP

cevr-8-64-i002
Order 2nd antibody dilution factor SA-HRP dilution factor Top OD Blank OD
1 0.000025 0.00025 0.643 0.066
2 0.00005 0.00025 0.844 0.075
3 0.000025 0.001 1.984 0.099
4 0.00005 0.001 2.486 0.118
5 0.0000375 0.000625 1.760 0.084

SA-HRP, streptavidin horseradish peroxidase; OD, optical density.

Table 3

Result of repeated experiments to determine a quantitative range

cevr-8-64-i003
Concentration (EU/mL) Back_calculation (EU/mL) % CV
Replicate 1 Replicate 2 Replicate 3
0.213 0.195 0.632 0.186 75.5
0.106 0.118 0.080 0.112 19.8
0.053 0.052 0.051 0.052 1.1
0.027 0.026 0.027 0.027 2.2
0.013 0.013 0.014 0.014 4.2
0.007 0.007 0.007 0.006 8.7
0.003 0.003 0.003 0.004 17.3
0.002 0.002 0.002 0.002 0.0
0.001 0.001 0.001 0.001 0.0

EU, enzyme-linked immunosorbent assay unit; CV, coefficient of variation.

Table 4

Results of anti-PT antibody from three kinds of mouse serum

cevr-8-64-i004
Repeated No. EU/mL
Serum-1 Serum-2 NIBSC
1 1,292.99 489.57 37.71
2 1,311.81 517.18 31.70
3 1,297.07 598.06 35.13
Mean 1,300.62 534.94 34.85

Serum-1 was obtained from the developing vaccine immunized mice and serum-2 was obtained from the commercial vaccine immunized mice. NIBSC was the control serum.

PT, pertussis toxoid; EU, enzyme-linked immunosorbent assay unit; NIBSC, National Institute for Biological Standard and Control.

TOOLS
Similar articles