

 PDF
PDF ePub
ePub Citation
 Print
Print


INTRODUCTION
Within the aging process, an increase in body fat mass and a gradual decrease in muscle mass may cause changes in body composition, which may have a negative effect on the health of the elderly [12]. As the elderly portion of the population is increasing rapidly, such changes in body composition can be a source of major health problems in the elderly [3].
Sarcopenia is defined as a loss of muscle mass and muscle strength with age [4]. Typically, the body has the highest muscle mass at 30 years of age. The muscle mass begins to decrease gradually from 40 years of age onward with muscle loss accelerating with age [5].
Recently, a remarkable increase in morbidity of obese elderly subjects in western countries has been reported [67]. According to the results from the 2011–2012 U.S. national health and nutrition examination survey, more than a third of Americans aged 60 years and over are obese [8]. A similar trend has been detected in South Korea with the prevalence of obesity among the elderly increasing from 38.9% in 2010 to 46% in 2015 [9].
The physiological changes associated with age-related muscle mass loss and body fat gain, have recently been described as part of an overall medical condition known as sarcopenic obesity [10]. Some studies have indicated that sarcopenic obesity in the elderly may not only increase the incidence of cardiovascular diseases [11] and diabetes [12], but also have an adverse influence on the state of inflammation in the body [13]; it may even increase mortality [14]. In other studies, the risk of morbidity was much higher in subjects exhibiting both obesity and sarcopenia than in subjects with only one of those conditions [15].
Previous studies have reported that sarcopenic obesity can be prevented by actively participating in physical activities [16], increasing muscle movement [17], having an adequate protein intake [18], and consuming foods that incorporate antioxidant nutrients [19].
In the present study, data obtained from the nationally representative 2008–2011 Korea National Health and Nutrition Examination Survey (KNHANES) were analyzed to determine if the factors associated with exercise and nutrition are related to the presence of sarcopenic obesity among the elderly in South Korea.
SUBJECTS AND METHODS
Study subjects
The target subjects in the present study were people aged 65 years and older who participated in the 4th and 5th KNHANES (2008–2011). KNHANES is a survey initiated in 1995 and was initially conducted every three years until it was changed to an annual survey system from the 4th period onward. KNHANES was designed to provide useful data on the health and nutritional status of people in South Korea.
The subjects in the present study completed the KNHANES diagnostic surveys regarding their bone density and body fat, which are required to calculate the muscle mass. The number of potential participants was 6370; however, 3003 of those were excluded from participation because they did not provide dual-energy X-ray absorptiometry (DXA), dietary intake, or blood biochemical data. Therefore, the data obtained from 3,367 subjects were included in this study. The institutional Review Board (IRB) of the Korea Center for Disease Control and Prevention approved the KNHANES (IRB. 2008-04EXP-01-C, 2009-01CON-03-2C, and 2011-02CON-06-C). In addition, this study was conducted with approval from the IRB of Yeungnam University (IRB 2018-04-012).
Assessment of sarcopenia and obesity
The standard described by Lim et al. [20] was used to diagnose sarcopenia in this study. The appendicular skeletal muscle mass (ASM) was calculated by subtracting the weight of bone and fat from the weight of the limbs based on the DXA results. After converting the ASM (kg) to ASM/body weight × 100, the subjects were diagnosed as being sarcopenic when their ASM estimate was less than one standard deviation below the gender-specific mean ASM for healthy young adults. Obesity was defined as the presence of a waist circumference > 90 cm for men or > 85 cm for women subjects and was based on the obesity assessment of the Korean Society for the Study of Obesity (2012) [21].
All subjects were then divided into two obesity-based groups: non-obese and obese. The two groups were divided further into a non-sarcopenia group and sarcopenia group.
Blood biochemical parameters of the subjects
The total cholesterol, triglyceride, HDL-cholesterol, LDL-cholesterol, fasting plasma glucose, glycated hemoglobin (HbA1c), homeostatic model assessment for insulin resistance (HOMA-IR), vitamin D, and parathyroid hormone were used to assess status of the blood biochemical parameters in the subjects. The total cholesterol, triglyceride, HDL-cholesterol, LDL-cholesterol, and fasting plasma glucose were measured using an automatic analyzer (AVIDA 1650, Bayer, New York, USA). HbA1c was measured by high-performance liquid chromatography (Tosoh G8, Tokyo, Japan).
Assessment of physical activity participation
The parameters related to physical activity of the subjects included vigorous physical activity, moderate physical activity, and walking. Vigorous physical activity of the subjects was reported if they answered ever having exercised vigorously for more than 10 minutes per session, 20 minutes per day, and 3 days per week. Moderate physical activity and walking practice rate of the subjects were reported if they answered ever having exercised moderately or having walked more than 10 minutes per session, 30 minutes per day, and 5 days per week, respectively. Considering that the subjects were elderly, the physical activity participation rate was analyzed by classifying the subjects into two groups of vigorous physical activity and moderate physical activity participation or not. The walking participation rate was reported after dividing into quartiles according to the levels, such as low, mid-low, mid-high, and high. The range of values for each walking quartile was as follows [22]: for men, low, mid-low, mid-high, and high were 0–19 minutes, 20–59 minutes, 60–119 minutes, and ≥ 120 minutes, respectively; and for women, the values were 0–9 minutes, 10–29 minutes, 30–59 minutes, and ≥ 60 minutes, respectively. The metabolic equivalent task (MET) was calculated using the parameters of vigorous physical activity, moderate physical activity, and walking as follows: MET (min/week) = {days of vigorous physical activity /week × minutes of vigorous physical activity/day × 8} + {days of moderate physical activity/week × minutes of moderate physical activity/day × 4} + {days of walking/week ×minutes of walking/day × 3.3}. The odds ratio of sarcopenic obesity according to physical activity level was analyzed by MET quartile.
Measurement of the dietary intake
The dietary intake data of the subjects from a 24-h recall method were analyzed to estimate the energy and nutrient intakes. The dietary intake survey was conducted in a way that people trained by regular education have interviews with the subjects. The odds ratio of sarcopenic obesity according to the nutrient intake level or recommended nutrient intake was analyzed by the nutrient intake quartile or assessing the risk of the subjects who did not meet the recommended nutrient intake, respectively.
Statistical Analysis
All analyses were extracted by stratified cluster sampling, and the standard plots and weights were used so that the data used in this study would represent the Korean people using the data analysis method of complex sampling. To compare the general characteristics of the sarcopenia and non-sarcopenia groups, chi-squares and Student's t-tests were used to analyze the categorical variables and continuous variables, respectively. The results are presented as the mean±SD. The continuous variables of the four groups were analyzed by ANOVA and a least significance difference (LSD) post hoc comparison. In addition, the odds ratio of the sarcopenic obesity risk was analyzed using multiple logistic regression models. All statistical tests were performed using IBM SPSS Statistics (ver. 22.0; IBM Co., Armonk, NY, USA). Statistical significance was considered at P < 0.05.
RESULTS
General and physical characteristics of the subjects
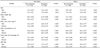
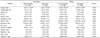
The subjects were divided into four groups: obese, sarcopenic obese, non-obese, and sarcopenic non-obese. Table 1 lists the general characteristics and physical measurements of each group. The average age of the non-obese sarcopenic men was 72.5 ± 0.42 years, which was significantly higher than that of the non-obese men without sarcopenia (P = 0.021). The average ages of the obese and sarcopenic obese men were 70.7 ± 0.41 years and 71.9 ± 0.37 years, respectively. Similar to the results in the non-obese men groups, the average age of the sarcopenic obese men was significantly higher than that of the obese-only men. Likewise, for female subjects, the age of the sarcopenic obese women was significantly higher than that in the obesity-only group (P = 0.035). The average age of the sarcopenia group was significantly lower than that of the non-sarcopenia group in non-obese women (P = 0.014).
With regard to the body fat percentages among the male subjects, the sarcopenia group had significantly higher percentages than the non-sarcopenia group, regardless of the obesity status (P < 0.001). The body fat percentage in the obesity-only men was 23.2 ± 0.28%, which was significantly lower than that of the sarcopenic obese men (28.6 ± 0.27%; < 0.001). Among the female subjects, the body fat percentage of the non-obese sarcopenia group was 37.9 ± 0.32%, which was significantly higher than that of the non-obese women without sarcopenia (30.0 ± 0.25%; P < 0.001). Among the obese women, the body fat percentage was significantly higher in the sarcopenic group (39.8 ± 0.19%) than in the non-sarcopenic group (34.4 ± 0.22%; P < 0.001). Regardless of gender, the body fat percentage was highest in the sarcopenic obese group (P < 0.001). ASM was significantly lower in the sarcopenia group than in the non-sarcopenia group according to gender and obese status (P < 0.001).
Blood biochemical parameters of the subjects
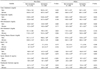
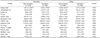
Table 2 lists the results of blood biochemical analyses. The blood triglyceride level of the men was significantly higher in the sarcopenic obese group (170.9 ± 8.31 mg/dL) than in the obese-only group (P = 0.035). The triglyceride level was 154.8 ± 8.23 mg/dL among the men in the non-obese sarcopenia group, which was significantly higher than the 130.0 ± 4.78 mg/dL measured in the non-obese men without sarcopenia (P = 0.007). Based on post hoc analysis, the blood triglyceride level was highest in the sarcopenic obese men (P < 0.001). The triglyceride levels were similar in the obese women groups.
Among the men, the concentration of HDL-C was 40.6 ± 0.66 mg/dL in the sarcopenic obese group, which was significantly lower than that in the obese-only group (43.4 ± 1.09 mg/dL; P = 0.040). Among the non-obese men, there was a significant difference between those with sarcopenia (43.8 ± 0.96 mg/dL) and those without (46.8 ± 0.45 mg/dL; P = 0.003). The HDL-C level was lower in the sarcopenic obese men than in the non-sarcopenic obese men (P = 0.040). The HDL-cholesterol levels were similar in the female groups.
The fasting plasma glucose level in the non-obese male subjects was significantly lower in the non-sarcopenia group (101 ± 1.13 mg/dL) than in the sarcopenia group (108.6 ± 1.84 mg/dL; P = 0.001). Among the non-obese men, HOMA-IR was significantly lower in the non-sarcopenia group (36.9 ± 1.02) than in the sarcopenia group (47.3 ± 2.25; P < 0.001). Among the obese men, the HOMA-IR level was significantly lower in the obese-only group (53.2 ± 3.35) than in the sarcopenic obese group (64.0 ± 3.15; P = 0.020). Among all male groups, the insulin resistance level was highest in the sarcopenic obese group followed in order by the obese non-sarcopenia group, non-obese sarcopenia group, and non-obese non-sarcopenia group (P < 0.001; Table 1). The HOMA-IR levels were similar in the female groups.
The blood vitamin D level in the non-obese men was significantly higher in the non-sarcopenia group (22.3 ± 0.45 ng/mL) than in the sarcopenia group (19.6 ± 0.53 ng/mL; P < 0.001). Similarly, among the obese men, there was a significantly higher vitamin D level in the non-sarcopenic group (23.0 ± 1.07 ng/mL) than in the sarcopenic group (19.7 ± 0.51 ng/mL; P = 0.002). Among the obese women, the vitamin D level was significantly lower in the sarcopenic group than in the non-sarcopenic group (P < 0.001).
The parathyroid hormone level of the obese men was 72.0 ± 1.95 pg/mL in the sarcopenic group, which was significantly higher than that in the non-sarcopenic group (63.1 ± 3.53 pg/dL; P = 0.023). Among the non-obese men, the sarcopenia group had a significantly higher level of parathyroid hormone than the non-sarcopenia group (P = 0.010). In the female subjects, the parathyroid hormone level was higher in the sarcopenic obese group (80.8 ± 2.25 pg/mL) than in the obese group without sarcopenia (72.1 ± 1.94 pg/mL; P = 0.003).
Physical activity participation rate of the subjects
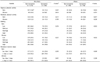
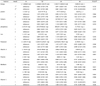
Table 3 lists pysical activity participation rates among the four obesity/sarcopenia groups. The rate of participation in vigorous physical activity among the obese men was 10.2% in the sarcopenia group and significantly higher (20.4%; P = 0.023) in the non-sarcopenia group. Among the obese women, the rate of participation in moderate physical activity in the non-sarcopenia group (14.3%) was significantly higher than that in the sarcopenia group (8.0%; P = 0.028). In addition, in the obese women, there was significant difference in the participation in walking between the sarcopenia and non-sarcopenia groups (P = 0.032). The rates of participation in resistance exercise were similar in all groups of both sexes.
Physical activity level of the subjects
The physical activity levels of each group of subjects were divided into quartiles based on the metabolic equivalent of a task (MET) measured in minutes per week (MET-min/week): low, mid-low, mid-high, and high, as summarized in Table 4. Significant differences in MET levels in both the non-obese and obese men were observed between the sarcopenia and non-sarcopenia groups (P = 0.011, P < 0.001, respectively). Despite the trend toward a difference between the non-sarcopenia and sarcopenia groups (p = 0.065) of obese women, the difference was not significant.
Odds ratio of sarcopenic obesity according to the physical activity level of the subjects
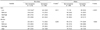
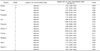
Table 5 lists the results of the OR-based analysis of sarcopenic obesity by physical activity level. The subjects were divided into quartiles (Q1, Q2, Q3, and Q4) based on their level of MET-min/week. The data were adjusted for age (model 1) and for age, smoking, and alcohol consumption (model 2). Among the men, the risk of sarcopenic obesity was significantly lower in the highest physical activity level (Q4) than that in the lowest group (Q1) in both models (P for trend = 0.014 and 0.018, respectively). In women, the risk of sarcopenic obesity was significantly lower in the Q4 group than in the Q1 group for both models 1 (OR = 0.432, 95% CI = 0.281–0.665, P for trend < 0.001) and 2 (OR = 0.433, 95% CI = 0.281–0.668, P for trend < 0.001).
Assessment of the nutrient intake status and sarcopenic obesity risk of the subjects according to the nutrient intake level
Table 6 and 7 summarize mean daily energy intake and nutrient intake adjusted for energy intake of the subjects. For men, the energy and vitamin A intakes were significantly different among the groups (P = 0.006). The energy intake of the non-obese and obese groups was significantly high in the non-sarcopenia group than the sarcopenia group. The energy intake of women was significantly higher in the non-sarcopenia obese group than the sarcopenia obese group. A significant difference in the carbohydrate, protein, fat, phosphorus, niacin, and vitamin C intakes of the women was observed among the groups.
Table 8 lists the odds ratio results of sarcopenic obesity according to the nutrient intake quartile. The energy intake results from model 2 (adjusted for gender, age, smoking, alcohol drinking, physical activity, and energy intake) showed that the risk of sarcopenic obesity was 27.5% lower in Q4 than in Q1 (OR = 0.725, 95% CI = 0.529–0.993), but the risk reduction with increasing energy intake was not statistically significant (P for trend = 0.197). Regarding riboflavin, the risk of sarcopenic obesity was significantly lower in model 1 adjusted for gender and age (P trend = 0.021), whereas model 2 only showed a trend to a lower risk (P for trend = 0.050). In addition, the risk of sarcopenic obesity was 26.9% lower in the highest vitamin C quartile (Q4) than in Q1 in model 1 (OR = 0.731, 95% CI = 0.539–0.991, P for trend = 0.024), whereas in model 2, there was only a trend toward a decreased risk of sarcopenic obesity (P for trend = 0.038).
Table 9 lists odds ratio of the sarcopenic obesity risk according to the recommended nutrient intake level. For model 1, the risk of sarcopenic obesity was 25.4% higher in the subjects not meeting the recommended total energy intake than in those meeting the recommended intake level (OR 1.254, 95% CI = 1.006–1.564; P = 0.044). The model 1 result for riboflavin showed that the risk of sarcopenic obesity increased by 36.6% in the subjects not meeting the recommended riboflavin intake than the subjects meeting that level (95% CI = 1.012–1.843; P = 0.041). For the models 1 and 2 results, there were significantly higher risks of sarcopenic obesity (32.6% increase; 95% CI = 1.054–1.666; P = 0.016 and 30.2% increase; 95% CI = 1.032–1.642; P = 0.026, respectively) in the subjects not meeting the recommended vitamin C intake than in those meeting the level.
DISCUSSION
In this study, data from the nationally representative KNHANES (2008–2011) were used to determine if physical activity and dietary intake can be associated with sarcopenic obesity among the elderly in South Korea. The results showed that a reduction of the sarcopenic obesity risk was associated with active participation in a physical activity and adequate intake of nutrients.
A subject's participation in physical activities, such as vigorous physical activity, moderate physical activity, and walking, was calculated as the MET-min/week. After adjusting for confounding factors, male subjects in the highest quartile of MET-min/week showed a 45.0% risk reduction in sarcopenic obesity compared to the subjects in Q1 (P trend = 0.018). A similar risk reduction (56.7%) was detected in the Q4 and Q1 women (P trend < 0.01). These results suggest that sarcopenic obesity can be prevented by participating in physical activity. Similar results showing that the risks of sarcopenia and sarcopenic obesity can be decreased by increasing the intensity of physical activity have been reported [162324].
The increase in basal metabolic rate and total energy expenditure are related to a decrease in muscle mass, and an energy imbalance can lead to visceral obesity [25]. Zamboni et al. [10] reported that decreased physical activity reduces the physical stimulation of muscle cells, which might decrease the number and size of muscle fibers by inducing muscle cell death. Sarcopenia is a pathogenic condition that progresses with aging, and can reduce participation in physical activities and result in a progressive deterioration of body muscle mass. Low muscle mass and low physical activity can interact with each other, and become a significant cause of sarcopenic obesity by decreasing the total energy consumption [26].
Moderate aerobic exercise has a positive correlation with muscle mass and muscle strength of the lower limbs in the elderly [27]. An earlier study found that the muscle thickness and strength of the lower limbs were increased after six months of walking training in elderly subjects [28]. Hwang et al. [29] suggested that in 2,221 subjects participating in resistance exercise more than three times a week, flexibility exercise, and more than one hour of walking, reduced sarcopenic obesity by 53%, 30%, and 49%, respectively, even though the decreases were not significant.
The risk of sarcopenic obesity in the group not meeting the recommended energy intake was higher than that in those consuming the recommended level. Jang and Bu [30] also reported that the total energy intake was positively associated with the sarcopenia index and relative skeletal mass in Korean adults aged 30 years and older. Based on these results, the total energy intake meeting the recommended level has a positive effect on the prevention of sarcopenic obesity in the elderly.
In this study, there was no significant correlation between the protein intake and the risk of sarcopenia. This differs from the results of some studies in western countries, in which the protein intake was shown to effectively reduce the risk of sarcopenia [1831]. This difference might be due to the different sources of protein consumed in Korea and western countries. The traditional diet in Korea is comprised of a high portion of carbohydrates and low portions of fat and animal protein [32]. The major protein source of Korean elderly tends to be more plant-based than meat- or other animal-based [933]. Animal protein contains nearly all the essential amino acids and has excellent biological value compared to plant protein [34]. Houston et al. [18] reported that animal protein with its excellent biological value has a positive effect on muscle mass. Another study analyzed the correlation between the limb muscle mass and the consumption of total protein, animal protein, and plant protein among 2,675 subjects. Compared to subjects in the lowest quartile of total protein and animal protein intake, subjects in the highest quartile had significantly higher limb muscle mass [35]. On the other hand, this tendency was not observed among all quartiles of subjects consuming plant protein. The amount and types of the protein sources were not analyzed in the present study. Further study will be needed to examine the correlation between protein intake and muscle health. In addition, along with the aging effects on muscles, there is anabolic resistance in muscle synthesis from protein intake by foods [36]. Among the older subjects, the muscle mass was still low despite the relatively high protein intake. This result was in agreement with those reported by Burd et al. [36].
In this study, there was a 1.366 times higher risk of sarcopenic obesity in the group not meeting the recommended riboflavin intake than in the group meeting the recommendation. Ashoori & Saedisomeolia [37] indicated that riboflavin, an antioxidant, can ameliorate inflammation in the body. In addition, the vitamin C intake was negatively correlated with sarcopenic obesity in this study. Many studies have reported that the accumulation of reactive oxygen species can cause oxidative stress, which can result in a loss of muscle mass and muscle strength in the elderly [38]. Furthermore, oxidative stress is associated with muscle function, which may be relaed to walking disorders in the elderly [39]. A cross-sectional study by Kim et al. [3] included 1,912 Korean elderly subjects in an analysis of whether the intake of vegetables and fruits can be a sarcopenia prevention factor. They reported that the dietary intake of vegetables or fruits and both vegetables and fruits reduced the risk of sarcopenia significantly in men while the dietary intake of fruits decreased the risk of sarcopenia in women significantly. As fruits and vegetables contain abundant vitamin C and other antioxidants, their intake could effectively lower the level of oxidative stress in skeletal muscle, thereby reduce the risk of sarcopenia. The recommended vitamin C intake for the elderly in Korea was 100 mg/day [40], and these results showed that meeting the recommended vitamin C intake could reduce the risk of sarcopenic obesity. In this study, the lower intake of vitamin A in sarcopenic obese men compared to non-sarcopenic obese men reinforces these reports. In addition, the study using Women's Health and Aging Study reported that the blood carotenoids concentration was associated with the indicator of muscle mass loss in female elderly [38].
The increased prevalence of sarcopenia was associated with elevated serum ferritin levels in Korean elderly women. Women with sarcopenia showed higher levels of serum ferritin than those without sarcopenia [41]. On the other hand, the iron intake was not associated with the risk of sarcopenic obesity in this study.
According to the case-control study of the elderly people with sarcopenia or non-sarcopenia, the non-sarcopenia group consumed more phosphorus than the sarcopenia group [42] In addition, a recent systematic review showed that unlike the data of the present study, a lack of phosphorus can lead to muscle weakness and is positively associated with the prevalence of sarcopenia [43].
Symptoms related to niacin deficiency include neuromuscular deficits, such as muscle weakness and wasting [44]. This report was different from the data of this study, which was not consistent according to gender.
In this study, the nutrient intake of elderly subjects was analyzed using the food consumption data from a 24-hour recall. Bathalon et al. [45] and Sawaya et al. [46] reported that the accuracy of food consumption data by the 24-recall method was similar in elderly and adults. Despite these reports, food intake analysis of elderly subjects from the 24-hour recall method would be a limitation of this study.
In a recent study, Denison et al. [47] indicated that to prevent and manage sarcopenia, a combined strategy that included exercise and diet factors should be applied rather than a single strategy of exercise or diet. In another study, after dividing 100 women aged 60–90 into two groups, which included an RT+M group (progressive resistance training (RT) combined with a protein-enriched diet (M)) and an RT group (progressive resistance training only), they observed differences in muscle mass, muscle strength, and inflammatory markers. After four months, the gain of muscle mass and muscle strength in the RT+M group was greater than that in the RT group, and the inflammatory marker level was significantly lower in RT+M than in RT [48]. Kim et al. [49] reported positive changes in the body composition by the combination of exercise and nutritional therapy among women with sarcopenic obesity.
All of the results in this study were obtained from the data obtained in a cross-sectional study. The limitations of such a study are that the approach makes it difficult to clarify the causes and effects in the relationship between sarcopenic obesity and related factors. On the other hand, this analysis used data from a representative elderly population in Korea and can be used as a descriptive reference on the sarcopenic elderly in Korea. This study was limited to data from KNHANES 2008–2011 because muscle mass data were not included in the surveys conducted before 2008 or after 2011.
In conclusion, sarcopenia and sarcopenic obesity increase gradually with aging and are particularly important due to the recent acceleration of aging in the Korean population. Therefore, active participation in physical activity after individualized consideration of the physical activity level and exercise capacity of elderly subjects, as well as ensuring an adequate intake of energy and vitamins, such as vitamin C in the elderly, would help prevent sarcopenia and sarcopenic obesity.

 XML Download