

 PDF
PDF ePub
ePub Citation
 Print
Print


INTRODUCTION
Dementia is characterized by a progressive decline in cognitive function that affects the social functioning and daily living of patients [1]. The condition can be classified into different types with the most common cause being Alzheimer's disease. Vascular dementia is the second most common cause. Lewy bodies and mixed dementia, which is defined by more than one of the symptoms of dementia, are also common [2]. The number of people diagnosed with dementia worldwide was estimated to be approximately 47 million in 2015 [3]. This number was expected to be around 66 million by 2030 and almost 131 million by 2050 [4]. Dementia affects the lives of the individual and their families. When patients become more dependent, the wider society often provides support and care systems [5].
Because of the worldwide ageing population, the number of people diagnosed with dementia is rising dramatically, particularly in low and middle-income countries [4678]. Alzheimer's Disease International reported that approximately 5% of the costs (US $818 billion total worldwide cost) are associated with family, social, and medical care. Another study [9] stated that the future medical care system, such as public health measures, could replace and reduce this cost of dementia. The Ministry of Health and Welfare reported that the prevalence of dementia will be 1.27 million from 2030, and will double every 20 years as the population of those 65 years and over increases [10].
The Korean government has implemented a long-term care policy for the elderly with functional limitations, including dementia since 2008 [11]. This is called long-term care (LTC) insurance system and elderly with a score of 55 and over (a maximum score of 100) on a checklist form are eligible for this LTC insurance care [11]. After its implementation, the number of residential facilities, including 24-hour supervision with nursing care in Korea, also increased sharply from 1,332 locations (66,715 people) in 2008 to 3,261 locations (153,785 people) in 2017 [12]. The LTC grades (1 to 5 levels) of the LTC insurance system were developed to denote how much help is required for an elderly person in their daily lives. Grade 1 is the most severe state; grade 2 is the severe state; grade 3 is the moderate state and other grades refer to the mild state. A previous study [13] reported that dysphagia might develop in patients with dementia during the course of their disease. This swallowing disorder is a barrier to food consumption and causes severe complications, such as weight loss, malnutrition, and dehydration to dementia patients [141516]. Although nutritional problems of dementia patients have been reported repeatedly in many studies, there are few studies of these problems in Korea, especially for elderly with dementia. Therefore, this study recruited participants with dementia in a long-term care facility in Hongseong-gun, Chungcheongnam-do, Korea.
The assumption was that the nutritional status of a subject is related to the meal types and all subjects were regrouped according to the meal types (general diet group, soft diet group, and liquid diet group). The nutritional status of all subjects was then investigated according to the meal types to develop nutrition intervention strategies for improving the facility meal service and their well-being.
SUBJECTS AND METHODS
Subjects
The subjects (30 of total) were recruited from the Yuil long-term care (LTC) facility (Hongseong-gun, Chungcheongnam-do, Korea) between November and December 2016. All subjects residing in this facility were diagnosed with dementia (mostly AD and vascular dementia) and received the LTC grade. On the other hand, the medical records did not include detailed information of the initial diagnosis of the dementia types. Moreover, the underlying chronic diseases of the patients were not fully informed when they were registered at this facility. The comorbidity of the subjects could only be speculated from their medications. Fifty seven percent of the subjects were taking hypertension medications; 20% were taking medications for cardiovascular diseases; 13% were taking diabetes and 13% were taking pulmonary disease medications. The level of cognitive function was determined by the K-MMSE (the Korean Mini Mental State Examination) and all subjects were divided into two categories (moderate and severe state of dementia). The moderate state patients (10 people) agreed to participate voluntarily and the severe state patients (20 people) were recruited by the agreement of a legal representative. Two subjects who skipped meals or were hospitalized for medical illnesses during the survey were excluded. All subjects provided informed consent before participating, and the study was approved by the Institutional Review Board (IRB) at Soonchunhyang University, Asan, Korea (1040875-201609-BR-032).
Collection of general information
The medical records from the care facility and a questionnaire from a nurse were used to collect general characteristics, such as sex, age, height, weight and duration of residence, and clinical information, such as care insurance grades, cognitive function score (K-MMSE), anthropometric measurements data, blood pressure, blood glucose level, and chewing/swallowing abilities. The questionnaires answered by the nurses were used to assess the characteristics of the diet behaviors, composition of meal types, time of total feeding, service time on meal by caregivers, and functions of chewing and swallowing of each subject. Thirteen government certified the caregivers were hired to offer a general care service to every two or three people in this facility.
Anthropometric, blood pressure and blood glucose level measurements
The anthropometric assessments, blood pressure and blood glucose levels were measured by the facility nurse. The mid-arm circumference (MAC) and calf circumference were measured to the nearest 0.1 cm using a tape measure according to the standard procedures [17]. The systolic (SBP) and diastolic blood pressure (DBP) were measured using an automatic oscillometric sphygmomanometer (UA-767PBT;A&D Ltd., UK). The fasting blood sugar (FBS) levels and postprandial two-hour blood glucose (PP2hr glucose) levels were measured using self-monitoring glucometers (Gluconavii Link 0.3;SD Biosensor Inc., Korea).
Dietary assessment
The food intake data for the 3-day dietary intakes over one weekend day and two weekdays were obtained from each subject by taking a picture of the food tray before and after consumption. The questionnaire answered by the caregivers for extra food intake, such as snacks, beverages or any food supplements, was also investigated to determine the extra food intakes.
The food group intake and the amount of energy and nutrients intake were calculated for each subject using the CAN-pro 5.0 (Web ver. Korean Nutrition Society, Korea). Based on this data, the average daily food intake was calculated and compared with the Dietary Reference Intakes for Koreans 2015 [18] to assess the nutritional status of each subject.
Meal types
The participants were given one of three different types of meals, such as general diet, soft diet, and liquid diet, depending on each patient's chewing ability. The soft diet was mainly rice porridge with a minced side dish. The liquid diet was a pureed diet. Fifty percent of the subjects belonged to the general diet group while 30% and 20% belonged to the soft and liquid diet groups, respectively.
Diet quality and diet diversity
The nutrient density (ND) was calculated by standardizing the nutrient intake per 1,000 kcal based on the food intake amount of each subject. To assess the nutritional adequacy, the nutrient adequacy ratio (NAR) and mean adequacy ratio (MAR) were calculated for the nutrient intake set by the dietary reference intakes for Koreans (KDRIs) standard level and a level of over 1.0 was determined to be adequate.
Twelve nutrients, such as protein; vitamins A, B6, and C; thiamin; riboflavin; niacin; folate; calcium; phosphorous; iron; and zinc, for which the recommended nutrient intake (RNI) is defined by the Korean Dietary Reference Intake (KDRIs), were included in the analyses. The index of nutritional quality (INQ) was also analyzed. The INQs of each nutrient were calculated using the following formulae.
To examine the dietary diversity, the food intake data from each food group set by the CAN-pro 5.0 program were calculated. Each food item was categorized into each food group using the CAN-pro 5.0 program (17 food groups are expressed in Table 6). The dietary diversity score (DDS) was then evaluated using Kant's method [19] to measure the diet diversity. All food items were divided into the five large food groups (grain and starch, meat and poultry, vegetables, milk, and fruits). One point was counted for each food group, excluding food consumed less than a minimum amount for each food group. The total DDS values ranged from zero to five.
Staistical analysis
The data are expressed as mean±SD and analyzed using the statistical program IBM SPSS version 23 for Windows (IBM Corp., Armork, NY, USA). The differences in qualitative characteristics according to the meal types were compared using a Fisher's exact test for categorized variables. A Mann-Whitney U test and Kruskal-Wallis H tests followed by paired comparisons were used to analyze the statistical differences in the quantitative data due to the small sample size. Differences were considered statistically significant at P < 0.05.
RESULTS
General information
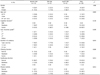
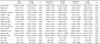
Table 1 shows the general information of the subjects according to the meal types. No significant differences were observed among meal type groups in sex, age, cognitive function and care insurance grade. The duration of residence showed a significant difference according to the meal types (P < 0.05). The chewing and swallowing functions and physical activity level showed significant differences according to the meal types.
Clinical measurements, dietary behaviors, cognitive function
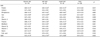
Table 2 shows the clinical measurements and dietary behaviors of the subjects according to the meal types. No significant differences in height, weight, blood pressure, and blood sugar were observed. The BMI, arm circumference and calf circumference showed significant differences according to the meal types (P < 0.05). The K-MMSE score of the general diet group was higher (16.9 ± 4.08 points) than the other groups (P < 0.05). The mean meal-intake time was 21.8 min and there were no significant differences according to the meal types. On the other hand, the helping time by caregivers during meal times was shortest in the general diet group (P < 0.01).
Dietary assessment
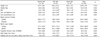
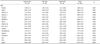
Table 3 shows the average daily intakes of the energy and nutrients of the subjects according to sex and meal types. The average daily energy intakes (kcal/day) of each meal type group showed significant differences (P < 0.01). The average daily intakes of protein and water in the general diet group were significantly higher than in the other two groups (P < 0.01). The average daily intakes of vitamins, such as thiamin (P < 0.01), riboflavin (P < 0.05), and niacin (P <0.01), in the general diet group were significantly higher than those in the other diet groups. The average daily intakes of minerals, such as phosphorus (P < 0.01), potassium (P < 0.05), sodium (P < 0.01), and iron (P < 0.05), in the general diet group were the highest compared to the other diet groups. On the other hand, the average daily intake of iodine was significantly lower in the general diet group than in the other diet groups.
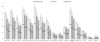
Fig. 1 compares the nutrient intakes calculated as percentages of KDRIs [18] of the subjects according to the meal types. The percentages of energy, thiamin, water, niacin, and phosphorous were significantly higher in the general diet group (P < 0.01). The percentages of protein, riboflavin, potassium, and iron were significantly higher in the general diet group than in the other diet groups (P < 0.05). The percentage of iodine was significantly lower in the general diet group than in the other diet groups (P < 0.05). The percentage of sodium was much higher than the KDRIs in all groups (184.2 to 272.7%).
Diet quality and diet diversity
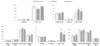
Because of significant differences in the intakes of energy and many nutrients, the indices of diet quality and diet diversity were also investigated according to the meal types. Fig. 2 shows the ND of each nutrient according to the meal types. The ND of niacin was significantly higher in the general diet group than in the other diet groups (P < 0.05). The ND of potassium was significantly higher in the liquid diet group than in the other diet groups (P < 0.05). The ND of folic acid, calcium, and iodine were significantly lower in the general diet group. The ND of water was significantly lower in the soft diet group than in the other diet groups (P < 0.01).
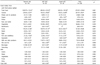
Table 4 shows the results of the NARs and MAR; the NARs of the nutrients ranged from 0.07 to 0.88. The NAR of iron and MAR in the general diet group were significantly higher than those of the liquid diet group (P < 0.05). The NARs of protein (P < 0.05), phosphorous (P < 0.01), thiamin (P < 0.01), niacin (P < 0.01), and riboflavin (P < 0.05) in the general diet group were significantly higher than those of the other two groups. The NARs of calcium, iron, zinc, vitamin B6, and folic acid were less than 0.5 regardless of the meal types.
Table 5 shows the results of INQs per nutrient. The numbers of nutrients, of which the INQs were lower than 1.0, were 11 in the general and soft diet groups and 10 in the liquid diet group. The INQ of niacin in the general diet group was the highest (P < 0.05). The INQ of folic acid was lower in the general diet group than in the soft diet group (P < 0.05). The INQ of calcium and iodine in the general diet group was the lowest. The INQ of potassium was significantly higher in the liquid diet group than in the other diet groups (P < 0.05).
Table 6 presents the results of food intakes from each food group and dietary diversity score (DDS) of the subjects according to the meal types. The amounts of total food, cereals and beverages were higher in the general diet group than in the other diet groups. In particular, there were no mushrooms in the liquid diet groups during the dietary surveys. The amounts of fruits were significantly lower in the liquid diet group than in the other diet groups. The amounts of sugars and seaweeds were significantly higher in the general diet group than in the soft diet group (P < 0.05). The DDS values of fruits and dairy were low for all meal type groups. The total DDS was higher in the general diet group than in the other diet groups (P < 0.05).
DISCUSSION
Many studies have assessed the nutritional status of the elderly in Korea. On the other hand, very few studies have examined those of the elderly with dementia residing in long-term care facilities. The results of this study showed that the average daily energy intake of each subject was much lower than the EER (estimated energy requirements) of the KDRIs (1,026.8 kcal for men and 1,172.0 kcal for women). According to the KDRIs [18], it is recommended that healthy elderly aged over 65 years consume 2,000 kcal (men) or 1,600 kcal (women). The subjects residing in the care facilities did not move as much as healthy elderly, so a direct comparison of the nutritional intakes of the study subjects with the KDRIs would not be appropriate.
Several other studies [202122] conducted to analyze the average daily energy intakes of the Korean elderly reported that their energy intakes were mostly lower than the EER of KDRIs. In particular, the study conducted for the elderly aged over 70 years of long-term care facilities in Seoul Metropolitan and Kyeonggi-do in Korea [22] reported that the daily average energy intakes of these subjects were much lower than the EER in KDRIs (1,360 kcal for men and 1,378 kcal for women). The mean EER of 1,232.9 kcal, which was estimated from the daily physical activity data on the 24-hour questionnaire, were compared with dietary energy intakes because of the very low activity levels of those subjects [23]. They concluded that the average daily energy intakes of their subjects were adequate. The mean of daily average energy intakes of the present subjects was 1,130.55 kcal, which was lower than data of the above-mentioned study [22]. In the present study, however, the energy intake of the general diet group was 1,314.9 kcal, which is similar to the previous mentioned study [22]. The study subjects in the soft and liquid diet types did not appear to intake enough energy while the subjects in the general diet group may consume sufficient energy considering their physical activity levels. The use of the KDRIs for nutrition assessment of people with very low activity and a bedridden state, such as immobile patients in hospitalized conditions or later stages of dementia, has some limitations. This suggests that new standards for DRIs settings are needed for those people in Korea.
This study investigated the diet quality with multiple indexes such as ND, NARs and MAR, INQ and DDS. The results showed that even a general diet did not show appropriate values for these indexes meaning that the diet qualities of these subjects are not adequate. When the energy intake levels and food consumption were assessed, despite being low compared to the KDRIs, the general diet group appeared to intake a proper amount of food considering their mobility. On the other hand, soft and liquid diet group did not show sufficient food intake. When the quality of diet was considered, the soft and liquid diet showed even higher quality in several nutrients than the general diet. Although the energy intake and general amount of food intakes appeared to be adequate, improvements in the nutrient quality are needed for the general diet group.
Most NARs, especially those of minerals (calcium, iron, and zinc) and vitamins (vitamin B6 and folic acid) were less than 0.5 in all meal type groups. The MARs were lower in the general and soft diet group (0.52, 0.42) than in those reported in another study conducted in a long-term care hospital [24]. With these findings, our study subjects need to consume more of those minerals and vitamins. For these subjects, increasing food consumption is not easy. In particular, for those in the soft and liquid diet groups, increasing the amount of food intake is almost impossible. Therefore, more nutrient-enriched foods are required to improve diet quality and food diversity [25].
The results of the DDS showed that the amounts of cereals, vegetable, fruits, and beverages were comprised largely of total food intakes. According to the 2010–2012 KNHNES survey results, healthy elderly aged 60 to 79 years consumed 1,301.2 g of food in a day [26], which was much higher than the current study results. This shows that the dementia patients in this facility do not consume enough food and are at risk of malnutrition and dehydration. Several other studies also showed that dementia patients did not consume enough food [141516]. In the present study, the intakes of most food groups were much lower in the soft diet and liquid diet groups than in the general diet group. Even the consumptions of beverages related to food volumes were much lower in the soft diet and liquid diet groups than in the general diet group. The DDS scores of meats, fruits, and diary food group were very low in all meal type groups and all subjects are encouraged to consume more food in those food groups to meet the sufficient intake levels for their diet's diversity, which is very difficult practically for the patients in this study. Because of the limited food intake amount for soft and liquid diet group, their diet quality needs to be improved.
Usually, diets for the hospitalized patients are prescribed according to the patients' conditions. Unfortunately, in this long-term care facility, the diets are not prescribed as therapeutic diets, but either a visiting medical doctor or caregivers suggest the meal types or menu of the patients according to their own opinions from time to time. Therefore, the diet quality of small facilities needs to be analyzed. In the present study, the nutrition intakes were only analyzed according to the meal types. This comparison might not reflect appropriately whether the diets for these patients are adequate or not. This could be another limitation of the study, but as it was an initial study for improvements of the facility diet, it was important to evaluate the current diet first. Moreover, in this facility, the patients on the soft and liquid diets took the same diets continuously for more than one week during the study. This is against the general recommendation, which suggests nutrition intervention after five days of liquid diet consumption in a hospital setting. A care facility with this small scale cannot meet the usual hospital settings. With the results of our study, appropriate, but practical ways to meet the nutrition quality for the elderly with dementia residing in small facilities could be suggested.
In conclusion, the meal quality and diversity should be improved for all meal type groups in this facility. Further interventions with sophisticated strategies according to each meal type group are needed for dementia patients in this long-term care facility. Several intervention strategies can be suggested as follows. First, providing nutritious snacks will be a good approach for all meal type groups. This snack should be easy for dementia patients with a poor physical function to chew and swallow. Second, highly nutrient-dense diets with sufficient vitamins and minerals for all diet groups should be provided. These strategies should focus on subjects with limited food intake who require high nutrient quality diets. Despite the limitations, this study provided detailed data of the nutritional status, diet quality and diet diversity of long-term care facility residents with dementia in Korea.
 XML Download