

 PDF
PDF ePub
ePub Citation
 Print
Print


Introduction
Acronychia pedunculata is one species belongs to the Rutaceae family found in all of Indonesia. The stem bark have been used in traditional medicine for the treatment of fever, asthma, diarrhea, and rheumatism.1 According to previous studies, the most common secondary metabolites isolated from A. pedunculata are alkaloids,2 coumarins,3 and isoprenylated acetophenone derivatives.45 Isoprenylated acetophenone derivatives in the genus Acronychia indicate not their value as chemotaxonomic markers of the genus. Isoprenylated acetophenone derivatives were reported to possess cytotoxic,4 anti-inflammatory,6 and antioxidant7 activities. In the present study, a phytochemical investigation is reported of the stem bark of A. pedunculata focused on the isolation and structural elucidation of a new isoprenylated acetophenone derivatives, acronyculatin P (1) along with two known compounds, 3′,5′-diisoprenyl-2′,4′-dihydroxy-6′-methoxyphenylethanone (2) and 3′-isoprenyl-2′,4′,6′-trihydroxyphenylethanone (3). The cytotoxic activity of compounds 1 – 3 against murine leukemia P-388 cells from this plant are also reported.
Experimental
General experimental procedures
Column chromatography and radial chromatography were carried out using silica gel 60 and silica gel 60 PF254 (Merck, Darmstadt, Germany). UV spectra were recorded in MeOH on a Shimadzu series 1800 UV-VIS spectrophotometer (Kyoto, Japan). IR spectra were recorded in KBr on a One Perkin Elmer instrument (Waltham, MA, USA). NMR spectra were measured on a JEOL JNM-ECA 400 MHz FTNMR spectrophotometer (Tokyo, Japan) in CDCl3 with TMS as the internal standard. Mass spectra were measured on an ESI-TOF Waters LCT Premier XE producing pseudomolecular ions, [M−H]− negative ion mode (Santa Clara, CA, USA).
Plant materials
The dried and powdered of stem bark of A. pedunculata was collected in July 2017 from Gunung Salak, Bogor, West Java, Indonesia by Mr. Ismail Rachman. The plant material was identified at the Herbarium Bogoriense, Bogor. A voucher specimen (AP 60329) was deposited in Herbarium Bogoriense, Center of Biological Research and Development, National Institute of Science, Bogor, Indonesia.
Extraction and isolation
The stem bark of A. pedunculata (1.5 kg) was extracted with methanol at room temperature two times and then extracts were concentrated in vacuo. The methanol extract (350 g) was suspended in H2O and partitioned with n-hexane (11.6 g) and ethyl acetate (7.7 g). The n-hexane extract (11 g) was further fractionated by column chromatography on silica gel (200 g) eluted with n-hexane-ethyl acetate by increasing polarity (from 9:1, 4:1; 7:3, and 1:1) to give three major fractions A–C. Fraction A (0.5 g) was separated by planar radial chromatography eluted with n-hexane-CHCl3 (from 9:1 to 4:1) to produce subfractions A1–A2. Subfraction A2 was purified by planar radial chromatography using n-hexane-diisopropylether (from 9:1 to 4:1) to yield compound 1 (46 mg). Fraction B (5.3 g) was refractionated using column chromatography and eluted with n-hexaneethyl acetate (from 9:1 to 1:1) to produce three subfractions B1–B3. Subfraction B2 was purified by planar radial chromatography using n-hexane-diisopropylether (from 9:1 to 4:1) to afford 2 (28 mg). The ethyl acetate extract (7.5 g) was fractionated over silica gel column chromatography eluted with n-hexane-ethyl acetate (from 9:1, 4:1; and 1:1) to give five major fractions D–H. Fraction E (0.75 g) was purified with n-hexane-ethyl acetate (from 4:1, 7:3; and 1:1) to afford 3 (24 mg).
Acronyculatin P (1)
Yellowish syrup. UV (MeOH) λmax nm (log ε) : 252 (4.25), and 283 (4.23). IR (KBr) νmax cm−1: 3300, 1619, 1587 and 1184. 1H and 13C NMR see Table 1. HRESIMS: m/z [M−H]− calcd. for C20H28O4 331.1924, found 331.1909.
3′,5′-Diisoprenyl-2′,4′-dihydroxy-6′-methoxyphenylethanone (2)
Yellowish syrup. UV (MeOH) λmax nm (log ε) : 224 (4.38), and 290 (4.21). HRESIMS: m/z [M−H]− calcd. for C19H25O4 317.1536, found 317,1532.
3′-Isoprenyl-2′,4′,6′-trihydroxyphenylethanone (3)
Pale yellowish solid, mp. 173 – 175 ℃. UV (MeOH) λmax nm (log ε) : 236 (4.32), and 280 (4.20). HRESIMS: m/z [M−H]− calcd. for C13H15O4 235.2569, found 235.2560.
Cytotoxic activity
The human tumor cell used in this work was P-388 cells (murine leukemia) and cultured in RPMI 1640 medium. The P-388 cells were seeded into each 96-well cell culture plate at a density of 3 × 10⁴ cells/well and incubated at 37 ℃ for 48 h against murine leukemia P-388 cells using the 3-(4,5-dimethylthiazol-2-yl)-2,5-diphenyl-2H-tetrazolium bromide (MTT) reduction assay. Compounds 1–3 dissolved in DMSO by variations in concentration of 100; 30; 10; 3; 1; 0.3 and 0.1 µg/mL with triplicate treatment. The number of cells inhibited by each of compounds 1 – 3 were measured using microplate reader spectrometer at λ 540 nm. Artonin E was used as positive control and DMSO 1% was used as negative control.891011 The IC50 values of the compounds were calculated through extrapolation 50% absorption lines to various concentrations using regression analysis.
Result and Discussion
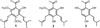
The structures of 1 – 3 were elucidated by UV, IR, HRESIMS, 1D and 2D NMR spectroscopy (Fig. 1). To our knowledge, compound (1) is a new compound. The 1H and 13C NMR spectral data of compounds 2 – 3 are consistent with published data.1213
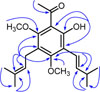
Compound (1) was isolated as yellowish syrup. The HRESIMS of 1 exhibited a negative molecular ion peak [M−H]− at m/z 331.1924 indicating a molecular formula of C20H27O4 implying seven degrees of unsaturation. The UV maximum absorption at λmax 252 (4.25), 283 (4.23) nm and IR bands (νmax, cm−1)at 3300, 1619, 1587 and 11844. The 1H NMR spectrum (Table 1) showed an acetyl signal at δH 2.71 (3H, s, H-2), a chelated hydroxyl group at δH 13.43 (1H, s, 2′-OH), and two methoxyl groups at δH 3.71 (6H, s, 4′/6′-OCH3). In addition, compound 1 showed 3-methyl-1-butenyl proton signals at δH 6.40 (1H, d, J = 15.6 Hz, H-1″), 6.55 (1H, dd, J = 15.6; 7.1 Hz, H-2″), 2.48 (1H, dq, J = 15.6; 8.2 Hz, H-3″), 1.68 (3H, s, H-4″), 1.10 (6H, d, J = 6.8 Hz, H-4″/5″), and a 3-methyl-2-butenyl (isoprenyl) proton signals at δH 5.16 (1H, t, J = 6.6 Hz, H-2‴), 3.29 (2H, d, J = 6.6 Hz, H-1‴), 1.78 (3H, s, H-4‴), and 1.69 (3H, s, H-5‴). The placement of hydroxyl, methoxyl, 3-methyl-1-butenyl, and 3-methyl-2-butenyl groups of 1 were established by HMQC and HMBC spectra (Fig. 2). The 13C NMR spectrum of 1 revealed the signals for an acetyl group at δC 31.4 and δC 204.7 as well as three oxyaryl carbons at δC 163.5, δC 161.5, and δC 159.6 characteristic for a 2′,4′,6′- trioxy-genated acetophenone derivatives.5 The HMBC spectrum revealed a cross-peak correlation between δH 2.71 (H-2) and an carbonyl carbon at δC 204.7. The proton signal of a chelated hydroxyl group (δH 13.43, 2′-OH) correlated with three quaternary carbons [δC 111.9 (C-1′); 161.5 (C-2′); 116.9 (C-3′)]. The proton signal of methoxyl group at δH 3.71 (4′/6′-OCH3) correlated with two oxyaryl carbons [δC 163.5, and δC 159.6] showing the presence of two methoxyl groups at C-4′ and C-6′. Furthermore, the proton signal of methylene of 3-methyl-2-butenyl chain at δH 3.29 has correlation with two oxyaryl carbons [δC 163.5 (C-4′), and δC 159.6 (C-6′)], two quaternary carbons [δC 120.4 (C-5′), and δC 131.6 (C-3‴)], and a methine carbon at δC 123.8 (C-2‴) confirmed that the 3-methyl-2-butenyl chain is located at C-5′. The presence of long-range correlations between the proton signal of a vinylic of 3-methyl-1-butenyl chain at δH 6.40 (H-1″) was correlated to a oxyaryl carbon at δC 163.5 (C-4′), and two methine carbons at δC 143.1 (C-2″), and 32.9 (C-3″) reinforces the location of 3-methyl-1-butenyl chain at C-3′. Therefore, compound 1 was identified as (E)-1-(2′-hydroxy-4′,6′-dimethoxy-3′-(3″-methylbut-1″-enyl)-5′-(3‴-methylbut-2‴-enyl)phenylethanone and given the trivial name acronyculatin P. Other HMBC correlations consistent with the structure 1 are shown in Table 1 and Fig. 2.
Compounds 1 – 3 were assessed for their cytotoxicity and results are shown in Table 2. The IC50 values were 15.42, 27.26, and 80.59 µM, respectively (artonin E as a positive control, ICµ 3.05 µM). Compound 1 was more active than others, But, all the compounds were less active when compared with the positive control.

 XML Download