

 PDF
PDF ePub
ePub Citation
 Print
Print


Introduction
Determining the potential for hepatotoxicity and hepatic injury is an important aspect of identifying the hazards of pharmaceutical and industrial chemicals. The liver is involved in the metabolism and detoxification of xenobiotics [3], and the primary mechanism of hepatic injury involves exposure to a xenobiotic or metabolite above some threshold level. In the liver, some lipophilic compounds are transformed into hydrophilic metabolites by the cytochrome P-450 system, and some reactive metabolites are conjugated with intracellular proteins [8]. Mitochondria are of paramount importance in the intracellular mechanisms leading to hepatic cell death or apoptosis [1223]. To evaluate the hepatotoxic effects of chemicals, non-clinical animal testing is widely used in regulatory toxicity testing [1819]. Over the past decade, in vitro toxicity tests have been developed and validated as replacements for animal testing in consideration of animal welfare. Another drawback of animal studies is the differences between species in terms of liver functions and detoxication of chemicals.
High-content analysis (HCA) using multi-parameter cell-based assays has been explored as an in vitro model for predicting the hepatotoxicity potential of chemicals [172831]. Multi-parametric assays provide information on cellular functions by simultaneously measuring different indicators at the single-cell level. HCA technology facilitates multi-parametric analysis, at the level of individual cells, by applying flow cytometry and cellular imaging-based approaches [4927]. By simultaneously detecting nuclear morphology, mitochondrial membrane potential, cytosolic free calcium, and oxidative stress damage in an in vitro system using human hepatocytes, the combination of HCA and multi-parametric assays enables investigations of xenobiotic toxicity and its underlying mechanisms.
For the assessment of hepatotoxicity, HCA has been applied in in vitro cytotoxicity assays using human liver-derived HepG2 cells [17]. Tolosa et al. [28] validated HCA methodology in HepG2-based cytotoxicity assays using various hepatotoxicants and nonhepatotoxic compounds. Assessment of hepatotoxicants using HCA with multi-parametric cytotoxicity assays has been performed in many studies [212225]. Xu et al. [31] validated an in vitro testing approach by combining a well-defined model of human primary hepatocytes (hPHs) and HCA technology. Nevertheless, there are still questions on HCA methodology and sensitivity. For HCA to be applied to regulatory toxicity testing, it is necessary to validate its methodology and reproducibility in different laboratories and various in vitro models.
In this study, we validated the application of HCA using multi-parameter cell-based assays as an in vitro testing model for predicting the hepatotoxic potential of various chemicals. The application of HCA has been assessed using a HepG2-based in vitro system. The HepG2 cell line has been extensively employed in in vitro testing models, which is a suitable system for assessing the hepatotoxicity of chemicals because it has homogeneous and consistent cellular features and maintains its properties in vitro. However, it has been reported that it is difficult to predict the hepatotoxic potential of certain compounds in a HepG2-based in vitro system due to very low levels of expression and activity of drug-metabolizing enzymes [11]. By contrast, hPHs, due to their intact cellular architecture and higher expression of drug-metabolizing enzymes, are considered to be the gold standard for in vitro testing models [530]. Nevertheless, in hPH-based in vitro models, further improvement is required to overcome some disadvantages, including limited availability, expense, and rapid loss of cell functions [1023]. Consequently, it is necessary to further assess HCA using different cell types. Herein, we selected a total of ten hepatotoxicants known to cause liver injury; for all of these compounds, the mechanisms of actions have been described. Using HCA, we confirmed the cytotoxic effects of each hepatotoxicant in HepG2 cells and compared the resultant cellular damage to that observed in hPHs.
Materials and Methods
Compounds
All compounds were supplied by Sigma-Aldrich (USA). As shown in Table 1, ten hepatotoxic compounds were included in this study. These hepatotoxicants were selected on the basis of published information regarding their hepatotoxic potential and mechanism of action [628]. Each compound was prepared as a 200-fold concentrated stock solution in dimethyl sulfoxide (DMSO) and stored at −20℃. On the day of treatment, test substances were freshly prepared in relevant media to obtain the desired final concentration. The final DMSO concentration in the relevant media never exceeded 0.5% (v/v).
Culture of human hepatocytes
The human hepatoma cell line HepG2 was obtained from American Type Culture Collection (ATCC, USA). HepG2 cells were cultured in Eagle's minimum essential medium (EMEM; ATCC) supplemented with 10% (v/v) fetal bovine serum (FBS; Gibco-BRL, USA) and 1% (v/v) penicillin and streptomycin (Millipore, USA). For subculturing purposes, HepG2 were detached by treatment with 0.25% Trypsin-EDTA (1×) (Gibco, USA). Cells were seeded at a density of 1.0 × 10⁴/well in 96-well plates (BD Bioscience, USA) and incubated at 37℃ in a 5% CO2 humidified incubator. The hPHs were provided as Corning Gentest Plateable Human CryoHepatocytes (male, 36 years, Caucasian, cerebrovascular stroke), of which drug-metabolizing enzymes, such as CYP1A2 and CYP3A4 were qualified by the supplier (Corning, USA). The hPHs were recovered using Corning Gentest High Viability CryoHepatocyte Recovery Medium (Corning), and prepared using Corning Gentest CryoHepatocyte Plating medium supplemented with 10% (v/v) FBS (Gibco-BRL) according to the supplier's instructions. Cells were seeded at a density of 3.0 × 10⁴/well on Corning BioCoat Collagen I-coated 96-well plates (BD Bioscience) and incubated at 37℃ in a 5% CO2 humidified incubator. After 6 h of attachment, the plating medium was replaced with hepatocyte culture medium (HCM) supplemented with an HCM SingleQuots kit (Lonza, USA) containing ascorbic acid, bovine serum albumin-fatty acid-free, hydrocortisone, human epidermal growth factor, transferrin, insulin, and gentamicin/amphotericin-B. Cells were examined to confirm that confluence was ≥ 50%.
Treatment of different hepatotoxicants in human hepatocytes
Twenty-four hours post-seeding, both types of human hepatocytes were treated for 24 h at 37℃ in a 5% CO2 humidified incubator with the indicated concentrations of the following hepatotoxicants: acetaminophen (AAP; 5, 10, and 20 mM), aflatoxin B1 (AFB1; 10, 20, and 50 µM), amiodarone HCl (ADR; 3, 10, and 30 µM), cycloheximide (CHM; 10, 100, and 200 µM), cyclophosphamide monohydrate (CPP; 3, 10, and 30 mM), etoposide (ETP; 10, 20, and 50 µM), lovastatin (LVT; 12.5, 25, and 50 µM), orphenadrine hydrochloride (OPN; 10, 100, and 200 µM), t-butylhydroperoxide (TBHP; 10, 100, and 200 µM), and tetracycline (TC; 10, 100, and 300 µM). The doses of each compound were approximately 12.5% to 50% of the lethal concentrations in HepG2 cells, which vary depending on experimental conditions and were identified in our laboratory (Table 1, unpublished data). Control wells were incubated with vehicle (0.5% DMSO) for the same period under the same conditions.
HCA using multi-parameter cell-based assays
After treatment, cells were washed and then simultaneously incubated for 1 h with four different fluorescence probes (Molecular Probes, USA): Hoechst 33258 to stain nucleic acids, tetramethylrhodamine methyl ester (TMRM) to assess mitochondrial membrane potential, fluo-4-acetoxymethyl ester (Fluo-4AM) to monitor cytosolic free calcium, and lipid peroxidation sensor BODIPY 665/676 (BODIPY) to monitor oxidative damage. The probes were chosen so that their absorption and emission spectra did not overlap to avoid spectral bleed-through while examining the spectral range of a quadruple filter and were used at the appropriate concentrations (Hoechst 1.5 µg/mL, TMRM 75 ng/mL, Fluo-4AM 0.96 µM, and BODIPY 6 µg/mL). Cellular nuclei were labeled with Hoechst 33258 to define a primary cellular object in fluorescence channel 1. The primary object should be a major constituent of the cell as it is used to identify individual cells. Other channels were used to acquire image data for a single cellular target. Targets were measured using the circ (nuclear) region and the area measurement was expanded for the whole cell. This protocol was established based on the observed phenotypic change of the cells after treatment [1]. For image analysis, the 20× objective was used to collect at least 1,000 cells (maximum 50 fields per well) for each fluorescence channel. Fluorescence images were acquired using the Cellomics ArrayScan VTI HCS Reader (Thermo Scientific, USA) and appropriate filter settings. Fluorescence intensity was analyzed using Cellomics Scan Software. Data are presented as a percentage of the corresponding vehicle control. Additionally, the fluorescence images were reconfirmed on a fluorescence microscope (unpublished data).
Statistics
Data from triplicate wells for each group are presented as mean ± SE values. The statistical significance of differences between the treatment and control groups was determined by ANOVA with a post hoc test or Duncan's multiple range tests. A p < 0.05 was considered significant. In addition, changes with ≥ 10% or ≥ 20% variation in comparison with the vehicle control were considered significant for comparison of cytotoxic effects between human hepatocytes.
Results
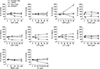
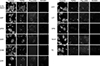
HCA in HepG2 cells exposed to various hepatotoxicants
All compounds tested were well-known hepatotoxicants associated with liver injury, for which the mechanisms of action have been described. In the HepG2-based multi-parameter assays, the various hepatotoxicants induced alterations in mitochondrial membrane potential, cytosolic free calcium, or lipid peroxidation (Figs. 1 and 2). In terms of mitochondrial impairment, as determined by TMRM staining, HepG2 cells were affected by all hepatotoxicants, although the effect was not dose-dependent in all cases. The TMRM intensities were significantly decreased at all doses of CHM, CPP, and ETP, at medium and high doses of AAP, LVT, OPN, and TC, and at high doses of AFB1, ADR, and TBHP. Fluo-4AM intensity, an indicator of cytosol free calcium linked to calcium homeostasis, was increased at high doses of ADR, CHM, and OPN. Most compounds, except ADR, OPN, and TBHP, affected the intensity of lipid peroxidation sensor BODIPY 665/676, indicating oxidative degradation of lipids. BODIPY intensities were significantly increased at all doses of CHM, ETP, and LVT, at medium and high doses of CPP, and at high doses of AAP, AFB1, and TC. By contrast, nuclear size and morphology were not affected by most hepatotoxicants.
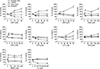
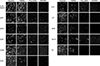
HCA in hPHs exposed to various hepatotoxicants
To compare their cytotoxic effects in human hepatocytes, hPHs were treated with the same doses of hepatotoxicants. Their nuclear morphology was affected by most hepatotoxicants, and in particular nuclear size was reduced (Fig. 3). The hPHs exhibited nuclear shrinkage in response to hepatotoxicants such as AAP, AFB1, CHM, CPP, ETP, and TBHP. In addition, the various hepatotoxicants altered mitochondrial membrane potential, cytosolic free calcium, and lipid peroxidation in hPHs, similar to their effects on HepG2 cells (Figs. 3 and 4). Mitochondrial impairment, as determined by TMRM intensity, was observed in all treatments except OPN. The TMRM intensities were significantly decreased at all doses of AAP, AFB1, CHM, ETP, TBHP, and TC, at medium and high doses of LVT, and at high doses of ADR and CPP. Cytosolic free calcium, reflected by Fluo-4AM intensity, was elevated in response to all doses of AAP, ADR, CPP, LVT, and TBHP, but was reduced in response to ETP. All hepatotoxicants except ETP altered the fluorescence intensity of BODIPY. Most compounds (all doses of AAP, AFB1, CHM, CPP, and TBHP, medium and high doses of LVT and OPN, and high doses of TC) increased lipid peroxidation, whereas ADR decreased BODIPY intensity.
Comparison of cytotoxic effects in HepG2 cells and hPHs via HCA using multi-parameter cell-based assays
The HCA data from HepG2 and hPHs were generally concordant, although some discrepancies were noted (Table 2). For example, in terms of nuclear morphology, hPHs exhibited nuclear shrinkage in response to AAP, AFB1, CHM, CPP, and TBHP, whereas the nuclear size of HepG2 cells was not affected by those treatments. Both types of hepatocytes exhibited mild or severe mitochondrial impairment in response to most hepatotoxicants, but the mitochondrial membrane potential of HepG2 cells was not significantly affected by AFB1, whereas that of hPHs was not changed by OPN. Regarding Fluo-4AM, an indicator of cytosolic free calcium, only the effects of ADR were concordant between HepG2 cells and hPHs: the Fluo-4AM intensity was elevated by CHM and OPN in HepG2 cells, but by AAP, CPP, LVT, and TBHP in hPHs. Most hepatotoxicants showed a significant increase in the intensity of BODIPY in both types of hepatocytes. However, BODIPY intensity was increased by all doses of ETP only in HepG2 cells, and by OPN and TBHP in hPHs, but was decreased by ADR in hPHs. Overall, hPHs were more sensitive than HepG2 cells in terms of all cellular parameters except TMRM.
Discussion
In this study, we assessed HCA using multi-parameter cell-based assays as an in vitro hepatotoxicity testing model using various hepatotoxicants and human hepatocytes. This approach has been used previously to simultaneously measure hepatocellular parameters associated with drug-induced liver injury and its mechanism of action [172831].
In in vitro hepatotoxicity tests, cell density serves as an environmental modulator of cell viability and functional stability [20]. In addition, it is crucial to obtain high-quality imaging results for HCA with an in vitro testing model using human hepatocytes. For this study, the cell density per well was determined to be 10,000 cells for HepG2 cells and 30,000 cells for hPHs through a preliminary experiment. The 50% inhibitory concentration (IC50) values of various hepatotoxicants were estimated from in vitro cytotoxicity assays using HepG2 cells under our experimental conditions. For HCA, both hepatocytes were exposed to ≤ 50% of the lethal concentration of each compound tested.
The Hoechst 33258 dye is widely used for cell-permeant nuclear counterstaining, which allows a sensitive determination of cell number by fluorescence microscopy; in addition, the dye is often used to distinguish nuclear phenotypic changes [1]. Nuclear size was not affected in HepG2 cells, whereas hPHs exhibited nuclear shrinkage in response to hepatotoxicants such as AAP, AFB1, CHM, CPP, and TBHP. The HepG2 cell is human hepatoma cell that can propagate and be maintained indefinitely in vitro, whereas hPHs does not have those capabilities, which might explain the differences in nuclear morphology responses between the two types of hepatocytes. O'Brien [15] and O'Brien et al. [17] demonstrated that measurement of nuclear size was the most precise and sensitive of all parameters used for toxicity assessment, and that alteration of the nuclear area was observed very early after exposure to toxic compounds, even before changes were detected in mitochondrial potential.
Mitochondria play important roles in eukaryotic cells, including ATP production, regulation of apoptosis, production of reactive oxygen species, and control of intracellular ion balance; consistent with this, mitochondria are common targets of toxicants [26]. In this study, mitochondrial impairment was determined by using TMRM, a lipophilic cationic fluorescent probe that freely crosses the plasma membrane and accumulates within mitochondria as a function of their membrane potential [7]. Mitochondrial responses depend on the type of toxicant, the dose, and the specific mitochondrial function that is affected [17]. In this study, both hepatocyte types exhibited mild or severe mitochondrial impairment in response to most of the tested hepatotoxicants. In terms of mitochondrial activity, there was good agreement between its reduction and exposure dose. These results suggested that the main intracellular mechanism of irreversible hepatic injury, which is followed by hepatic cell death or apoptosis, might involve the participation of mitochondria [1224].
Fluo-4AM can be used to measure changes in cytosolic free calcium concentration. Among the hepatotoxicants tested, only ADR had concordant effects on HepG2 cells and hPHs. Otherwise, the intensity of Fluo-4AM was elevated by CHM and OPN in HepG2 cells, but by AAP, CPP, LVT, and TBHP in hPHs. Although calcium homeostasis is not specific to a particular mechanism, elevation of intracellular calcium is an indicator of cellular injury. Among the hepatotoxicants tested, LVT and TBHP are reported to induce oxidative stress damage by disrupting calcium homeostasis during hepatic injury [132831]. We detected evidence of this mechanism in hPHs but not in HepG2 cells.
Lipid peroxidation, the oxidative degradation of lipids, can lead to hepatocyte injury but is often reversible [2]. Changes in lipid peroxidation were observed following treatment with AAP, AFB1, CHM, CPP, LVT, and TC, all of which (except CHM and TC) have mechanisms related to bioactive or oxidative stress. Additionally, BODIPY intensity was increased by all doses of ETP but only in HepG2 cells, and by OPN and TBHP in hPHs. TBHP has been frequently studied as a hepatotoxicant that causes oxidative stress damage and induces steatosis in liver [132831]. Interestingly, the BODIPY signal was reduced by ADR in hPHs, which is inconsistent with previously published data [2829].
Among the parameters acquired through HCA, the most sensitive parameter was TMRM, affected even at a low dose, then BODIPY, followed by Fluo-4AM. In addition, for most cellular parameters, hPHs exhibited more sensitive responses than HepG2 cells, potentially due to differences in their drug-metabolizing abilities. The HCA results were in relatively good agreement between HepG2 cells and hPHs, although some inconsistencies were noted. These results demonstrate that both types of hepatocytes can be employed in in vitro hepatotoxicity tests that are combined with the HCA methodology.
Most researchers agree that HCA is a useful tool for assessing hepatotoxicity potential of drugs and their mechanism of action. A limitation/weakness of the HCA method is that measuring cytotoxic endpoints can categorize the degree of injury induced by a compound but might not provide a definite conclusion about its toxicity mechanism. However, the different mechanisms involved in hepatotoxicity are closely related and can interact. Each mechanism can produce a different initial cell alteration, and then activate other effects and lead to cell death. The mechanism that is detected at the lowest concentration of a compound may be considered as its main mechanism. In addition, the sequence and direction of drug-induced change must be considered.
Studying cytotoxic effects in both dose-dependent and time-dependent manners could be better for classifying a toxicity mechanism. Kinetic analysis has indicated that different cytotoxic effects have different detectable times; the appropriate time for detecting lipid accumulation is 48 h after treatment, whereas other cytotoxic effects can be detected after 24 h [9]. Additionally, there are also some technical issues that may restrict the effectiveness of HCA cytotoxicity screening, producing high variance results [1516]. In order to understand the significance of HCA results, the degree of change in each parameter should be considered as well as the number of parameters affected. Hepatotoxicity can impair a specific cell function, but the level of damage could significantly differ [28]. It is necessary to be circumspect in the analysis of mechanisms involved in the cytotoxic effects of compounds. We agree with Mattiazzi Usaj et al. [14] that, while there have been many advances related to the HCA technique, many aspects of this application are still in their infancy and several questions remain. Moreover, any specificity for hepatotoxins over compounds toxic to other organs should be determined through future study [5].
The HCA data showed some inconsistencies in the results for HepG2 cells and hPHs in our study as well as between our study and previously published data; regardless, the results from HepG2 cells and hPHs were generally concordant. Overall, the application of HCA to in vitro hepatotoxicity testing using human hepatocytes enables more efficient hazard identification, and certain parameters could serve as sensitive endpoints for predicting the hepatotoxic potential of chemical compounds. However, further study is needed to overcome limitations in the hepatocyte-based in vitro hepatotoxicity assessment system and to improve the capacity to detect hepatotoxic compounds when using such a system.


 XML Download