

 PDF
PDF ePub
ePub Citation
 Print
Print


INTRODUCTION
Asthma and its associated traits exhibit a strong familial connection, indicating that a genetic component likely contributes to the disease pathology. Twin studies are commonly used to determine whether complex multifactorial diseases, such as asthma, have a measurable genetic component. In a study of 7000 monozygotic twins performed over 100 years ago, the concordance rate for asthma between monozygotic twin pairs was 19%, nearly four times higher than that of dizygotic twins (4.8%).1 The overall heritability of asthma has since been estimated at anywhere from 15–60%, and genetic variants, such as single nucleotide polymorphisms (SNPs), are presumed to play an important role in the etiology of the disease. To identify SNPs in multifactorial complex diseases, several approaches, including genome-wide linkage studies, biologically plausible candidate gene association studies, and genome-wide association studies (GWAS) have been performed, revealing more than 100 loci on autosomal and sex chromosomes to be linked to asthma. Linkage analysis has identified SNPs on several genes, including ADAM33,2
DPP10,3
PHF11,4
GPR,5 and PTGDR,6 as strong genetic variants for asthma.
Over the past decade, several GWAS have been performed, examining 300K–500K SNPs and producing a nearly complete survey of all common genetic variability.7 In 2010, the GABRIEL consortium used GWAS to confirm the association of asthma with many of the previously identified SNPs associated with antigen presentation (HLA-DR/DQ), inflammation (ORMDL3-GSDMB: Gasdermin B), and TH1/TH2 immune responses (IL33, IL-1RL1-IL18R1, RAD50-IL13, and TSLP-WDR36).8 However, the odds ratios (ORs) for these markers ranged from 0.5–2.0, much lower than originally expected. Furthermore, combination of these seven SNPs for the classification of childhood asthma produced a sensitivity of only 35% and a specificity of 75%, indicating these markers as poor predictors of asthma overall.
Despite the poor predictive power suggested by the GABRIEL consortium study,8 analysis of genetic variants associated with asthma continues to flourish. As of December 2017, 3437 publications were identified in the PubMed database using the searching terms “asthma” and “polymorphism.” Interestingly, the ORs for most of the associated SNPs ranged between 0.5 and 2.0, indicating a much smaller genetic component in the development of asthma than initially expected. Possible explanations for this poor predictive power included a lack of rare allele variants in the GWAS database, imprecise disease phenotypes, and incomplete consideration of environmental factors.9 Furthermore, a more extensive combinatorial analysis using the identified SNPs has not been thoroughly studied to date. The present review focuses on the genetic impact of rare allele variants on asthma and the clinical usefulness of combinational analysis using identified SNPs on nonsteroidal anti-inflammatory drug-exacerbated respiratory diseases (NERD).
GENETIC EFFECT OF RARE VARIANTS IN ASTHMA
Until recently, much of the speculation regarding the missing heritability not detected using standard GWAS has focused on the possible contribution of rare variants [minor allele frequency (MAF) <0.5%], as only common variants (MAF>5%) were available in previous GWAS datasets. For more information on these rare variants, the 1000 Genomes Project sequenced 1000 individual genomes, revealing more than 15 million new SNPs, 1 million short insertions and deletions, and 20000 structural variants10. More recently, Igartua, et al.11 investigated associations among rare (<1%) and low-frequency (1–5%) variants using a Human Exome Bead Chip array containing 246139 SNPs in ~5000 asthmatic patients and 5000 controls, representing a broad cross section of European, African American/African Caribbean, and Latino subjects. This analysis revealed a number of rare variants for asthma to be associated with ethnicity, including SNPs in GRASP (general receptor for phosphoinositides 1-associated scaffold protein), MTHFR (methylenetetrahydrofolate reductase), and GSDMB in association with asthma in Latino, African, and all ethnicities, respectively. These data suggest that associations with rare and low-frequency variants are specific for each ethnicity and not likely to explain a significant proportion of the genetic variants for asthma.
IMPROVEMENT OF GENETIC EFFECTS ACCORDING TO STRATIFICATION OF PHENOTYPES
Because asthma is a heterogeneous disease, use of well-defined sub-phenotypes may improve the genetic power of SNPs. Although asthma has been traditionally divided into two major pathways based on the mechanism of pathogenesis,12 further subgrouping is possible based on the factors that trigger asthma symptoms,13 including allergic asthma, exercise-induced asthma, NERD, occupational asthma, menstruation-associated asthma, and others. Furthermore, inflammatory patterns in sputum and peripheral blood analysis can be used to divide asthma into four groups: eosinophilic, neutrophilic, mixed, and paucigranulocytic types. Clinically and physiologically, asthmatics are also stratified into well controlled, exacerbation-prone, and remodeled asthma.
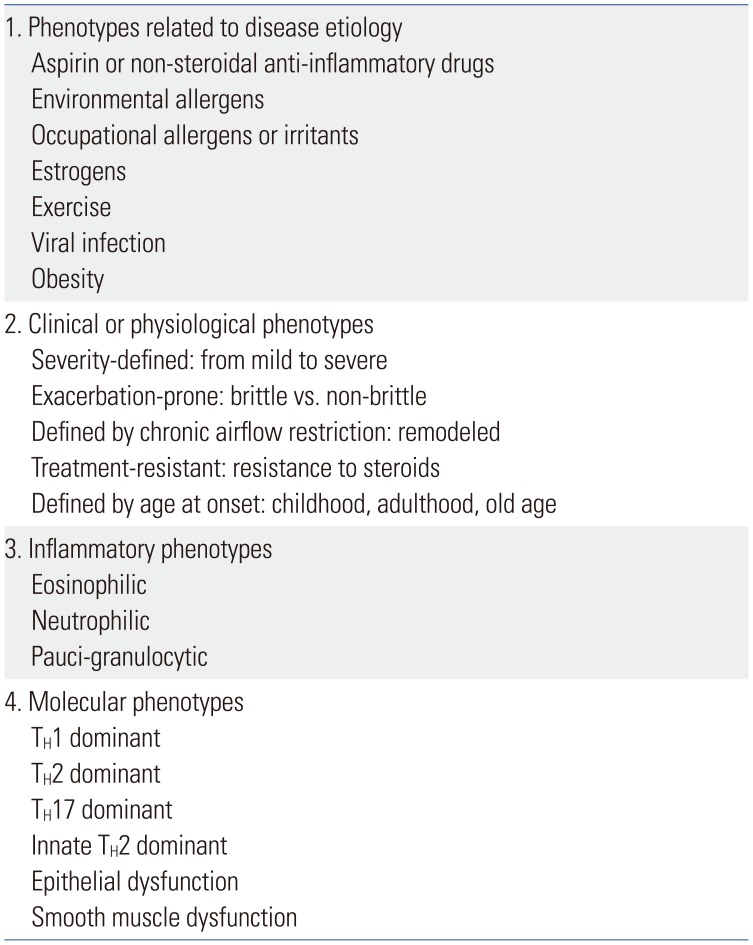
Recently, biological classification has been introduced on the basis of molecular pathogenesis. Candidate endotypes include several biological mediators and functional immune subsets, including TH1, TH2, TH17, innate TH2, epithelial, and smooth muscle dysfunctions, as well as others (Table 1). Identification of genetic associations would therefore have to be studied using cluster analysis of well-defined sub-phenotypes, with patients stratified based on clinical manifestations and endotypes.1415 Furthermore, quantitative loads of environmental factors should also be considered, as asthma is known to be triggered or exacerbated by a wide range of compounds, including air pollutants,16 occupational materials,1718 nutritional status1920 and food allergens.21222324 Of these factors, occupation is one of the most easily accessible triggers. In a GWAS using the well-defined Korean toluene diisocyanate (TDI)-induced asthmatic cohort,25 SNPs in CTNNA3 (catenin alpha 3, alpha-T catenin) were significantly associated with the risk of TDI-induced asthma (OR=5.84 for rs10762058). The attributable fraction increased up to 24%, indicating that the missing heritability of asthma has been solved in part by the consideration of environmental variables. Very recently, homozygosity of the minor allele SNPs rs10762058 and rs7088181 was shown to increase the risk for di-isocyanate asthma in Caucasian workers, with an OR=9.05 [95% confidence interval (CI): 1.69–48.54],26 a level high enough to be considered useful as a genetic marker. Another example is that of drug-induced reactions in susceptible persons, such as those with NERD. Initial genetic association studies of NERD patients used a set of biologically plausible genes associated with the over- or under-production of arachidonic acid metabolites. Genes such as LTC4S, ALOX5, NAT2, CysLTR1, and CysLTR2, all members of the cysteinyl leukotriene pathway, exhibited several NERD-associated SNPs, with ORs ranging from 1.88 to 9.78.1827 Genes of prostaglandin and thromboxane pathways discovered using GWAS28 also showed good ORs, although not at levels high enough for use as a standalone diagnostic biomarker
IMPROVEMENT IN DIAG NOSTIC VALUES BY COMBINATORIAL ANALYSIS OF MULTIPLE SNPS OBTAINED FROM GWAS
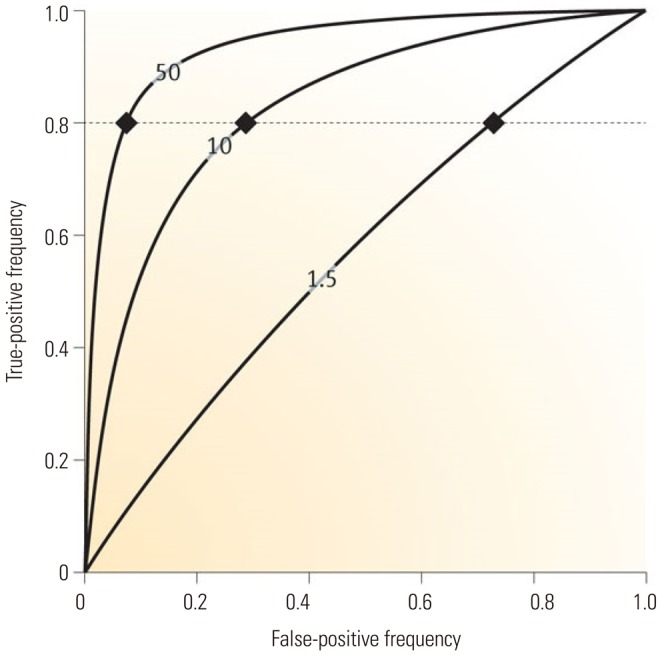
The method most often used for measuring predictive factors is the area under a receiver operator characteristic (ROC) curve (Fig. 1).29 The area under this curve (AUC) is frequently used to discriminate between those with and without disease. AUC values range from 0.5 (providing no discrimination between the two conditions) to 1.0 (perfect discrimination), with ideal classification exhibiting almost square curves, indicative of high true-positive and low false-positive rates. Disease risk prediction is frequently described using a combination of sensitivity, specificity, and accuracy. In order to obtain a sensitivity and specificity of 80% or more, which is typically required for clinical utility, the absolute OR should be greater than 10 (Fig. 1). AUC values predictive of a hypothetical condition carry modest (1.5), sizeable (10), and large (50) ORs, showing false-positive fractions at 80% sensitivity (dotted line; fractions are >75, >25, and <10%, respectively) are shown in Fig. 1.30
To obtain diagnostic marker sets of SNPs with an OR >10, combinatory analyses were performed on SNPs from GWAS. The first GWAS of 80 NERD subjects and 100 aspirin-tolerant asthma (ATA) subjects was performed using 100K Bead Chips, covering only a small portion of genetic variants. Despite this limitation, eleven genes were identified as having p values <7×10⁻⁵. One hundred fifty non-monomorphic tagging-SNPs in and around the 11 identified genes were genotyped on 163 NERD and 429 ATA as the second-stage mapping.31 Among the SNPs, rs7572857 G>A (Gly74Ser) of CEP68 was most significantly associated with the risk of NERD (p=6.06×10⁻⁵, 95% CI=1.64−4.21, OR=2.63). Because the ratio of ATA and NERD subjects varies among studies, the number of NERD and ATA patients should be normalized according to the prevalence of NERD in a given population. When we applied the incidence of positive response in oral aspirin challenge (16.03%) in Korean adult asthmatics,32 the diagnostic value of rs7572857 G>A on CEP68 was not high enough to justify clinical application due to the low accuracy (53%), sensitivity (18%), and specificity (88%) of this marker. Taken together, these data highlight the need for better methods capable of increasing the discriminating power of individual SNPs, as well as the evaluation of combinatorial effects of SNPs on disease resolution.33
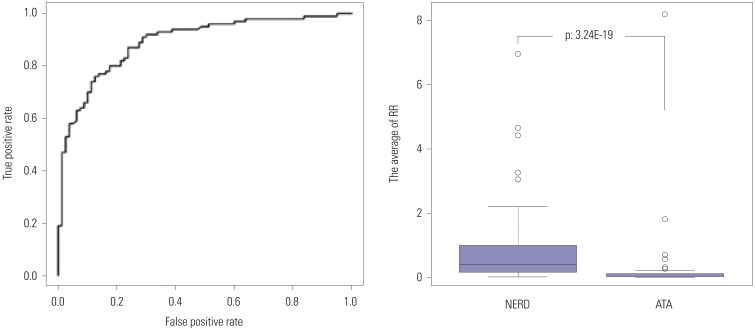
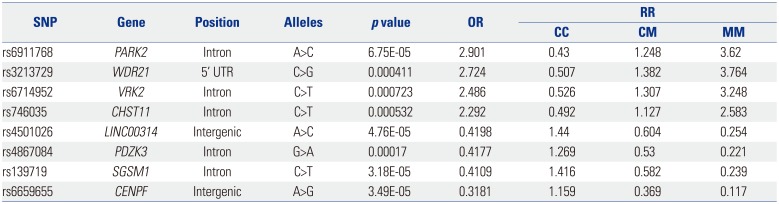
Using the 10 SNPs with the lowest p values from the 1st GWAS of NERD patients,31 relative risk (RR) was calculated for each individual subject using a multiple logistic regression analysis of the 1023 possible combinations (210−1) of SNPs.34 The ROC curve analysis demonstrated that a combinatorial set of eight SNPs was the best model for maximizing the AUC (0.9) for distinguishing NERD from ATA (Fig. 2). This model exhibited 82% accuracy, 78% sensitivity, and 88% specificity with an OR of 20.74 (p=3.24×10⁻¹⁹).34 Each of the eight SNPs, including Parkin RBR E3 Ubiquitin Protein Ligase, DDB1 and CUL4 Associated Factor 4, Vaccinia Related Kinase 2, Carbohydrate Sulfotransferase 11, Long Intergenic Non-Protein Coding RNA 314, PDZ Domain Containing 2, Small G Protein Signaling Modulator 1, and Centromere Protein F exhibited ORs ranging from 0.32 to 2.91 (Table 2). These data suggest that the diagnostic accuracy of the SNPs as genetic markers is robustly increased by combinatorial analysis, compared to that of single SNPs alone.
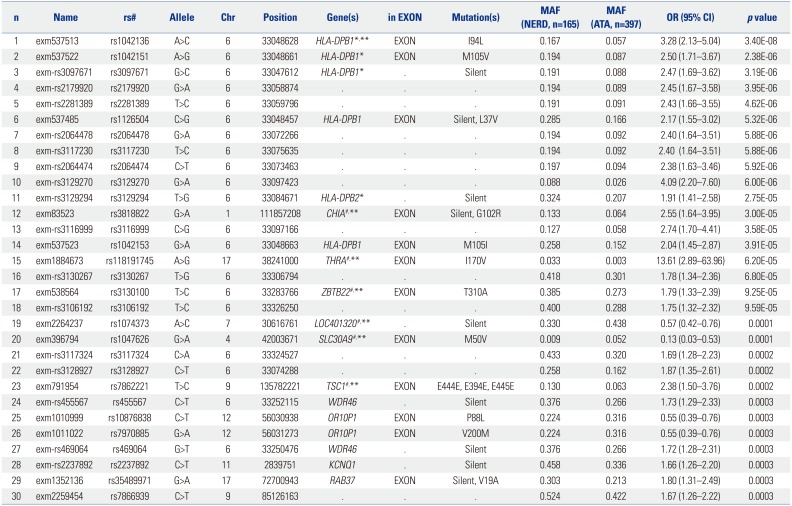
In the second GWAS using the 660K chip, as well as a replication study on 141 subjects with NERD and 996 ATA subjects,28 rs1042151 (Met105Val) in exon 2 of HLA-DPB1 showed the highest susceptibility to NERD (p=5.11×10⁻⁷; OR=2.40). The rs1042151 acts as a potential cis regulator of the expression of HLA-DPB1 with an expression quantitative trait loci (eQTL) score of 36.83, as calculated using the eQTL browser (http://eqtl.uchicago.edu/cgi-bin/gbrowse/eqtl/). Further analysis of SNP function (https://snpinfo.niehs.nih.gov/snpinfo/snpfunc.html) indicated that the rs1042151 SNP is located in an exonic splicing enhancer region; however, despite the location of this SNP, its true effect remains questionable, as rs1042151 alone exhibits very low accuracy (54.7%) and sensitivity (17.7%) for predicting NERD, despite strong specificity (91.7%). Furthermore, because this GWAS was limited to common variants (MAF>5%) with minimal coverage of exonic SNPs,35 a second NERD-associated SNP study was extended to exonic SNPs using an Exome BeadChip assay containing 240K SNP.36 In this analysis, another exonic SNP (exm537513 in HLA-DPB1, rs1042136) showed the lowest p value (p=3.4×10⁻⁸, OR: 3.28) in association with the risk of NERD, although with low sensitivity (16.7%) and accuracy (55.5%) as before, in spite of relatively high specificity (94.3%). These data suggest that SNPs on HLA-DPB1 should contribute to the development of NERD. but are not clinically useful as genetic markers of NERD.
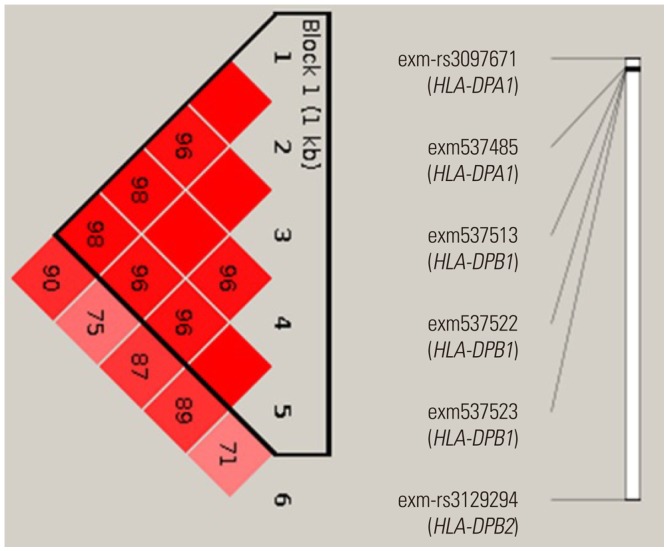
In the exon-wide association study, 16 of the top 20 SNPs were located on chromosome 6 (Table 3). Among them, six SNPs were exonic and located on HLA-DPB1 [exm537513 (rs1042136, I94L), exm537522 (re1042151, M105V), and exm537523 (rs1042153, M105I)], HLA-DPA1 [exm-rs3097671 (silent) and exm537485 (rs1126504, L327V)], and HLA-DPB2 [exm-rs3129294 (silent)]. Furthermore, a strong linkage disequilibrium (LD) was noted between the six exonic SNPs in the HLA genes (Fig. 3). AUCs for the combinations of these SNPs (26−1) were calculated by multiple logistic regression analysis, with a combination of four SNPs (exm537513, exm537522, exm-rs3097671, and exmrs3129294) exhibiting the best AUC value of 0.629 with OR=3.677, 68.4% accuracy, 29.8% sensitivity, and 90.3% specificity. To further enhance the diagnostic value of the exonic SNPs, the other six exonic SNPs were selected according to their p values (marked with # in Table 3) and added to the four HLA SNPs. A multiple logistic regression analysis was undertaken for all combinations of these 10 SNPs under the additive mode, yielding a total of 1023 models (210−1) generated. From this analysis, a combination of seven SNPs (exm537513, exm83523, exm1884673, exm538564, exm2264237, exm396794, and exm791954) showed the best AUC of 0.75 (p=7.94×10⁻²¹), with OR=7.291, 40.8% sensitivity, 88.0% specificity, and 75% accuracy for the discrimination of NERD from ATA. To date, 2161 SNPs in HLA-DPB1 and 2602 SNPs in HLA-DPA1 have been identified (http://www.ncbi.nlm.nih.gov/snp/?term=HLA-DPB1 and http://www.ncbi.nlm.nih.gov/snp/?term=HLA-DPA1), of which 239 and 193 exonic SNPs are present in HLA-DPB1 and HLA-DPA1, respectively. This indicates that the number of SNPs within the 660K GWAS and 240K exon chips used in our and other studies is still not sufficient to discover all of the SNPs associated with NERD. Thus, further discovery of SNPs in HLA-DPB1 and HLA-DPA1 will be necessary for the development of diagnostic genetic markers for NERD.
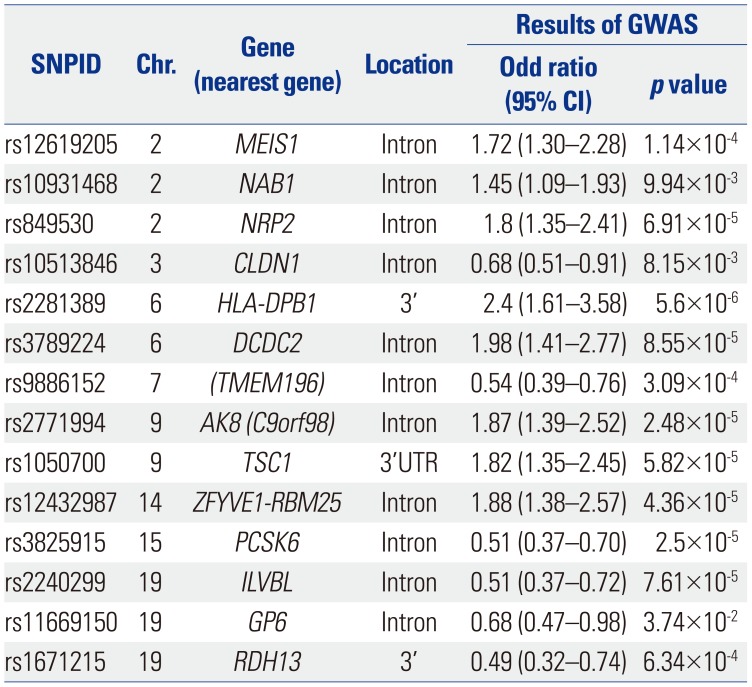
Our third combinatorial analysis of SNPs was performed with the 660W genome-wide association data examining 142 NERD and 996 ATA.28 Fourteen genes [HLA-DPB1, MEIS1, NAB1, NRP2, CLDN1, DCDC2, TMEM196, AK8(C9orf98), TSC1, ZFYVE1-RBM25, PCSK6, ILVBL, GP6, and RDH13] were selected on the basis of OR and p values (Table 4). In this study, summed genetic risk scores were calculated as a combinatorial analysis and used in place of OR.37 To exclude the effect of LD, one SNP on each of the 14 genes was chosen, and the genetic risk score of each of the subjects was calculated by assigning ORs to the risk alleles in comparison to reference alleles. This was followed by summing the ORs from multiple variants in different genetic loci into a single RR value using the following formula:

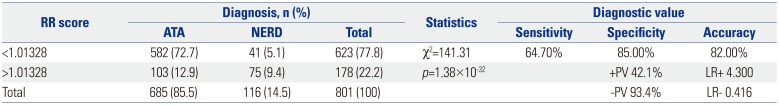
The summed risk scores of the 14 SNPs ranged from 0.774 to 1.142, with an average of 0.973. These summed risk scores were significantly higher in NERD patients than in ATA controls (1.033±0.005 vs. 0.963±0.002, p=8.58×10−37). The AUC of the NERD score was 0.821. The best cutoff value with a score of 1.01328 was determined using the ROC curve and the Youden's Index. A higher proportion of NERD subjects showed summed risk scores above the cutoff value relative to ATA subjects [64.66% vs. 15.04%, p=1.38×10⁻³², OR=10.34 (6.69−15.96)]. The sensitivity and specificity of the scores were 64.7% and 85.0%, respectively, with an accuracy of 82.0% (42.1% positive and 93.4% negative predictive values) (Table 5).
COMPARISON OF THE GENETIC MARKERS IN DIAG NOSIS OF NERD
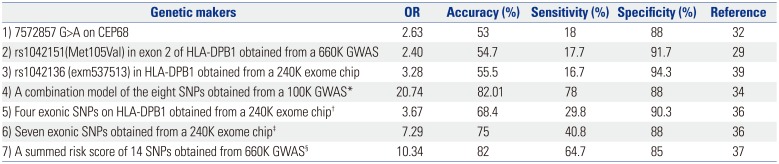
The three most significant SNPs identified in the GWAS and exome chip studies exhibited ORs of only 2.4−3.28, with accuracies of 53.0−55.5% (Table 6). Although the specificity of these markers was very high, nearing 90% in many cases, the sensitivity of these markers was consistently low, typically at less than 20%. In contrast, both the OR and accuracy were elevated using combinatorial analysis of the top 10 SNPs obtained from the GWAS. A combinatorial analysis of several SNPs from GWAS and exome-wide association studies provided a more comprehensive genetic set for the diagnosis of NERD, compared to that of single SNPs alone. In the data presented here, the combination of eight SNPs obtained from a 100K GWAS and the summed risk score of 14 SNPs obtained from 660K GWAS showed higher accuracy (82.0% and 82.01%), compared with that observed for the 240K exome chip (68.4% and 75.0%). The improved accuracy of GWAS in these studies was derived from the higher sensitivity of the method (64.7% and 78.0%), compared to that seen using exome-wide methods (29.8% and 40.8%), despite equal specificities of ~90%.
PERSPECTIVES FOR IMPROVED DIAG NOSTIC VALUES USING COMBINATORIAL ANALYSIS OF MULTIPLE SNPS
GWAS have been used to identify numerous loci associated with multifactorial complex diseases and quantitative traits. However, most GWAS have not studied the gene-gene interactions (epistasis) that could be important in complex trait genetics and in combinatorial analysis of the SNPs. Existing statistical techniques, such as logistic regression and multifactor dimensionality reduction, can be used to identify the combinatorial effects of multiple SNPs in disease susceptibility; however, methods for the analysis of these techniques remains computationally intensive. To overcome some of these computational bottlenecks, a series of methods have been developed, including the use of computers equipped with particular graphical processing units, such as the BiForce Toolbox (University of Turku, Turku, Finland). The BiForce Toolbox incorporates additional tests of interactions involving SNPs with significant marginal effects and identifies interesting interaction signals and pathways.38 Pathway-based approaches may also narrow the search space and enhance power, for example by seeking pathways39 or by identifying common pathways enriched in epistatic genes with modest interaction signals detected from multiple GWAS populations.40 In either case, rapid screening of pairwise interactions in individual GWAS populations appears to be critical in order to provide the information necessary to design and perform pathway-based analyses.
Another limitation is the relatively small sizes used in these studies, thereby limiting the ability to replicate significant epistasis signals.41 A recently proposed statistical method, called Limitless Arity Multiple-testing Procedure (LAMP),42 provides the possibility of detecting statistically significant higher-order interactions. LAMP is a multiple testing procedure for identifying statistically significant combinatorial effects by introducing a theoretical upper bound for a familywise error rate tighter than a Bonferroni correction. Its application to GWAS may uncover synergistic effects of SNPs associated with diseases, while filtering out uninformative combinations. Another program, LAMPLINK (National Institute of Advanced Industrial Science and Technology, Tokyo, Japan), also has the ability to quickly identify combinatorial effects of SNPs.
Outside of computational methodologies, an important factor complicating the diagnosis of NERD is the low overall penetration of genetic traits. If the genetically susceptible subjects do not take aspirin or NSAID in their lifetime, they will never develop NERD or aspirin-induced urticaria. Thus, a history of aspirin or NSAID use should be available at the time of diagnosis, although the exact dosage and duration of drug exposure remains difficult to estimate for both patients and physicians. In the future, better combinatorial data will be possible as more information related to the measurable exposome becomes available and incorporated into big data-type analyses, including factors such as lifestyle, prescription drug use, and exposure to air pollution.
In the effort to identify SNP markers, GWAS has provided useful information for asthma. Understandably, however, identified SNP markers alone show poor discriminating power for diagnosis, mainly due to biological complexity and phenotypic heterogeneity of asthma. Research to identify rare variants in asthma not only seems to be unsuccessful at discovering genetic markers, but also fails to provide meaningful information on the missing heritability of the disease. In contrast, studies using sub-phenotypes and combination/integration of SNPs seem to be more successful in achieving clinically useful diagnostics. In the near future, it is expected that statistical methods providing improved sensitivity and specificity could be achieved by the combination and integration of common genetic variants with exposome data for individual patients.
 XML Download