

 PDF
PDF ePub
ePub Citation
 Print
Print


Introduction
Indobufen (2-[p-(1-oxo-2-isoindollinyl)-phenyl]-butyric acid) belongs to the group of non-steroidal anti-inflammatory drugs, and inhibits thromboxane production and cyclooxygenase (COX)-dependent platelet aggregation. The reversible inhibitory effect of indobufen on platelet aggregation is effective for the prophylaxis of thromboembolic events in patients at risk and for the maintenance of graft patency.[1]
Indobufen exists in the mixture of two enantiomeric forms, R and S in a 1:1 ratio. Although the racemic mixture (rac-indobufen) is commonly used in medical practice, the anti-platelet and anti-inflammatory activity of indobufen resides mainly in the S-enantiomer.[12] S-indobufen is approximately 2-fold more potent than the racemate in inhibiting the synthesis of cyclooxygenase products.[23] Administration of rac-indobufen to healthy volunteers[4] or patients with obliterative atherosclerosis[5] resulted in significantly lower serum levels of the S-enantiomer than the R-enantiomer. The R-enantiomer also shows anti-platelet aggregation effects, and is detected at high concentrations in the blood after administration of the indobufen racemate. Here, we explored the optimal dosage of R-indobufen and S-indobufen as a single therapeutic agent, respectively, in comparison to the predicted treatment outcomes on therapeutic dosage of rac-indobufen, 400 mg/day (200 mg twice daily) through Monte-Carlo simulation.
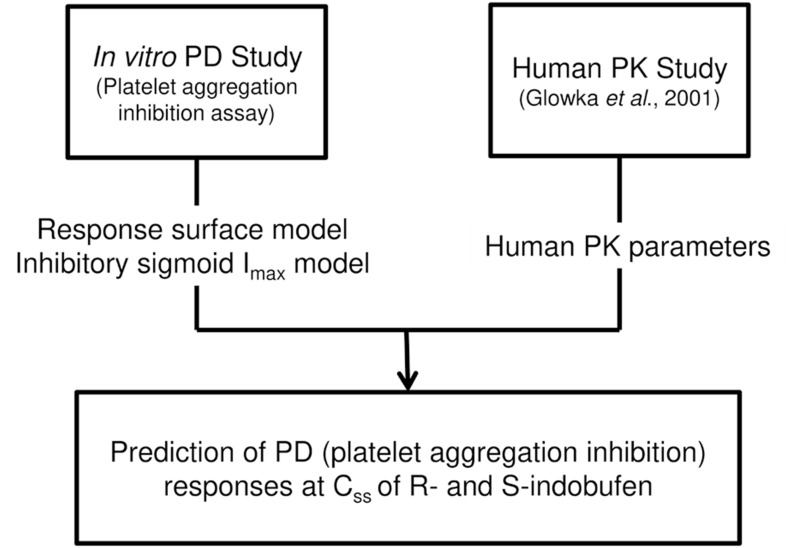
The aim of the present study was to characterize the anti-platelet effects of S- and R-indobufen using in vitro data modeling and evaluate the interaction between the two enantiomers using population modeling methodologies. In addition, the anti-platelet effect of each indobufen enantiomer at steady state at the recommended therapeutic dosage was predicted.
Go to : 
Methods
Subjects
Twenty four men were enrolled at Asan Medical Center (Seoul, Korea). All enrolled subjects were healthy Korean male volunteers aged 19–50 years who weighed >50 kg and were within 20% of the ideal body weight. The platelet aggregation test was performed in healthy subjects who were not taking any medications and who did not have bleeding disorders. None of the subjects had significant cardiac, hepatic, renal, pulmonary, neurologic, gastrointestinal, or hematologic disorders as determined by medical history and physical examination. The physical examination included assessment of vital signs, electrocardiography, and clinical laboratory test (hematology, blood chemistry, and urinalysis). Subjects with a history of smoking or alcohol abuse, or those using any over-the-counter drug within 7 days before the first study day (Day 1) were excluded.
All laboratory tests other than the platelet aggregation test were performed at the Department of Laboratory Medicine, Asan Medical Center (accredited by the Korean Association of Quality Assurance for Clinical Laboratories). The platelet aggregation test was performed at the Clinical Pharmacology Lab of Asan Medical Center. The Institutional Review Board of Asan Medical Center approved the study protocol (registration No.; S2009-0248-0001), and all procedures were performed in accordance with the Good Clinical Practice guidelines[6] and the Declaration of Helsinki and its amendments. All participants provided written, informed consent before the screening test for eligibility.
Blood sample collection
Approximately 100 mL whole blood was collected into standard sodium citrate tubes (3.8%) from each subject. Blood samples were centrifuged to obtain plasma for use in pharmacodynamic (PD) analysis.
Pharmacodynamic plasma sample analyses (Platelet Aggregation Inhibition Assay)
The plasma assay for determining in vitro platelet aggregation inhibition was performed using S- and R-indobufen (Ibustrin® tablet 200 mg) from Ildong Pharmaceuticals Co., Ltd. (Seoul, Korea). Each reference standard of S- and R-indobufen (0.5 g) was dissolved in methanol to generate a 10,000 mg/L solution, and then diluted using platelet-rich plasma (PRP) to produce 892 mixtures consisting of different concentrations of S- and R-indobufen. Basically, 0.25, 1, 2, 4, 8, 16, 24, 32, 64, and 128 mg/L of S-indobufen with corresponding 0 mg/L of R-indobufen, and vice versa were made using the plasma samples in each of 24 subjects. Then, the concentration combinations of S- and/or R-indobufen each that will be used in the experiment were randomly selected from 0.25, 1, 2, 4, 8, 16, 24, 32, 64, and 128 mg/L by generating random number using R software, and we conducted the experiment based on the preselected concentration combinations of S- and/or R-indobufen. The resultant final dataset used in this analysis consists of 366 and 364 “0” concentrations of S- and R-indobufen, and the other concentrations ranged from 36 and 48, respectively. Platelet aggregation inhibition was determined using a Four-Channel aggregometer (Chrono-Log 570VS Model, Chrono-Log Corp., Havertown, PA, USA) equipped with an AggroLink software package as described previously with modifications.[7] In brief, PRP and platelet-poor plasma (PPP) were prepared by differential centrifugation (200 g for 10 min and 2,345 g for 10 min at 25℃, respectively). The PRP (0.3 mL) was incubated at 37℃ in the aggregometer for 5 min, followed by the addition of collagen (2 ug/mL) with continuous stirring. Platelet aggregation was recorded for up to 10 min and expressed as the maximal percentage change of light transmission from baseline using PPP as a reference, and maximal platelet aggregation (MPA) was calculated. Plasma samples from healthy male subjects were used for in vitro assessments. No study drug was administered to the subjects.
Pharmacokinetic data
Pharmacokinetic (PK) data were obtained from Glowka et al., who analyzed the steady state PK characteristics of indobufen enantiomers in a patient with obliterative atherosclerosis [5]. In that study, 200 mg indobufen was administered twice daily for 7 days to 11 patients (eight men and three women; 47–71 years of age [mean 60 ± 7 years], body weight 47–100 kg [mean 72 ± 17 kg]), and PK sampling and measurement of bleeding time were performed. The same PK parameters were used in the present simulation study to identify the optimal dosage regimen of S-indobufen or R-indobufen alone.
Pharmacodynamic evaluation
A total of 892 MPA data with or without S- and R-Indobufen using plasma samples from 24 healthy male subjects were modeled using NONMEM® 7.2 with FOCE (first-order conditional estimation) and the INTERACTION method.[89] The baseline MPA measured without indobufen and MPA with indobufen were used as they are, considering the possible correlation between baseline MPA and the inhibitory effect of indobufen. The response surface model [10] was used to characterize the pharmacodynamics of each enantiomer of indobufen including the interaction between enantiomers. First, the concentrations of R- (Rconc) and S-indobufen (Sconc) were normalized to the potency C50 as following UR and US:
Then, a family of drugs, each with a unique ratio of UR and US, was defined with an interaction term (ISR), and U50 was calculated as follows by applying fourth-order polynomial equation for empirical approximation and then simplifying the equation[10]:
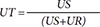
The concentration-response relation of the two stereoisomers was described using the inhibitory sigmoid Imax model [11] as follows:
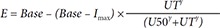
Base represents baseline MPA measured in plasma with neither S- nor R-indobufen; Imax represents the maximal inhibition, and gamma (γ) represents Hill's coefficient.
The inter-individual variability of parameters (C50, gamma, and Imax) was evaluated using an exponential model, whereas residual variability in platelet aggregation was most adequately described by an additive error model. The parameters for a specific subject were described using the following equation:
where PTV is the typical value of the parameter and ηi represents the normally distributed variables with a mean of zero (i.e., the unexplained inter-individual differences in a PD parameter among the individuals). Residual error was characterized using combined additive and proportional error models as described in the following equation:
where ε is zero-mean normally distributed variables.
Age, body weight, height, and platelet count were tested for their associations with various parameters. A likelihood ratio test was used to discriminate between hierarchical models at a p value of ≤0.05 because the distribution of −2 log likelihood of the models follows an approximate chi-square (χ2) distribution.
Standard diagnostic plots, including the observed values of the dependent variable (DV) versus the population predicted values (PRED) and the conditional weighted residuals (CWRES) versus PRED, were used for the diagnosis of optimum fit capabilities. Standard errors of parameter estimates of the PD model were used as a diagnostic. In the predictive check analysis, 1,000 datasets were simulated using NONMEM® 7.2 from the final PD model, and the median prediction was compared visually using the observed indobufen inhibition data in a response-surface plot. Bootstrapping, resampling technique with replacement, was performed to assess the bias and stability of the parameter estimates. A total of 1,000 bootstrap runs were performed, and the resulting parameter distributions were used to define 95% confidence intervals of the parameter estimates as 2.5th and 97.5th percentiles.
The modeling process was facilitated by the R statistical software (version 3.0.2, The R Foundation for Statistical Computing, Vienna, Austria, URL: http://www.R-project.org).
Simulation study for the optimal dosage
After we characterized PD of each enantiomer we conducted simulation study predicting the treatment efficacy of each enantiomer to suggest optimal dosing regimens of each enantioselective formulation of indobufen which is potentially more adequate to use in clinical situations (Fig. 1). Anti-platelet effect of each enantioselective indobufen was compared with the effect on 200 mg twice daily doses of rac-indobufen, which is a current therapeutic doses of indobufen. Monte-carlo simulation was conducted to evaluate the concentration-anti-platelet effect relationships of each R- and S-indobufen formulation. Then, anti-platelet effect was simulated on 200 mg twice daily dosing regimen of each rac-indobufen, S-indobufen, and R-indobufen using the average steady state concentration of S- and R-indobufen on 200 mg twice daily doses of rac-indobufen in a previous clinical study.[5]
Go to :
Results
Study population
Of the 24 subjects enrolled, the mean (±standard deviation) age was 25.5 ± 3.2 years (range, 21–35 years) and the mean weight (±standard deviation) was 70.0 ± 6.4 kg (range, 56–69.5 kg).
Pharmacodynamic model
Various structural and error models were tested, guided by graphical assessment of optimum fit properties and statistical significance criteria. The inhibitory sigmoid Imax model was the most accurate for describing platelet aggregation inhibition data. When the concentration-platelet aggregation dataset was fit using response surface model without fixing the initial value of ISR (interaction between S- and R-form drug activities) as zero in NONMEM, the parameter estimate of ISR and its standard error were −0.647 and 0.432, and its derived 95% confidence interval included a zero value. We assumed that there was no interaction between the two enantiomers, the interaction term (ISR) value was fixed at zero at the subsequent fittings.
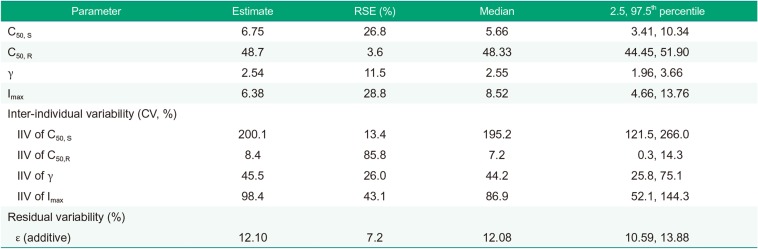
Diagnostic plots revealed no significant bias, and no trend was observed (Fig, 2). The final model was validated using predictive check (Fig. 3) and nonparametric bootstrap procedures (Table 1). The final parameter estimates are shown in Table 1.
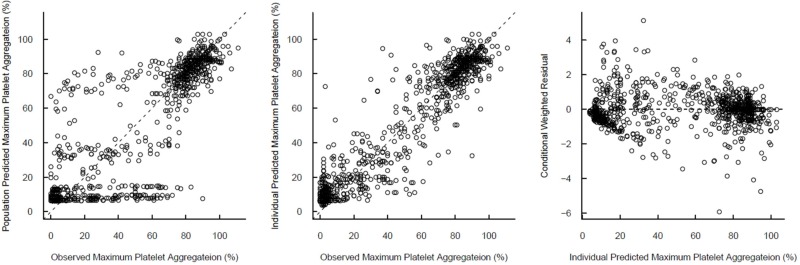 | Figure 2Diagnostic plots of the final in vitro PD model. Left, observed vs. predicted (open circles: individual prediction, filled triangles: population prediction). Right, population predicted vs. conditional weighted residuals (CWRES).
|
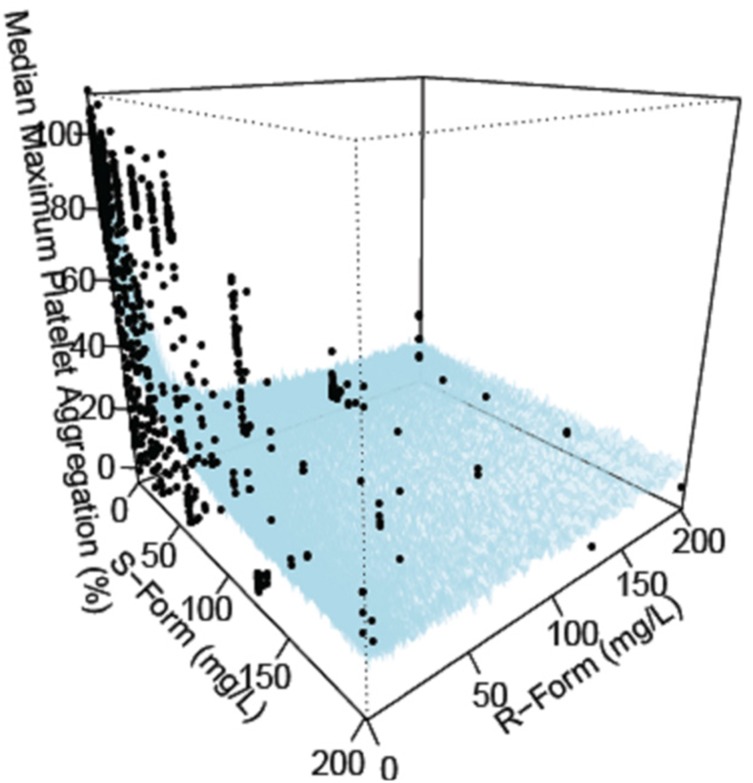 | Figure 3Response surface plot for model predicted median versus observed (black circle) maximum platelet inhibition on various combination of R- and S-indobufen.
|
Table 1
Population parameter estimates and bootstrap results for the final pharmacodynamic model
![]()
Monte-Carlo simulation
Simulation study suggested that rac-indobufen 200 mg twice daily doses, a current therapeutic dose is not enough to produce maximal anti-platelet effect. 200 mg twice daily administration of S-indobufen alone was predicted to produce more treatment effect than rac-indobufen. S-indobufen exerted its maximal effect from a lower plasma concentration (>40 mg/L) than R-indobufen (>140 mg/L). However, the inter-individual variations of the relationship between the plasma concentration and the anti-platelet effect was smaller in R-indobufen (Fig. 4).
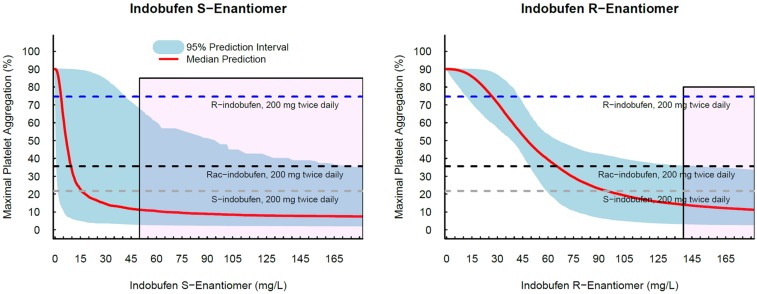 | Figure 4Simulated pharmacodynamic effect of R- and S-indobufen. The black horizontal dotted line indicates the median predicted maximal platelet aggregation (MPA) on multiple dosing of indobufen at 400 mg/day, which is 35.60 % and was obtained from Monte-Carlo simulation using the average steady state concentrations of S- and R-indobufen in a literature[5] and the PD model constructed in this study; The blue horizontal dotted line indicates the median MPA on multiple dosing of R-indobufen only at 200 mg/day, which is 11.90 % and was obtained from Monte-Carlo simulation using the clearance of R-indobufen in a literature[5] and the PD model; The gray horizontal dotted line indicates the median MPA on multiple dosing of S-indobufen only at 200 mg/day, which is 7.58 % and was obtained from Monte-Carlo simulation using the clearance of S-indobufen in a literature[5] and the PD model. *Platelet aggregation was determined using a Chrono-log Lumi-Aggregometer as the percent change from the baseline.
|
Go to :
Discussion
The present study characterized the anti-platelet effect of S- and R-indobufen by PD modeling of in vitro data and then predicted the human responses through Monte-Carlo simulation using the PD model and human PK data from a literature. Response-surface model was applied to evaluate the anti-platelet effect of both S- and R-indobufen simultaneously. The effect of indobufen was well-described by the inhibitory sigmoid Imax model with no significant interaction between S- and R-indobufen. Based on the final PD model, Monte Carlo simulation was performed to predict the optimal dosing regimens for S- and R-indobufen as a single formulation.
Indobufen is a selective inhibitor of cyclooxygenase activity in human platelets, and this inhibitory effect is mainly attributed to the S-enantiomer of the drug. S-indobufen is known to be twice as potent as racemic indobufen in inhibiting platelet aggregation and thromboxane formation.[2] In the present study, S-indobufen was found to be 7.2-fold more potent than R-indobufen (Table 1). However, R-indobufen can inhibit the same enzyme at higher concentrations.[2] Large inter-individual variability in the anti-platelet effect indicates that the development of a pure enantioselective indobufen is worthwhile. While S-indobufen is more potent than R-indobufen, R-indobufen has more favorable characteristics in terms of unexplainable inter-individual variability, which indicates the size of uncertainty in the anti-platelet effect when prescribed, as can be seen in the estimated inter-individual variability was 200.1% (in CV) for S-indobufen and 48.4% for R-indobufen (Table 1). The simulated 95% prediction interval was much wider in S-indobufen than in R-indobufen (Fig. 4). As shown in Figure 4, the maximal inhibitory effect was achieved approximately at >40 mg/L for S-indobufen, and >140 mg for R-indobufen. Those concentrations correspond to about 500 mg, twice daily dose for S-indobufen, and 1,000 mg, twice daily dose for R-indobufen based on steady state concentration of R- and S-indobufen on rac-indobufen in a previous study[5] and the assumption of linear PK. The doses are relatively high considering the current therapeutic doses of rac-indobufen. Therefore, To develop the enantioselective indobufen formulations, the tolerability at the doses should be evaluated at the beginning of the clinical development.
The present study had several limitations. The simulation was performed using in vitro and a literature data. Therefore additional clinical data including human in vivo PK/PD data are required to validate these results. The sample size was also small and clinical covariates has not been screened due to the homogeneity of the study population.
Go to :
Conclusions
The present study characterized the anti-platelet effect of indobufen using population PD modeling and simulation analysis. The effect of indobufen was well-described by the inhibitory sigmoid Imax model in the response-surface model. S-indobufen was more potent than R-indobufen, while the inter-individual variability was smaller in R-indobufen than S-form. The simulation predicted concentrations for maximal therapeutic effect is >140 mg/L for R-indobufen and > 50 mg/L for S-indobufen. The present methodology can be applied to the develop novel enantio-selective drugs more efficiently.
Go to :
 XML Download