Abstract
The three flavone glycosides, 4′-O-methylisoscutellarein 7-O-(6″′-O-acetyl)-β-D-allopyranosyl(1 → 2)-β-D-glucopyranoside (1), isoscutellarein 7-O-(6″′-O-acetyl)-β-D-allopyranosyl(1 → 2)-β-D-glucopyranoside (3), and isoscutellarein 7-O-β-D-allopyranosyl(1 → 2)-β-D-glucopyranoside (4) in addition to a flavonol glycoside, kaempferol 3-O-β-D-glucopyranoside (astragalin, 2), were isolated from Stachys japonica (Lamiaceae). In cholinesterase inhibition assay, compound 1 significantly inhibited aceylcholinesterase (AChE) and butyrylcholinesterase (BChE) activities (IC50 s, 39.94 μ g/ml for AChE and 86.98 μ g/ml for BChE). The content of isolated compounds were evaluated in this plant extract by HPLC analysis. Our experimental results suggest that the flavonoid glycosides of S. japonica could prevent the memory impairment of Alzheimer's disease.
REFERENCES
(1). Balkis A., Tran K., Lee Y. Z., Ng K.See comment in PubMed Commons below J. Agric. Sci. 2015; 7:1916–9760.
(2). Luo W., Chen Y., Wang T., Hong C., Chang L. P., Chang C. C., Yang Y. C., Xie S. Q., Wang C. J.Bioorg. Med. Chem. 2016; 24:672–680.
(3). Kim T. J.Korean Plant Resources; Publishing Center of Seoul National University: Korea. 1996; 54–55.
(4). Nishimura H., Sasaki H., Inagaki N., Chin M., Mitsuhashi H.Phytochemistry. 1991; 30:965–969.
(5). Harada S., Tsujita T., Ono A., Miyagi K., Mori T., Tokuyama S. J.Nutr. Sci. Vitaminol. 2015; 61:167–174.
(6). Rahimi Khoigani S., Rajaei A., Goli S. A.Nat. Prod. Res. 2017; 31:355–358.
(7). Venditti A., Serrilli A. M., Di Cecco M., Ciaschetti G., Andrisano T., Bianco A.Nat Prod Res. 2013; 27:190–193.
(8). Petreska J., Stefova M., Ferreres F., Moreno D. A., Tomás-Barberán F. A., Stefkov G., Kulevanova S., Gil-Izquierdo A.Food Chem. 2011; 125:13–20.
(9). Pereira O. R., Domingues M. R. M., Silva A. M. S., Cardoso S. M.Food Res. Intern. 2012; 48:330–335.
(10). Cui Q., Pan Y., Xu X., Zhang W., Wu X., Qu S., Liu X.Fitoterapia. 2016; 109:67–74.
(11). Park H. J., Nugroho A., Jung B. R., Won Y. H., Jung Y. J., Kim W. B., Choi J. S. Kor. J.Plant Res. 2010; 23:393–398.
(12). Park H. J., Young H. S., Park K. Y., Rhee S. H., Chung H. Y., Choi J. S.Arch. Pharm. Res. 1991; 14:167–171.
(13). Teles Y. C. F., Horta C. C. R., de Fátima Agra M., Siheri W., Boyd M., Igoli J. O., Gray A. I., de Fátima Vanderlei de Souza M.Molecules. 2015; 20:20161–20172.
(14). Ellman G. L., Courtney K. D., Andres V. Jr., Feather-stone R. M.Biochem. Pharmacol. 1961; 7:88–95.
(15). Demirtas I., Gecibesler I. H., Yaglioglu A. S.Phytochemistry Lett. 2013; 6:209–214.
(16). Venditti A., Bianco A., Nicoletti M., Quassinti L., Bramucci M., Lupidi G., Vitali L. A., Papa F., Vittori S., Petrelli D., Maleci Bini L., Giuliani C., Maggi F.Chem. Biodivers. 2014; 11:245–261.
(17). Brühmann C., Marston A., Hostettmann K., Carrupt P. A., Testa B.Chem. Biodivers. 2004; 1:819–829.
(18). Kubínová R., Švajdlenka E., Jankovská D.Nat. Prod. Res. 2016; 30:1174–1177.
(19). Goutman J. D., Waxemberg M. D., Doñate-Oliver F., Pomata P. E., Calvo D. J.Eur. J. Pharmacol. 2003; 461:79–87.
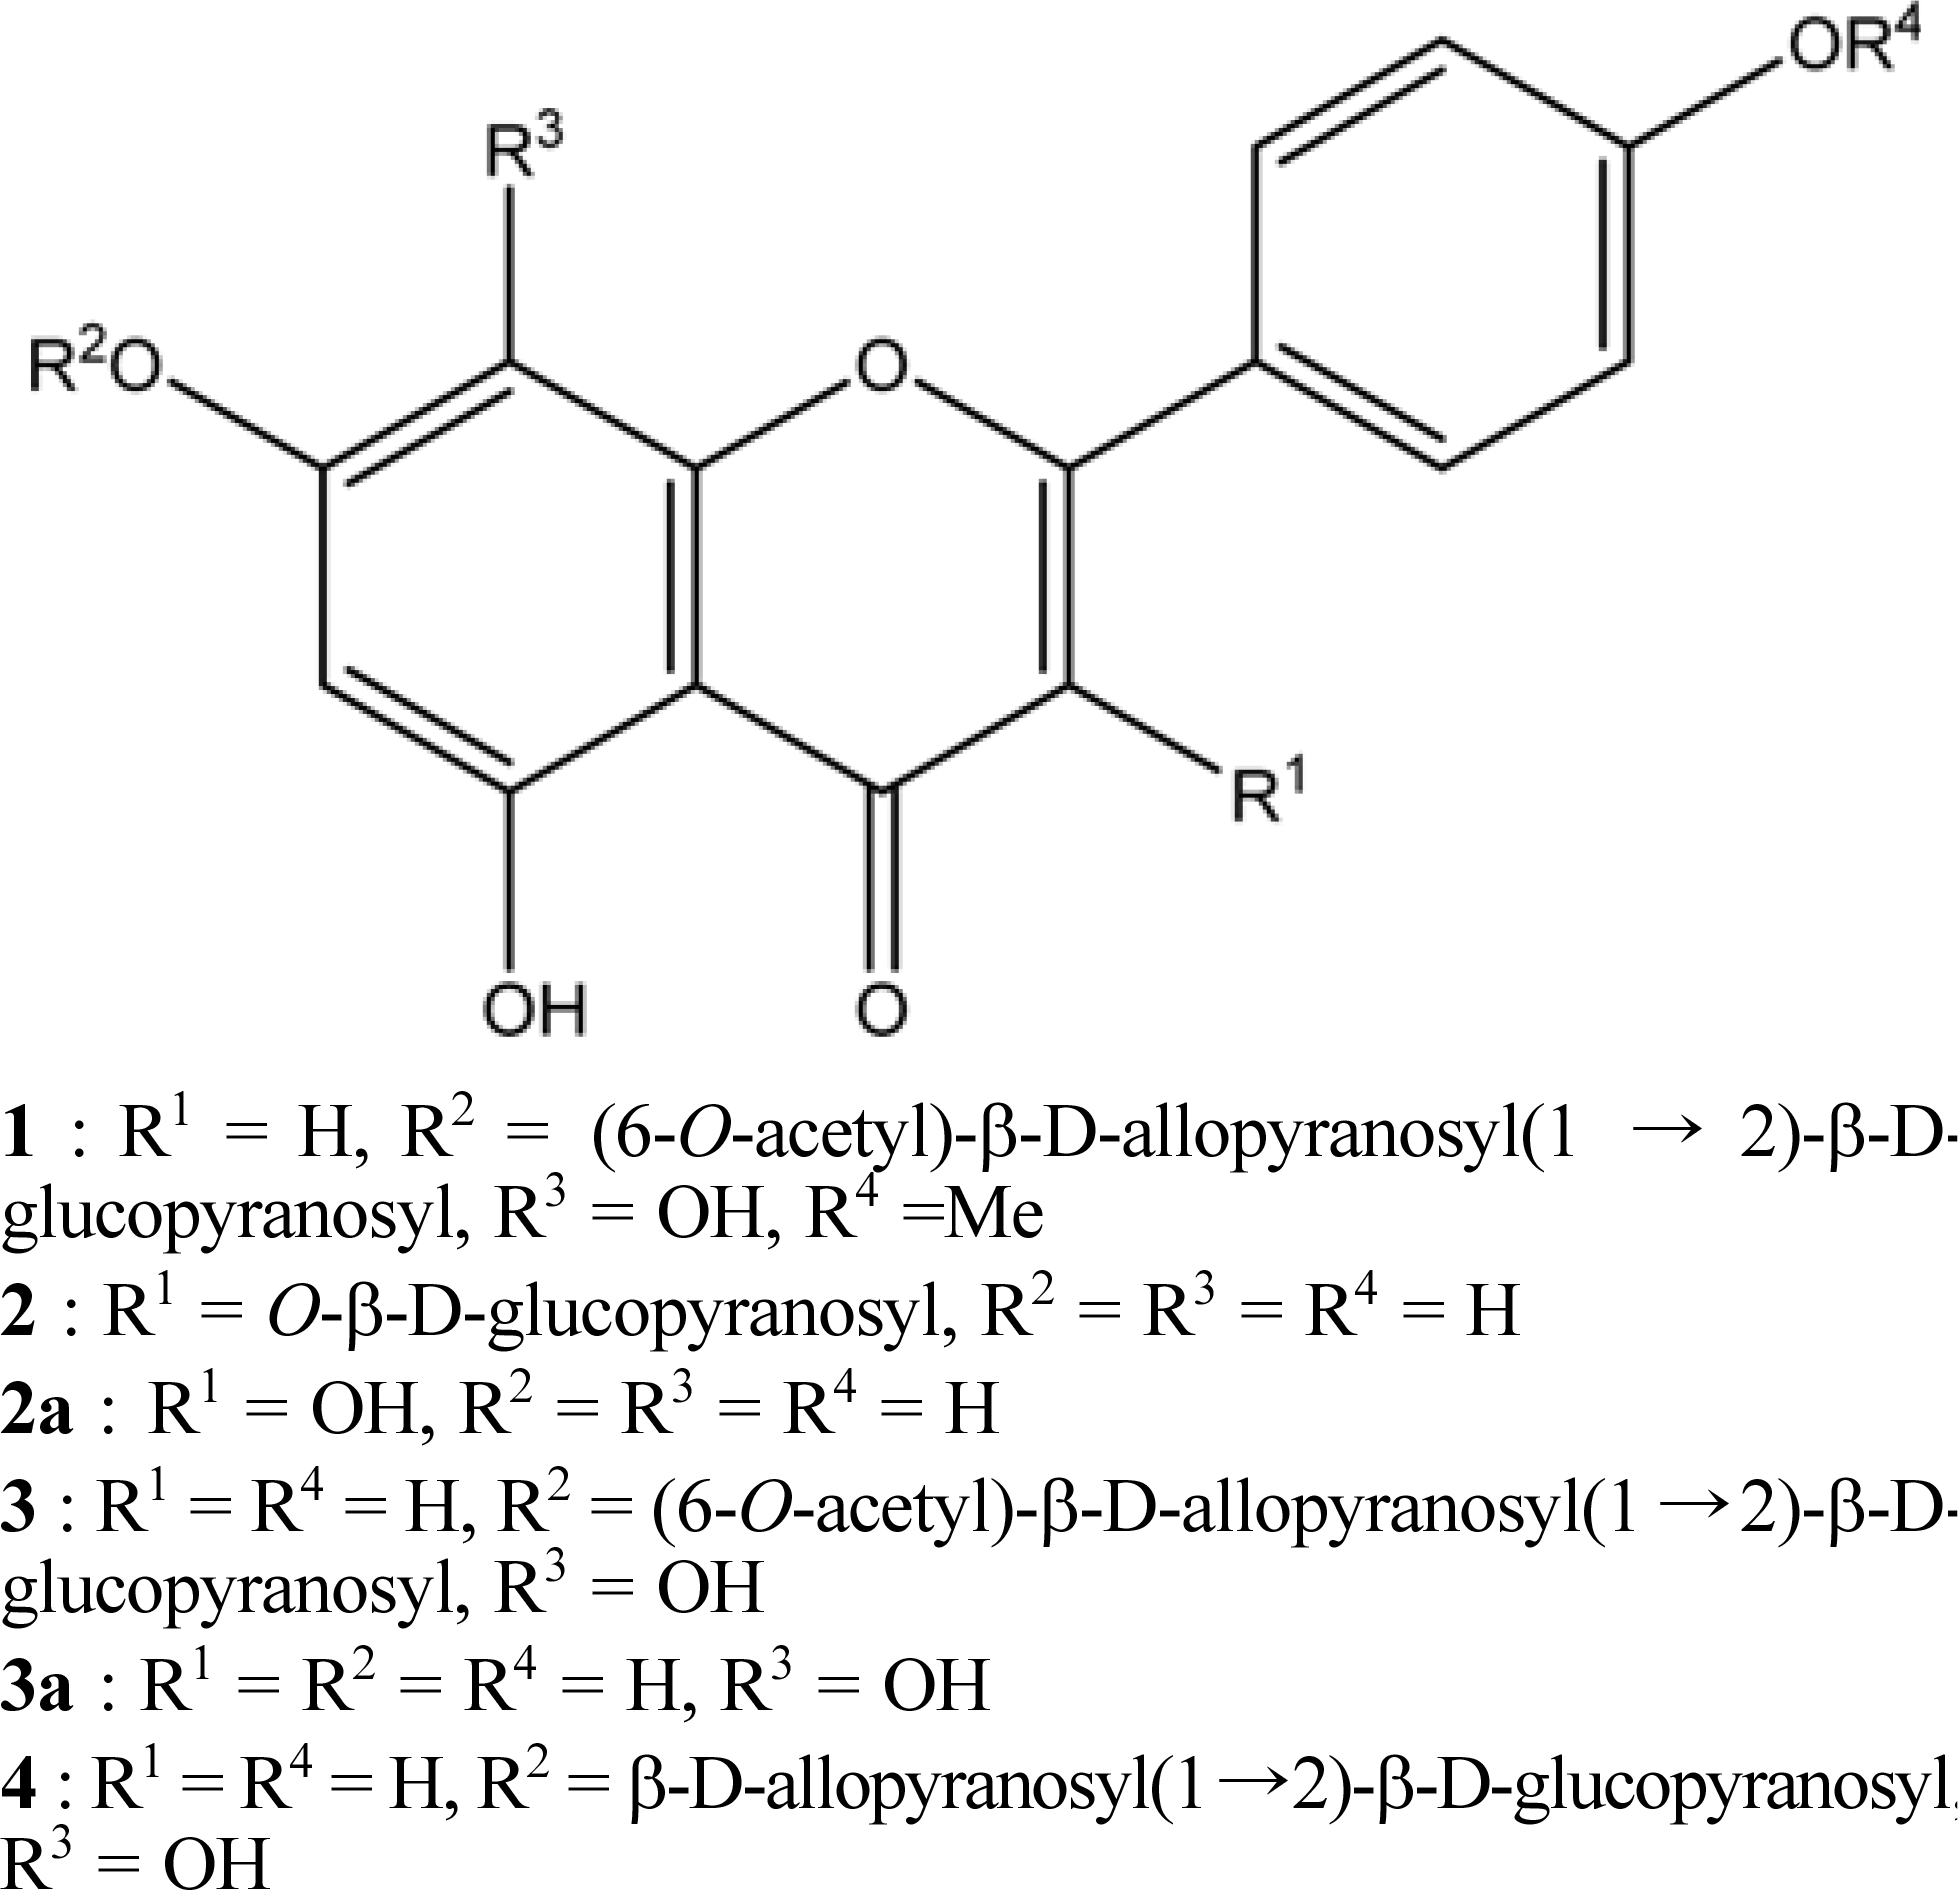
Fig. 1.
Structure of flavonoid glycosides (1–4) isolated from S. japonica and their aglycones (2a and 3a).

Table 1.
1H-NMR data of compounds 1, 3, and 4 isolated from S. japonica (600 MHz, DMSO-d6)
Table 2.
13 C-NMR data of compounds 1, 3, and 4 isolated from S. japonica (150 MHz, DMSO-d6)
Table 3.
Cholinesterase inhibitory activities of the S. japonica extract, its fractions and isolated compounds
| Samples | AChEa | BChE |
|---|---|---|
| Mean ± SEM | Mean ± SEM | |
| Aq. MeOH extract | 86.09 ± 1.27 | 172.88 ± 0.71 |
| CHCl3 fraction | 68.66 ± 1.32 | 133.96 ± 2.43 |
| BuOH fraction | 74.20 ± 2.20 | 117.94 ± 7.61 |
| 1 | 39.94 ± 0.76 | 86.98 ± 1.72 |
| 2 | 66.76 ± 2.82 | > 200 |
| 3 | 65.40 ± 0.45 | 109.76 ± 2.79 |
| 4 | 59.55 ± 2.92 | 160.84 ± 3.26 |
| 2a | 32.19 ± 0.82 | 52.34 ± 1.51 |
| 3a | 58.19 ± 1.11 | 79.60 ± 0.28 |
| Apigeninb | 12.80 ± 0.37 | 9.18 ± 0.67 |
Table 4.
Linearity of standard curves and limits of detection and quantification for the standard compounds
| Compound | t R (min) | Calibration equation (linear model)a | Linear range (µg/ml) | R2b | LODc (µg/ml) | LOQd (µg/ml) |
|---|---|---|---|---|---|---|
| 1 | 20.11 | y = 157.68 x + 113.14 | 7.81–250.0 | 0.999 | 1.18 | 3.95 |
| 2 | 16.92 | y = 378.45 x + 106.78 | 7.81–250.0 | 0.999 | 0.51 | 1.70 |
| 2a | 22.10 | y = 957.20 x + 158.03 | 7.81–250.0 | 0.999 | 0.15 | 0.49 |
| 3 | 17.22 | y = 278.85 x + 122.48 | 7.81–250.0 | 0.999 | 0.63 | 2.12 |
| 3a | 17.98 | y = 313.95 x + 86.27 | 7.81–250.0 | 0.999 | 0.68 | 2.27 |
| 4 | 14.83 | y = 95.75 x + 55.73 | 7.81–250.0 | 0.999 | 2.03 | 6.76 |
Table 5.
Content of six compounds (mg/g) in the extract and fractions of Stachys


 PDF
PDF ePub
ePub Citation
 Print
Print


 XML Download