

 PDF
PDF ePub
ePub Citation
 Print
Print


INTRODUCTION
Dual-energy CT (DECT) is now re-emerging in the field of clinical radiology with the recent technical developments in CT (1). By using two different X-ray energy spectra or tube voltages, DECT allows for a number of applications including monoenergetic extrapolation. Virtual monoenergetic image (VMI) reconstruction at several different energies (kiloelectron volts [keVs]) is possible by performing a post-processing algorithm, revealing various image parameters such as attenuation and noise from a single CT exposure (2). The benefit of this post-processing algorithm is well established for improving iodine contrast in low keV CT angiography images and reducing metal artifacts in high keV CT angiography images (345). However, quantitative image quality, such as contrast-to-noise ratio (CNR) or signal-to-noise ratio (SNR), remain reduced in low keV levels given that the increase in image noise at low keV levels is greater than the increase in contrast attenuation (26).
Recently, an noise-optimized VMI was introduced that performs a regional spatial frequency-based recombination of higher signals at lower energies and superior noise properties at medium energies, to avoid increased noise at lower calculated energies (7). Objective and subjective image quality at low keV levels (40–60 keV) has been shown superior compared to that of the conventional technique in adult studies (8910).
However, DECT imaging for children can be actually different from adults. In technical aspect, dual-source DECT technique is particularly useful and advocated in children more than other dual-energy techniques due to its better radiation dose efficiency and the maximized dual energy spectral contrast, which can be achievable in children using a newer generation of dual-source CT system (1). Regarding the optimal keV level of VMI, it would be different from adults. Because of the small body diameters of children, the transmitted X-ray spectrum is much softer than for adults. Hence, the optimal energy level of the virtual monochromatic imaging could be lower than for adults. Additionally, reasonably higher image quality is required for children due to their lower proportion of body fat and smaller size than adults, which may lead to subjectively different optimal VMI energy level.
To the best of our knowledge, the optimal energy level, using noise-optimized or conventional algorithm in dual-source dual-energy abdominopelvic CT in pediatrics, has not been investigated. Thus, the purpose of this study was to determine the optimal VMI energy levels with both conventional and noise-optimized monoenergetic reconstruction algorithms in order to maximize image quality in abdominopelvic DECT in pediatric patients and to compare image quality between two monoenergetic reconstruction algorithms.
MATERIALS AND METHODS
This retrospective, single-center study was approved by our Institutional Review Board. The requirement for written informed consent was waived due to the mandatory nature of abdominopelvic CT examination in routine clinical practice.
Patient Selection
We evaluated a total of 37 abdominopelvic DECT images of pediatric patients (aged younger than 18 years), performed at our institution from July to November 2015, using a standard DECT protocol for the following indications: abdominal pain (n = 12), fever (n = 1), evaluation for hidden malignancy (n = 1), routine follow-up for lymphoma (n = 12), neuroblastoma (n = 4), rhabdomyosarcoma (n = 2), Wilm's tumor (n = 2), hepatoblastoma (n = 1), immature teratoma (n = 1), mixed germ cell tumor (n = 1), and rhabdoid tumor of the kidney (n = 1). Because dose-neutrality of dual-source DECT has been validated in previous studies (1112) and it offers additional advantages of post-processing images such as virtual non-contrast image, iodine map that are unavailable with single energy CT, routine abdominopelvic CT was performed with dual-source DECT technique in that period according to our department policy.
One patient with severe pancreatic atrophy was excluded due to difficulty in measuring the region of interest (ROI) in the pancreas. Thus, 36 consecutive abdominopelvic DECT examinations acquired from 36 children (mean age, 9.7 years; range, 13 months–17 years; 27 boys and 9 girls), were included in our study.
Image Acquisition
Imaging data was acquired with a 128-channel scanner (SOMATOM Definition Flash; Siemens Healthineers, Forchheim, Germany) using two X-ray tubes with two different kV settings, 80 kVp and 140 kVp. Detailed settings were as follows: detector collimation, 128 x 0.6 mm; rotation time, 0.28 seconds; pitch, 0.6; reference tube current-time product for 80 kVp tube, 200 mAs and for Sn140 kVp tube, 77 mAs. Scan range included from top of liver to pubic symphysis. A total amount of 1.8 mL/kg of iodinated contrast media at a concentration of 350 mgI/mL (iobitridol, Xenetix 350; Guerbet, Aulnay-sous-Bois, France) was administered via a peripheral vein of the upper extremity for 50 seconds, followed by a saline chase up to 20 mL using an automatic power injector (Envision CT; Medrad, Pittsburgh, PA, USA). DECT images were acquired at a fixed delay of 80 seconds after initiation of contrast administration. Intravenous saline injection was stopped at the beginning of the CT scanning. In our institution, the late portal-venous phase at 80 seconds after contrast media administration was chosen for DECT, because homogeneous enhancement of hepatic vessels, hepatic parenchyma, and renal parenchyma including the medulla can be achieved in the late portal-venous phase. Although a fixed delay technique may not be widely used in children, we decided to apply a fixed-delay time, because it is technically simple and it would suffice for most routine indications in children (13). Seven children (19.44%) were sedated with per-oral chloral hydrate syrup (50 mg/kg).
Monoenergetic image sets were reconstructed from 40 keV to 100 keV at 10 keV intervals using both conventional and noise-optimized reconstruction algorithms, resulting in 7 image sets for each algorithm. Although DECT, as used for this study, enables reconstruction of monoenergetic images above 100 keV, we did not perform reconstruction at higher keV levels, because iodine attenuation is likely to be too faint (7). All image series were reconstructed with dedicated iterative reconstruction (SAFIRE; Siemens Healthineers) using a strength level of 3 and a medium-smooth soft-tissue DECT kernel (Q30f).
Quantitative Image Analysis
The 36 DECT examinations that were reconstructed resulted in a total of 504 image sets. For every VMI image set, one radiologist (3 years of pediatric imaging experience) obtained a mean and standard deviation (SD) CT attenuation, in Hounsfield units (HUs), for each organ, by manually placing round ROIs at the same image level. The reader was blinded to the reconstruction sets, and used a commercially available picture archiving and communications system workstation (Infinitt PACS; Infinitt Healthcare, Seoul, Korea) on a standard reading monitor (ME315L; Totoku Electric Co. Ltd., Tokyo, Japan).
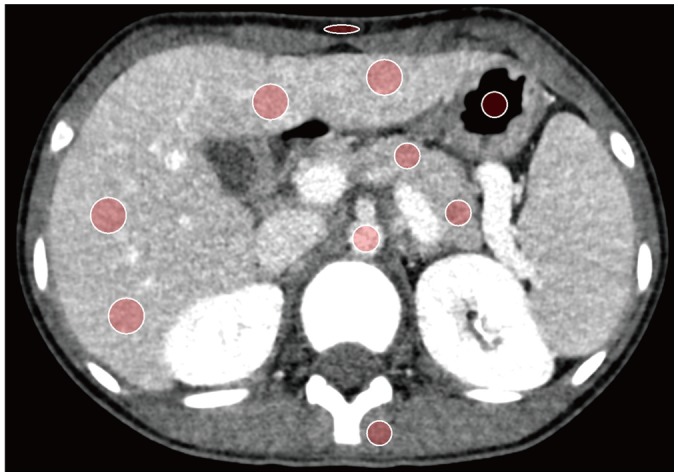
The attenuation and SD of the aorta were obtained from a single drawn ROI (mean area, 61 mm2; range, 19–150 mm2) as large as the lumen of the vessel. The attenuation and SD of the liver were obtained as the mean of four ROIs (mean area, 166 mm2; range, 82–288 mm2) positioned in anterior-posterior segments of the right hepatic lobe and medial-lateral segments of the left hepatic lobe. Large hepatic vessels and focal lesions in liver parenchyma were carefully avoided. The attenuation and SD of the pancreas were obtained as the mean of three ROIs (mean area, 65 mm2; range, 23–124 mm2), which were positioned at the level of the pancreatic head, body, and tail. Large vessels, pancreatic ducts, and focal lesions in the pancreatic parenchyma were carefully avoided. The attenuation and SD of the paraspinal muscle was obtained from a single ovoid ROI (mean area, 117 mm2; range, 23–336 mm2) with avoiding areas of fat infiltration on the image obtained at the level of the iliac crest. The attenuation and SD of the subcutaneous fat of anterior abdominal wall was obtained from a single ovoid ROI (mean area, 86 mm2; range, 6–280 mm2). We obtained the attenuation and SD of the air in the bowel lumen by drawing a round ROI (mean area, 128 mm2; range, 64–235 mm2). Image noise was defined as the SD of the pixel values obtained from air (14).
All measurements were carried out in triplicate and averaged to ensure accuracy of the values. Image sets from the same examination, including size, shape, and position of the ROIs, were kept constant by applying a copy and paste function at the workstation (Fig. 1).
For each of the image sets, the CNR and SNR, relative to the muscle for the aorta, liver, and pancreas were calculated using the following equations: CNR = (ROIo − ROIm) / SDn, SNR = ROIo / SDn, where ROIo is the mean attenuation for the organ of interest, ROIm is the mean attenuation for the paraspinal muscles, and SDn is the mean image noise (15).
Qualitative Image Analysis
Subjective image quality was assessed by two radiologists (with 12 and 3 years of pediatric imaging experience, respectively). The reviewers were blinded to the applied reconstruction technique and VMI energy level.
Using a 5-point Likert scale, image noise (ranging from 1 = extensive image noise to 5 = absence of noise) and image blurring (ranging from 1 = severe blurring, edge definition very poor, margins difficult to discern to 5 = no blurring, edges well defined, margins crisp) of solid organs were respectively scored. Bowel image quality (1 = bad, no diagnosis possible; 2 = poor, diagnostic confidence substantially reduced; 3 = moderate, but sufficient for diagnosis; 4 = good; 5 = excellent) was respectively evaluated. Additionally, severity of beam hardening artifact (ranging from 1 = massive streak artifacts that obscure the boundaries of the affected anatomic structure to 5 = barely perceptible) was also rated (16). Overall image quality was scored by averaging the each value.
Radiation Dose Evaluation
Volume CT dose index (CTDIvol) and dose length product (DLP) were obtained by reviewing the dose reports from each examination. CTDIvol was referenced to a 32-cm phantom.
Statistical Analysis
Paired t test was used for comparing quantitative and qualitative image parameters between noise-optimized VMI and conventional VMI in each same energy level. Significant differences in mean attenuation, noise, SNR and CNR between different virtual monoenergetic keV-levels, for the liver, pancreas, and aorta, were evaluated using repeated-measures analysis of variance. Post hoc analysis was conducted using the Dunnett test. Optimal monoenergetic levels (keV) for noise-optimized VMI and conventional VMI were determined based on overall image quality scores. Improvement ratios of noise-optimized VMI compared to conventional VMI at optimal keV levels were calculated for mean attenuation, noise, SNR, and CNR. Weighted Cohen's kappa coefficients (κ-values) were calculated for the assessment of interobserver agreements of overall image quality, bowel image quality, image noise and severity of beam hardening artifact. Kappa values were interpreted as follows: absence of agreement ≤ 0, poor agreement < 0.20, fair agreement 0.21–0.40, moderate agreement 0.41–0.60, good agreement 0.61–0.80 and excellent agreement > 0.80.
We classify all patients into two groups according to the patients' age, with infant or child (group 1; age ≤ 10 years, n = 20) and adolescence (group 2; age > 10 years, n = 16). Subgroup analysis was performed for each group, using same methods as aforementioned.
Commercially available software packages (SPSS 21.0 for Windows; IBM Corp., Armonk, NY, USA) were used for statistical analyses. A p value < 0.05 was considered to indicate statistical significance.
RESULTS
Mean Attenuation
Mean attenuations of the liver, pancreas, aorta, and air decreased stepwise with increased keV levels, while mean attenuation of subcutaneous fat gradually increased (Fig. 2). In case of the liver, pancreas, aorta and subcutaneous fat, noise-optimized VMI showed significantly higher attenuation than conventional VMI in the liver at 40–60 keV, pancreas at 40–50 keV, subcutaneous fat at 80 keV (all p < 0.05); however, the absolute attenuation difference between the two image sets was less than 1.4 HU. In case of air, noise-optimized VMI showed significantly lower attenuation at 40–70 keV, and higher attenuation at 80–100 keV (all p < 0.05). The absolute attenuation difference between the two image sets was less than 23.3 HU. At the other energy levels, there was no statistical difference in attenuation between two image sets (Table 1).
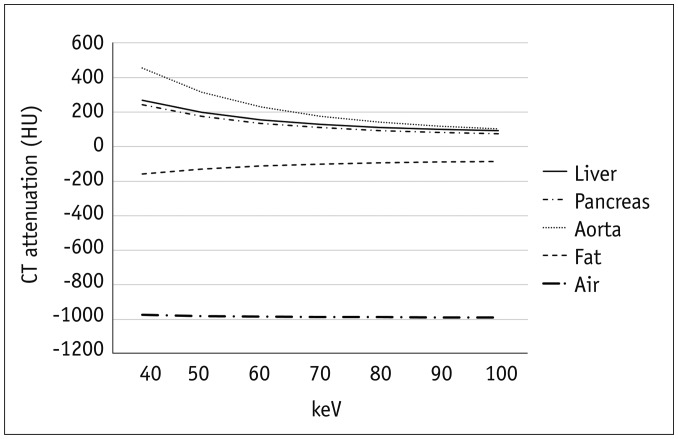
Fig. 2
Graphs of mean attenuation of liver, pancreas, aorta, subcutaneous fat, and air in mean of noise-optimized and conventional algorithms.
HU = Hounsfield unit, keV = kiloelectron volt
![]()
Table 1
Attenuation Number (HU) of Three Measured Organs, Subcutaneous Fat, and Air in Series Reconstructed with Noise-Optimized and Conventional Algorithms (keV)
![]()
Image Noise
The image noise was lowest at 70 keV for both noise-optimized and conventional VMIs (Fig. 3). With noise-optimized monoenergetic algorithm, noise decreased from 7.21 ± 1.31 (mean ± SD) at 40 keV to 6.44 ± 0.81 at 70 keV. With conventional monoenergetic algorithm, mean noise decreased from 25.37 ± 5.77 at 40 keV to 6.59 ± 0.85 at 70 keV. Image noise increased stepwise beyond the optimal energy levels for both algorithms; however, the extent of increase in noise at the higher energy levels was relatively small compared to at the lower energy levels. At all energy levels, noise-optimized VMI showed significantly lower image noise than conventional VMI (all p < 0.05), except at 80 keV (noise-optimized VMI vs. conventional VMI; 6.45 ± 0.85 vs. 6.90 ± 1.17, p = 0.071) (Table 2).
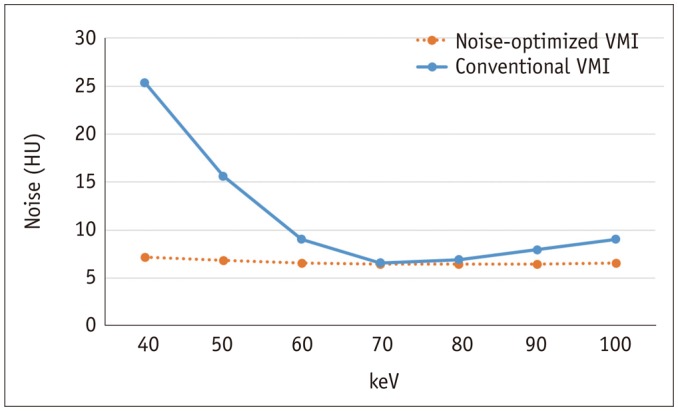
Table 2
Noise of Air and Subcutaneous Fat of Anterior Abdominal Wall in Series Reconstructed with Noise-Optimized and Conventional Algorithms (keV)
![]()
Standard deviation of subcutaneous fat was lowest at 90 keV and 70 keV for noise-optimized and conventional VMIs. The values decreased from 21.76 ± 4.42 (mean ± SD) at 40 keV to 9.01 ± 1.83 at 90 keV with noise-optimized VMI, and 38.19 ± 8.03 at 40 keV to 10.51 ± 2.21 at 70 keV with conventional VMI.
Signal-To-Noise Ratio
Figure 4 demonstrates an overview of the calculated SNR values. The maximum SNR with noise-optimized monoenergetic algorithm was achieved at 40 keV in all organs. SNRs in the liver, pancreas, aorta were 37.39 ± 6.45, 33.80 ± 5.26, and 63.21 ± 8.00, respectively. SNR peaked at 40 keV and gradually decreased when it got to higher keV levels. SNR values at 40 keV were significantly greater than those at all other energy levels in all organs (p < 0.001).
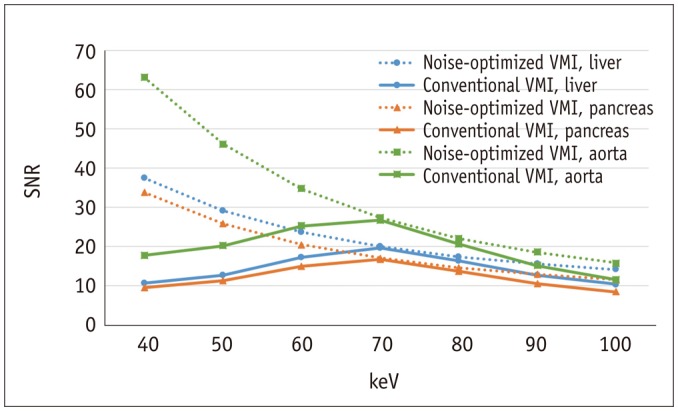
The maximum SNR with conventional monoenergetic algorithm was achieved at 70 keV in all organs. SNRs in the liver, pancreas and aorta were 19.57 ± 2.51, 16.66 ± 1.83, and 26.65 ± 3.16, respectively. SNRs gradually increased at low keV levels, peaked at 70 keV, and decreased at high keV levels, in all organs. SNRs at 70 keV were significantly greater than those at all other energy levels (p < 0.001).
SNR was significantly higher in noise-optimized VMI compared to conventional VMI in all measured organs at each energy level (p < 0.001) (Table 3).
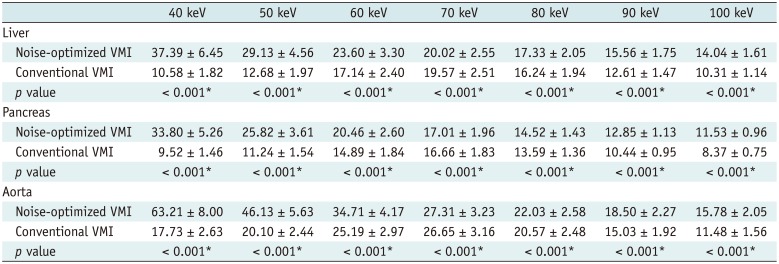
Table 3
SNR of Three Measured Organs in Series Reconstructed with Noise-Optimized and Conventional Algorithms (keV)
![]()
Contrast-To-Noise Ratio
Figure 5 summarizes the calculated CNR values in noise-optimized and conventional monoenergetic algorithms. The maximum CNR at noise-optimized VMI was achieved at 40 keV, in all organs (CNRs in the liver, pancreas and aorta were 20.93 ± 7.08, 17.34 ± 6.10, and 46.75 ± 8.84, respectively). All CNR values peaked at 40 keV and gradually decreased as keV levels increased. CNR at 40 keV was significantly greater than at all other energy levels in all organs (p < 0.001).
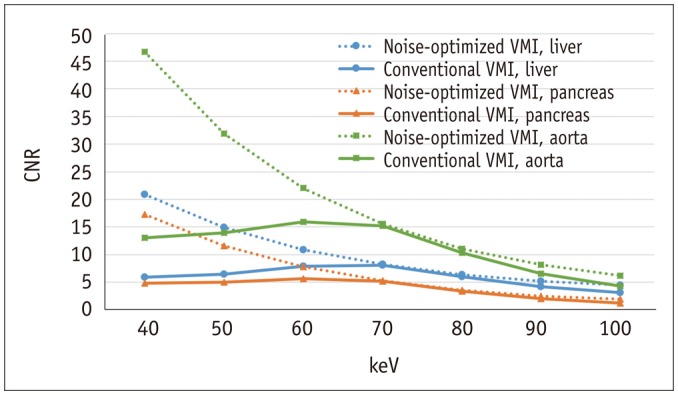
The maximum CNR at conventional VMI was achieved at 70 keV in the liver (8.12 ± 2.64) and at 60 keV in the pancreas (5.67 ± 2.18) and aorta (15.97 ± 3.31). CNR gradually increased at low keV levels, peaked at 60–70 keV, and decreased at high keV levels. Liver CNR at 70 keV was significantly greater than at all other energy levels (p = 0.006 at 60 keV, otherwise, p < 0.001). Pancreas and aorta CNR at 60 keV were significantly greater than at all other energy levels (p < 0.001).
CNR was significantly higher in noise-optimized VMI compared to conventional VMI at each energy level (p < 0.001), except for 70 keV in pancreas (noise-optimized VMI vs. conventional VMI; 5.29 ± 2.38 vs. 5.21 ± 2.23, p = 0.158) (Table 4).
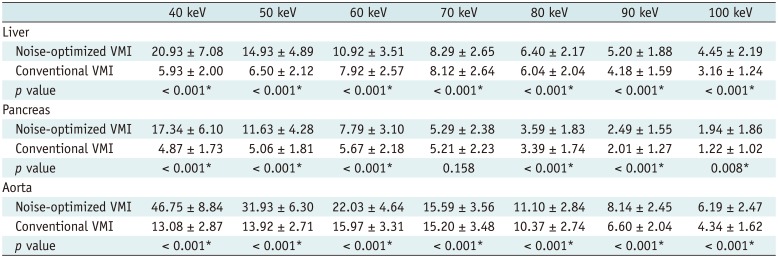
Table 4
CNR of Three Measured Organs in Series Reconstructed with Noise-Optimized and Conventional Algorithms (keV)
![]()
Subjective Image Analysis
The mean values of subjective image analysis in noise-optimized and conventional VMI in all energy levels of two readers were summarized in Table 5.
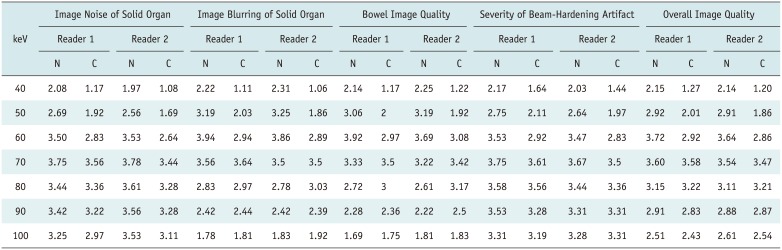
Table 5
Subjective Image Analysis in Series Reconstructed with Noise-Optimized and Conventional Algorithms (keV) between Two Readers
Values are expressed as mean. Inter-reader agreement for image noise (κ = 0.71, p < 0.001) and image blurring of solid organ (κ = 0.69, p < 0.001), bowel image quality (κ = 0.65, p < 0.001), and severity of beam-hardening artifact (κ = 0.75, p < 0.001) were all good. N = noise-optimized VMI, C = conventional VMI
![]()
In noise-optimized VMI, image noise score of solid organ (mean; 3.75 and 3.78 in reader 1 and 2) and severity score of beam-hardening artifact (3.75 and 3.67) were highest in 70 keV in both two readers. And 60 keV showed the highest score at image blurring of solid organ (3.94 and 3.86) and bowel image quality (3.92 and 3.69) in both two readers. As a result, despite the best CNR being achieved at 40 keV in all measured organs, 60 keV scored as the best overall image quality (3.72 and 3.64) in both two readers due to higher image noise, image blurring, lower bowel image quality and severe beam hardening artifact at keV levels less than 60 keV (Fig. 6).
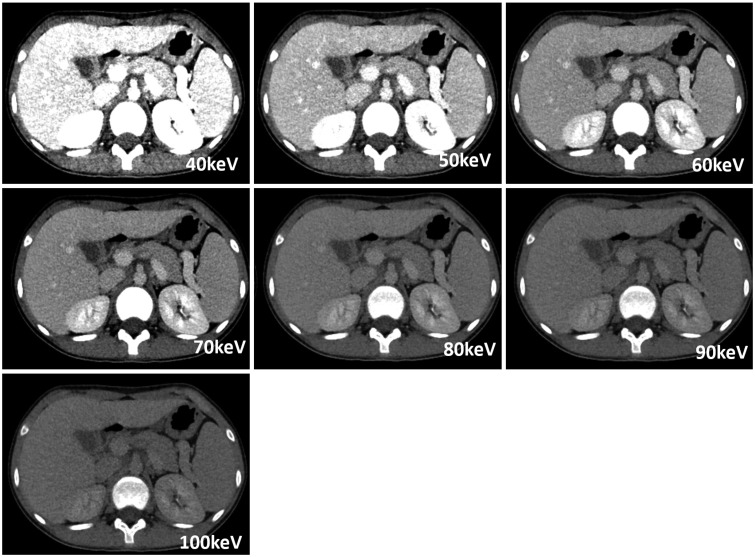
Fig. 6
Images obtained by noise-optimized algorithm with 40–100 keV energy levels.
Best CNR and SNR were obtained at 40 keV. In subjective analysis, 60 keV scored best in terms of overall image quality. Taken together, 60 keV was considered to be optimal VMI energy level for noise-optimized algorithm.
![]()
In conventional VMI, 70 keV showed the highest score at image noise (3.56 and 3.44) and image blurring of solid organs (3.64 and 3.5), bowel image quality (3.5 and 3.42) and severity of beam-hardening artifact (3.61 and 3.5) in two readers (Fig. 7). Overall image quality score was also highest in 70 keV with mean of 3.58 and 3.47 in reader 1 and 2, respectively.
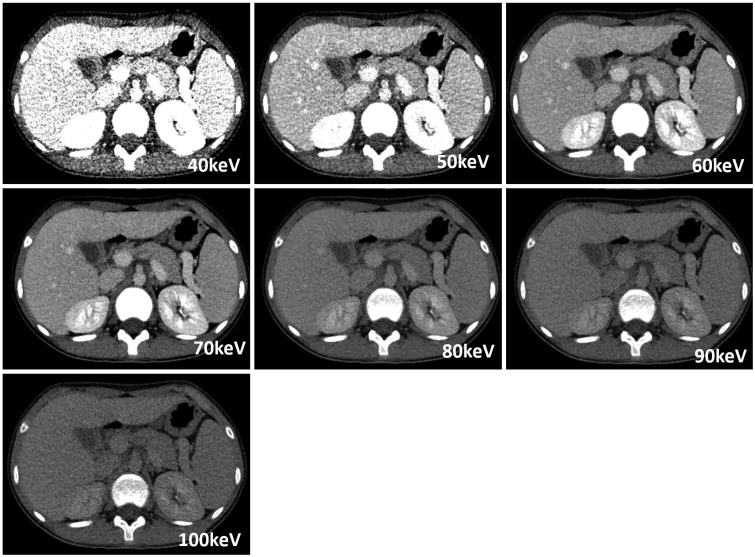
Fig. 7
Images obtained by conventional algorithm with 40–100 keV energy levels.
Best CNR was obtained at 60–70 keV, and best SNR was obtained at 70 keV. Further, 70 keV achieved best overall image quality score in subjective image analysis. Therefore, 70 keV was considered to be optimal VMI energy level for conventional algorithm.
![]()
Inter-reader agreement was all good in image noise (κ = 0.71, p < 0.001) and image blurring of solid organ (κ = 0.69, p < 0.001), bowel image quality (κ = 0.65, p < 0.001), and severity of beam-hardening artifact (κ = 0.75, p < 0.001).
Comparison between Noise-Optimized VMI and Conventional VMI in Optimal keV Levels
The optimal keV levels for noise-optimized and conventional monoenergetic algorithms were 60 keV and 70 keV, respectively. Noise-optimized VMI at 60 keV revealed significantly better SNRs, with relative difference of 20.6%, 22.9%, and 30.2% (liver, pancreas, and aorta, respectively) than conventional VMI at 70 keV (p < 0.001) (Table 6). The CNR improvement of noise-optimized VMI at 60 keV was also significant with 34.5%, 49.5%, and 44.9% (liver, pancreas, and aorta, respectively) of relative difference compared to conventional VMI at 70 keV (p < 0.001). Image noise showed no significant difference between noise-optimized VMI at 60 keV and conventional VMI at 70 keV (noise-optimized VMI vs. conventional VMI; 6.59 ± 0.76 vs. 6.59 ± 0.85, p = 0.982).
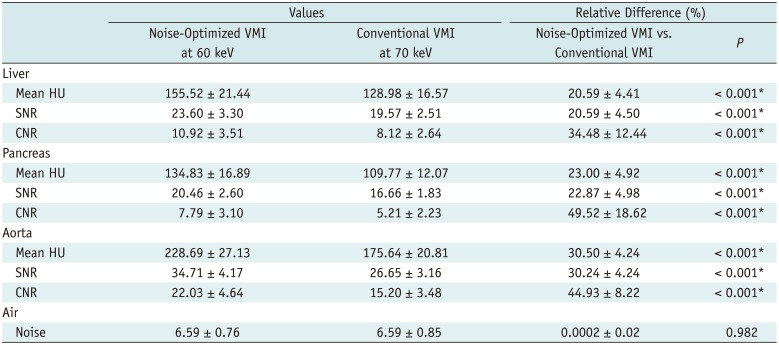
Table 6
Comparison of Objective Image Quality Indices between VMIs at 60 keV for Noise-Optimized Algorithm and VMIs at 70 keV for Conventional Algorithm in Three Measured Organs
![]()
In subjective image analysis, noise-optimized VMI at 60 keV received a significantly higher score than conventional VMI at 70 keV in overall image quality in both reader 1 (noise-optimized VMI vs. conventional VMI; 3.72 vs. 3.58, p = 0.048) and reader 2 (noise-optimized VMI vs. conventional VMI; 3.64 vs. 3.47, p = 0.042).
Subgroup Analysis
The results of quantitative and qualitative image analysis for two groups were summarized in Supplementary Tables 1, 2, 3, 4, 5 (in the online-only Data Supplement). The optimal energy levels for maximizing CNR, SNR, minimizing image noise, scoring best overall image quality were not different between two groups, and also similar as previously shown results evaluated from total patients.
Radiation Dose
The mean CTDIvol was 3.09 ± 1.66 mGy (range, 0.95–5.36 mGy) and the mean DLP was 134.77 ± 91.88 mGy·cm (range, 31–262 mGy·cm) in total population.
The mean CTDIvol was 1.98 ± 0.93 mGy (range, 0.95–3.69 mGy) in group 1, 4.88 ± 0.52 mGy (range, 4–5.36) in group 2. The mean DLP was 71.5 ± 46.95 mGy·cm (range, 31–164 mGy·cm) in group 1, 236 ± 25.5 mGy·cm (range, 20–262 mGy·cm) in group 2.
DISCUSSION
In our quantitative image analysis of abdominopelvic DECT for pediatric patients, the optimal energy levels for maximum CNR and SNR occurred at 60–70 keV and 70 keV, respectively, in conventional algorithm and at 40 keV in noise-optimized algorithm. In terms of subjective image quality assessment, the results were different from those of quantitative CNR and SNR analysis, especially for noise-optimized VMI (the optimal at 60 keV for overall image quality vs. at 40 keV for CNR and SNR). Although CNR and SNR are often used as an image quality indicator, consideration for the absolute noise level is also required. Increased CNR and SNR does not necessarily guarantee improved image quality, if the absolute noise level is clinically intolerable and a drastic increase in the absolute noise level could render an image non-diagnostic (1718). In our study, noise-optimized VMI at 40 keV showed the highest liver CNR of 20.93 and SNR of 37.39, while the SD of the air was 7.21, and the SD of the fat was 21.76, which could be unacceptably high, when we consider the mean muscle noise level of 13.1 HU with single-energy body CT in children (1219). On the contrary, noise-optimized VMI at 60 keV showed the lower noise level (6.59 at air, 12.36 at fat) at the expense of loss of CNR and SNR, but still higher than those of conventional VMI at 70 keV. Subjective overall image quality score increased from 2.15 and 2.14 at 40 keV to 3.72 and 3.64 at 60 keV in reader 1 and 2, respectively. In this regard, we think that subjective image quality could represent overall image quality more accurately, because subjective image quality assessment incorporates all of CNR, SNR, and noise level in addition to artifacts.
In previous adult studies, Sudarski et al. (20) reported that a conventional VMI algorithm showed optimal CNR and SNR at 60–70 keV in dual-energy CT angiography (DE-CTA) of the abdomen. Other adult studies using dual-source DECT in other body parts have showed similar results; the optimal keV level was 70 keV in pulmonary DE-CTA (3), 60 keV in cerebral and cervical DE-CTA (4). In addition, DECT acquired by fast kilovoltage switching technique showed the similar results. The optimal conventional VMI energy level for highest CNR was 68 keV in phantom study, and best image quality at 65–75 keV in unenhanced head CT (2122). In spite of the young age of our study sample, our results are in concordance with those of previous studies, showing maximum CNR and SNR, and overall image quality score at 70 keV with conventional VMI algorithm.
According to initial phantom study of noise-optimized VMI algorithm, the noise-optimized VMI technique provided increasing iodine CNR with decreasing keV, with the optimum CNR obtained at the lowest energy level of 40 keV (7). Schabel et al. (23) reported optimal CNR of intrahepatic veins in a poor contrast-enhanced condition obtained at 40 keV using the noise-optimized VMI technique on late-phase DECT imaging of the upper abdomen in adults. Albrecht et al. (10) reported that CNR at 40 keV achieved peak CNR in DECT angiography of the abdomen in adult population. Our study was in concord with these studies, with all measured organs showing peak CNR at 40 keV, gradually decreasing with increasing keV levels, suggesting that noise-optimized VMI can partially overcome noise limitation at low keV levels as shown in the conventional VMI technique. However, we have to be careful, as increased CNR does not always assure the improved image quality.
In adult studies, the effect of noise-optimized algorithm compared with conventional algorithm has been well established. Meier et al. (9) reported that noise-optimized VMI at 40 keV improved the contrast of DECT pulmonary angiography compared to conventional VMI at 60 keV. Similarly to previous adult studies, in our study, noise-optimized VMI at 40 keV showed superior CNR compared to all energy levels in conventional VMI. Compared with the best CNR achieved at 60–70 keV in conventional VMI, the CNR of noise-optimized VMI at 40 keV increased by an average of 285% in all measured organs. These results may potentially lead to reduction in contrast material with application of noise-optimized algorithm (34).
There are not many papers on radiation exposure of DECT in the pediatric population. Goo (24) reported that radiation exposure for dual-source DECT lung perfusion examinations was similar to that found in previous single-energy CT pulmonary angiogram study performed in children. Recently Zhu et al. (11) indicated that dual-source DECT is dose-neutral in imaging the head and abdomen in children, showing no difference in image quality. In this study, the average CTDIvol of dual-source dual-energy abdominopelvic CT was 3.09 mGy, which is lower to that of single-energy abdominopelvic CT (5.05 mGy) reported in a recent pediatric study (12). However, we also have to be aware that other DECT techniques such as rapid voltage-switching method or sequential dual scanning may increase radiation exposure and should be used cautiously especially in pediatric patients. Enhanced radiation dose efficiency of the dual-source dual-energy technique coupled with the highest dual-energy spectral contrast additionally available in newer generation dual-source CT system seems to be particularly useful for evaluating children (1).
In this study, we were able to perform dual-source DECT without increasing radiation exposure in pediatric population. Our study demonstrated that noise-optimized VMI technique could increase CNR, SNR, and subjective image quality, compared to the conventional VMI in dual-energy abdominopelvic CT of children. Especially considering the same effect on the younger group (age 0–10) in subgroup analysis, improved image quality at low keV levels in noise-optimized VMI may enhance diagnostic confidence in small-sized pediatric patients.
Our study has several limitations. Firstly, this study was performed retrospectively, so that selection bias could be occurred. Secondly, this study was a single-center study, and the number of patients was small considering the diversity in body size and composition in children. Although noise-optimized VMI at 60 keV generally showed the best imaging quality of children of our study, some young children may show better image quality at different levels of VMI (e.g., 40 keV or 50 keV). Therefore, further evaluation may be required in a large study population to present body size-adapted optimal levels covering different age groups in children. Thirdly, this study did not evaluate lesion detectability because of little lesions in the organs of included patients. Future studies will be needed to show noise-optimized algorithm at optimal VMI energy level actually increases the lesion conspicuity in the pediatric abdominopelvic CT.
In conclusion, noise-optimized algorithm shows superior qualitative and quantitative image qualities compared to those of conventional algorithm in dual-energy pediatric abdominopelvic CT. Therefore, noise-optimized algorithm should be applied in pediatric abdominal CT imaging, if available. For overall image quality improvement, 60 keV is recommended in noise-optimized VMI.
 XML Download